| Welcome back to COVID in Minnesota TODAY, an email newsletter from MPR News about understanding the latest developments in Minnesota's COVID-19 outbreak. | | |
|
|
Minnesota's increase in cases over the past three weeks has been sustained and significant enough that I think we can say what we're seeing is probably Minnesota's fourth wave.
The question, however, is how serious this wave will be. Our third wave, which kicked off in mid-March 2021 when just over 20 percent of Minnesotans had at least one dose, was noticeably milder than the first two waves. When cases started to rise around June 1, around 55 percent of Minnesotans had at least one dose.
In other words, that's 1.8 million fewer susceptible people out there to catch and spread the disease.
So it's entirely possible — maybe even likely — that this wave peaks in about three weeks with relatively modest topline numbers.
But we have to remember that the lion's share of these infections (and an even larger share of serious infections) are happening among the 40 percent or so of the population that's not yet vaccinated. So these smaller total figures can disguise just how serious the outbreak may be among the smaller susceptible population.
I'll look at all of this below: |
| |
|
|
Three things to know
| - Cases are rising consistently — but at a much slower pace than past waves
- Hospitalizations in particular are rising more slowly, with many vulnerable Minnesotans already vaccinated
- We don't yet know how bad things will get in the next three weeks or so before this wave's likely peak
|
| |
|
|
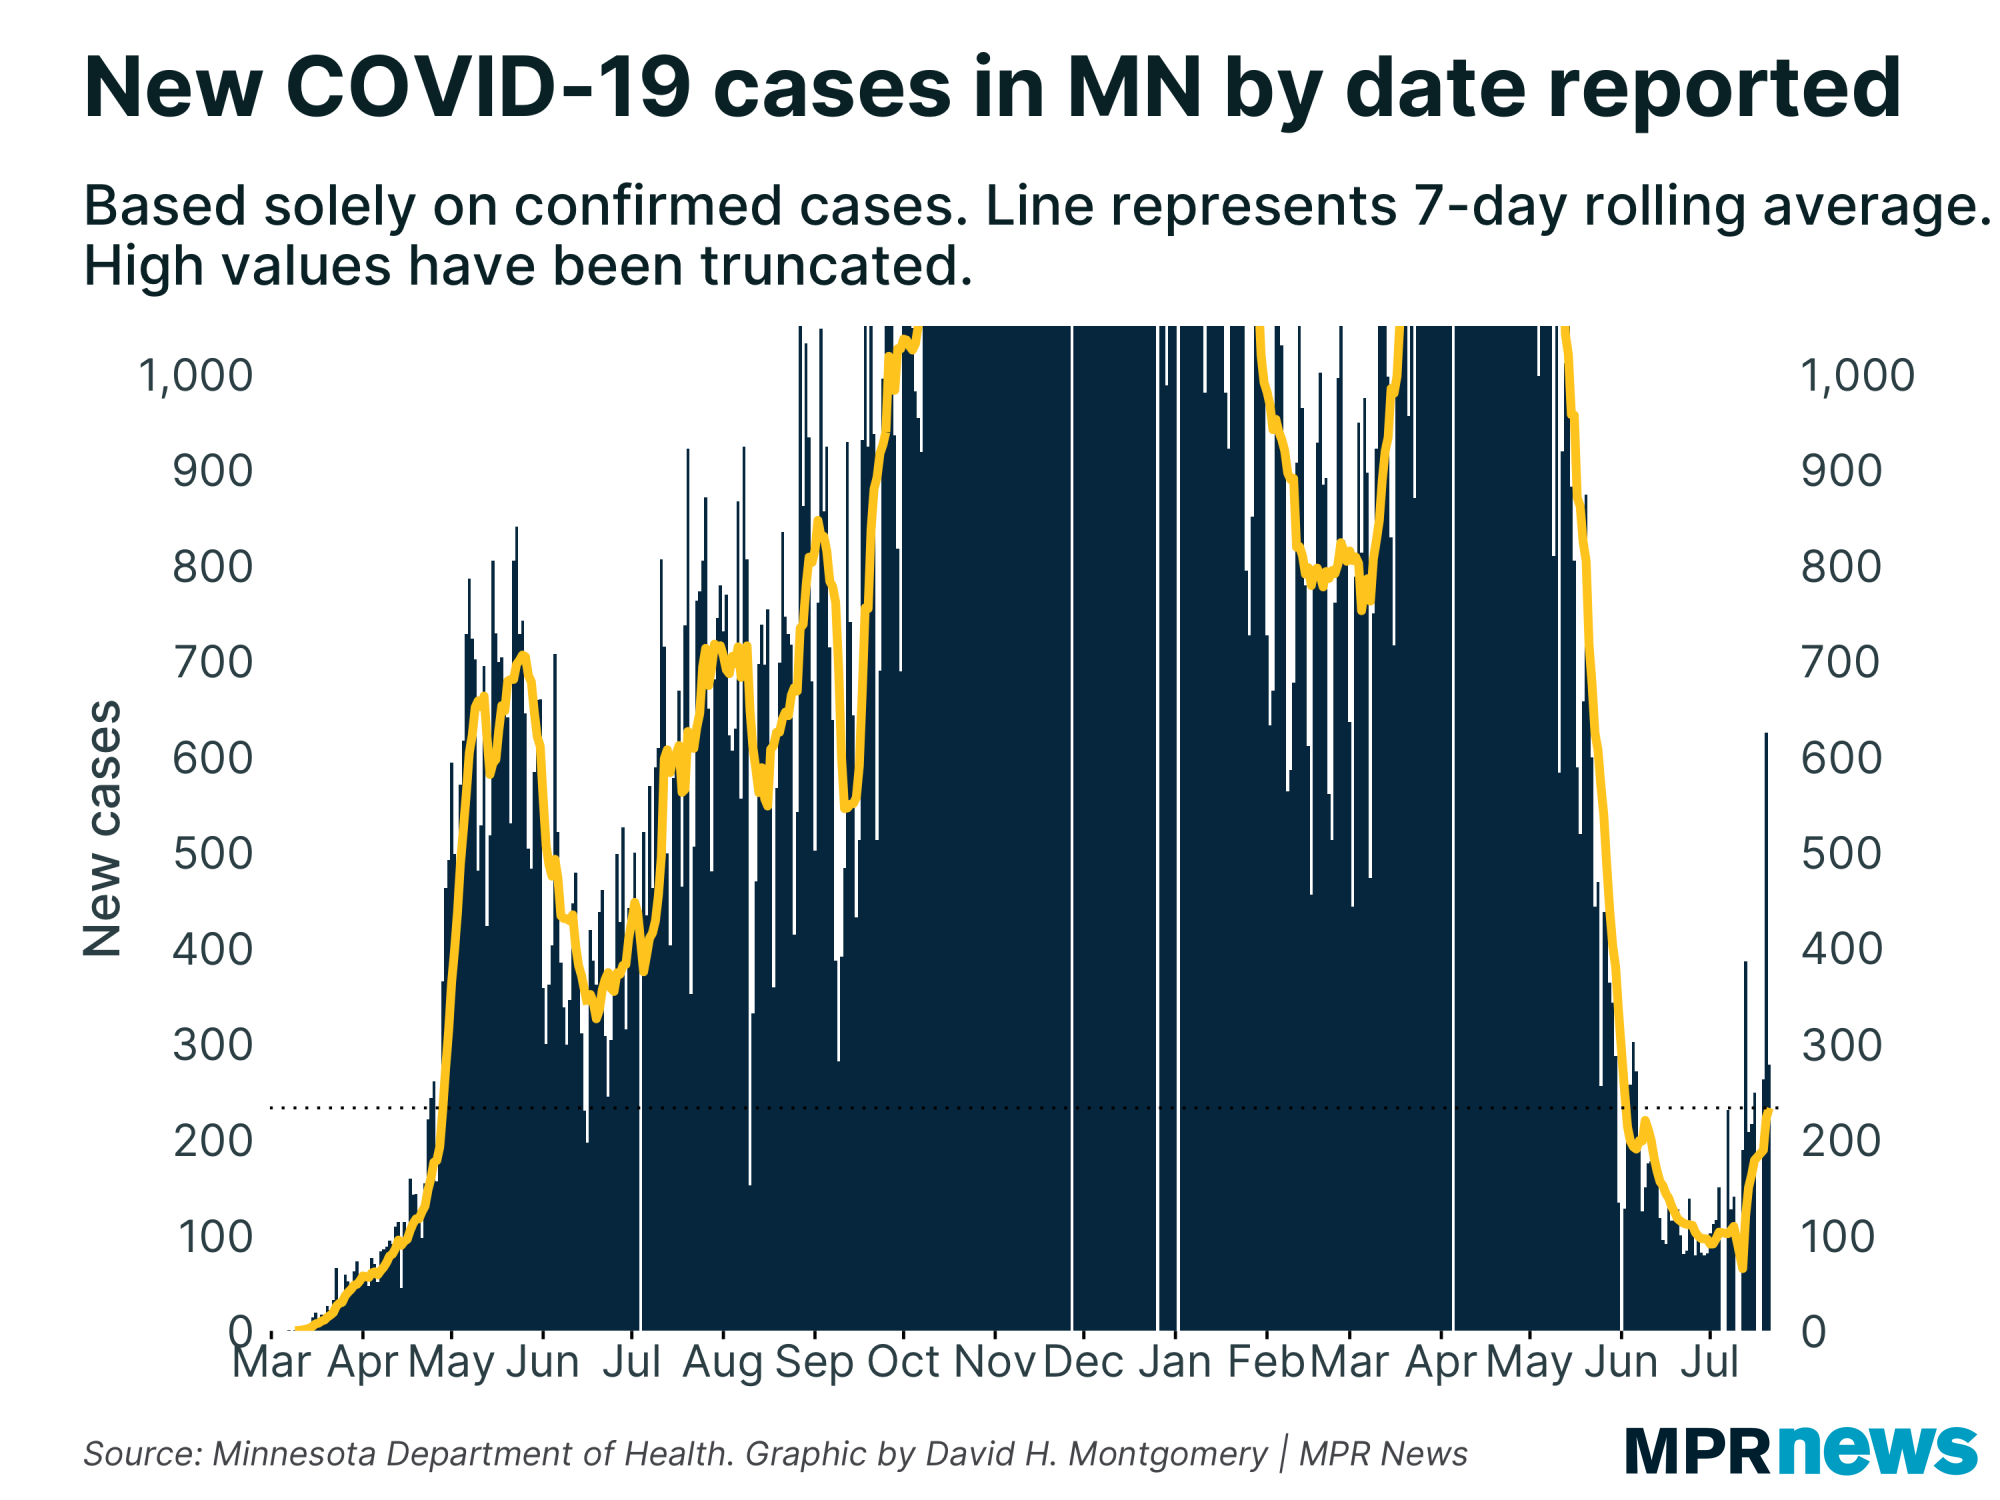
| First, a basic look at where things stand with COVID-19 in Minnesota. Cases started rising in early July, and (with some weirdness from Minnesota's new sporadic reporting schedule) have been steadily rising for about three weeks now. | | |
|
|
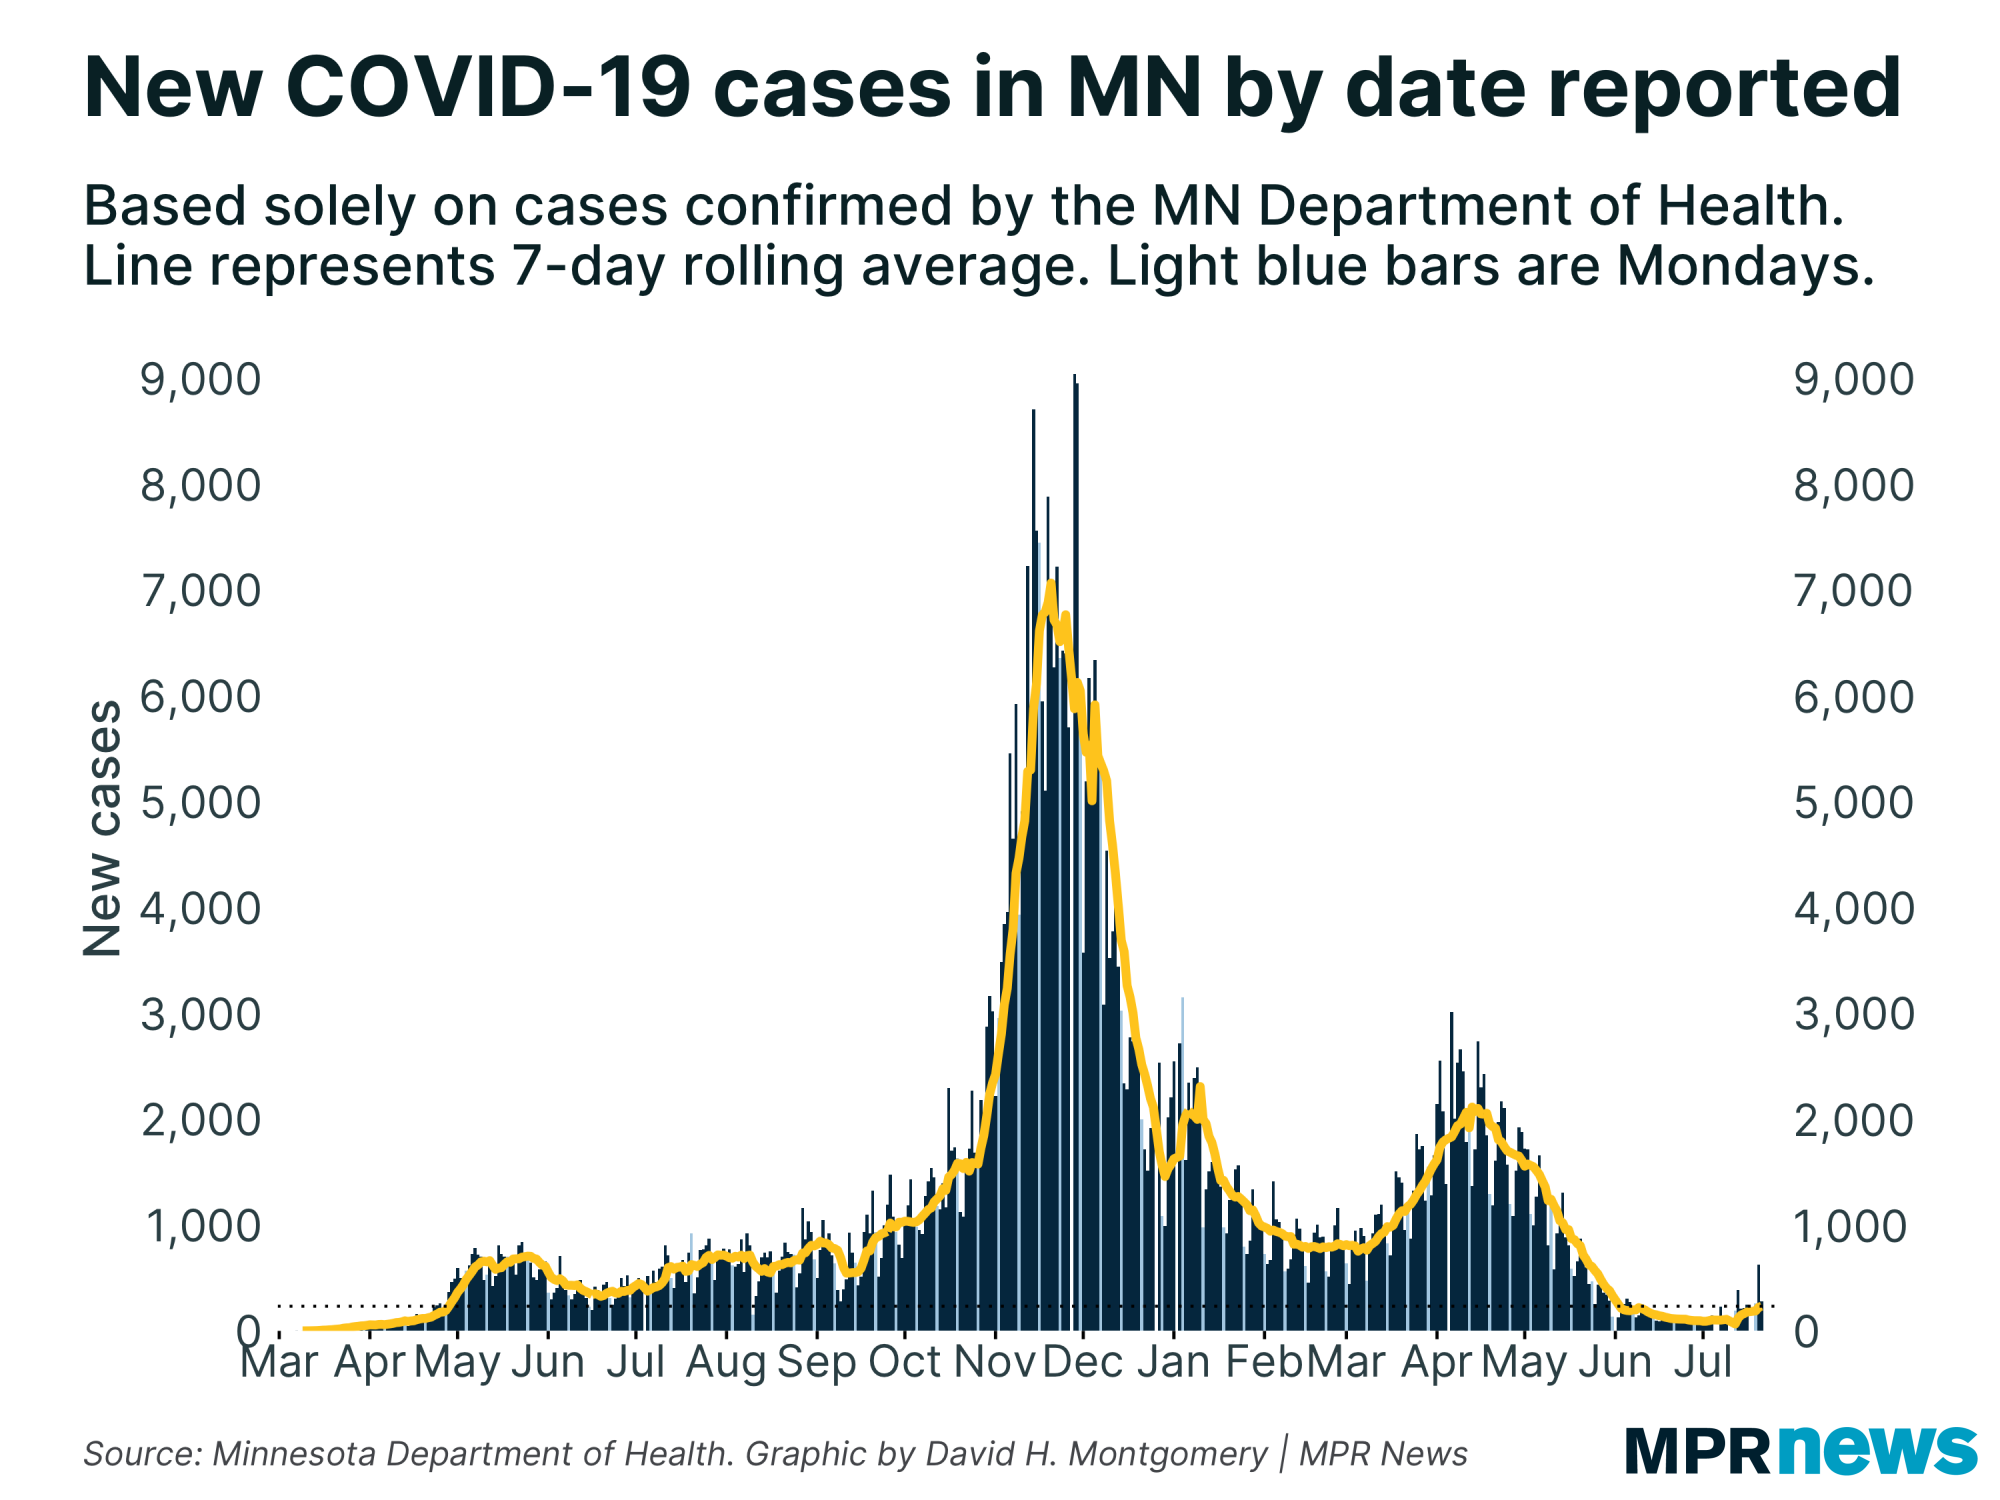
| Let's keep this in context, though. Here's that same graph without the scales truncated. | | |
|
|
Our increase here is real — and sustained. But it's also very small in magnitude.
That doesn't mean it can't become larger in magnitude in future weeks, of course. But it's important to put this in context — this wave started from the lowest case counts since the first wave and is so far rising at a more modest pace.
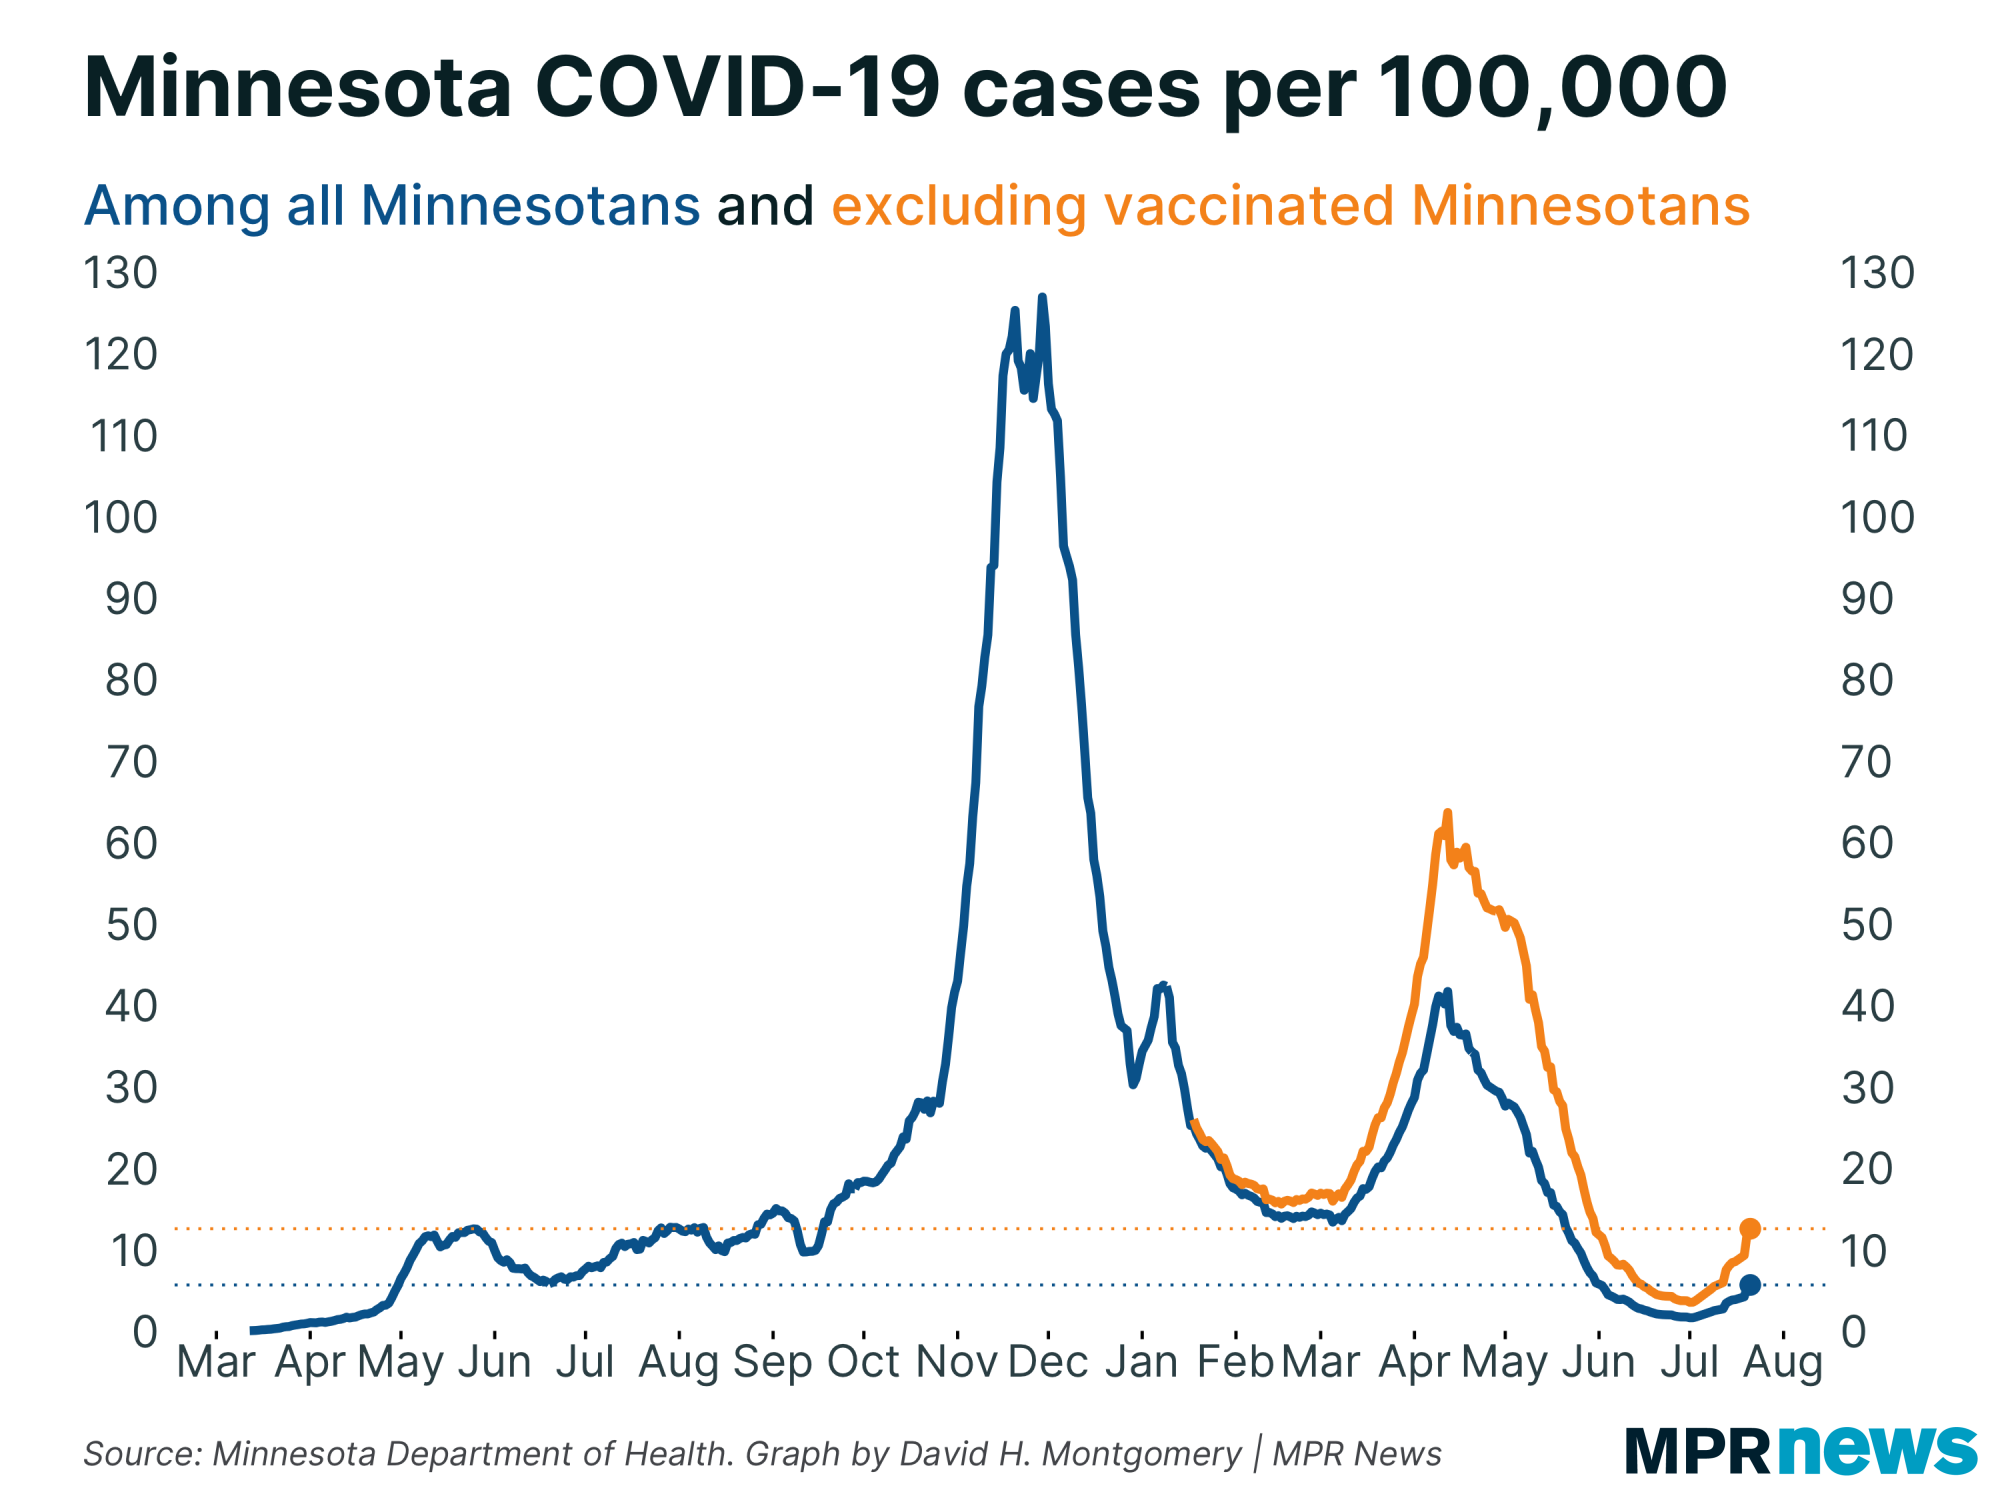
That said, we need to put this in the context mentioned above, that these infections are almost entirely occurring among the 40 percent or so of Minnesotans who aren't vaccinated. Here's what cases look like if you adjust for susceptible population size: |
| |
|
|
This highlights a few things. The spring 2021 wave was more serious to the non-vaccinated population than numbers at the time seemed. The current wave is also more serious than it might otherwise look — already over the 10 cases per 100,000 threshold — but even among this smaller unvaccinated population isn't on the scale of past waves yet.
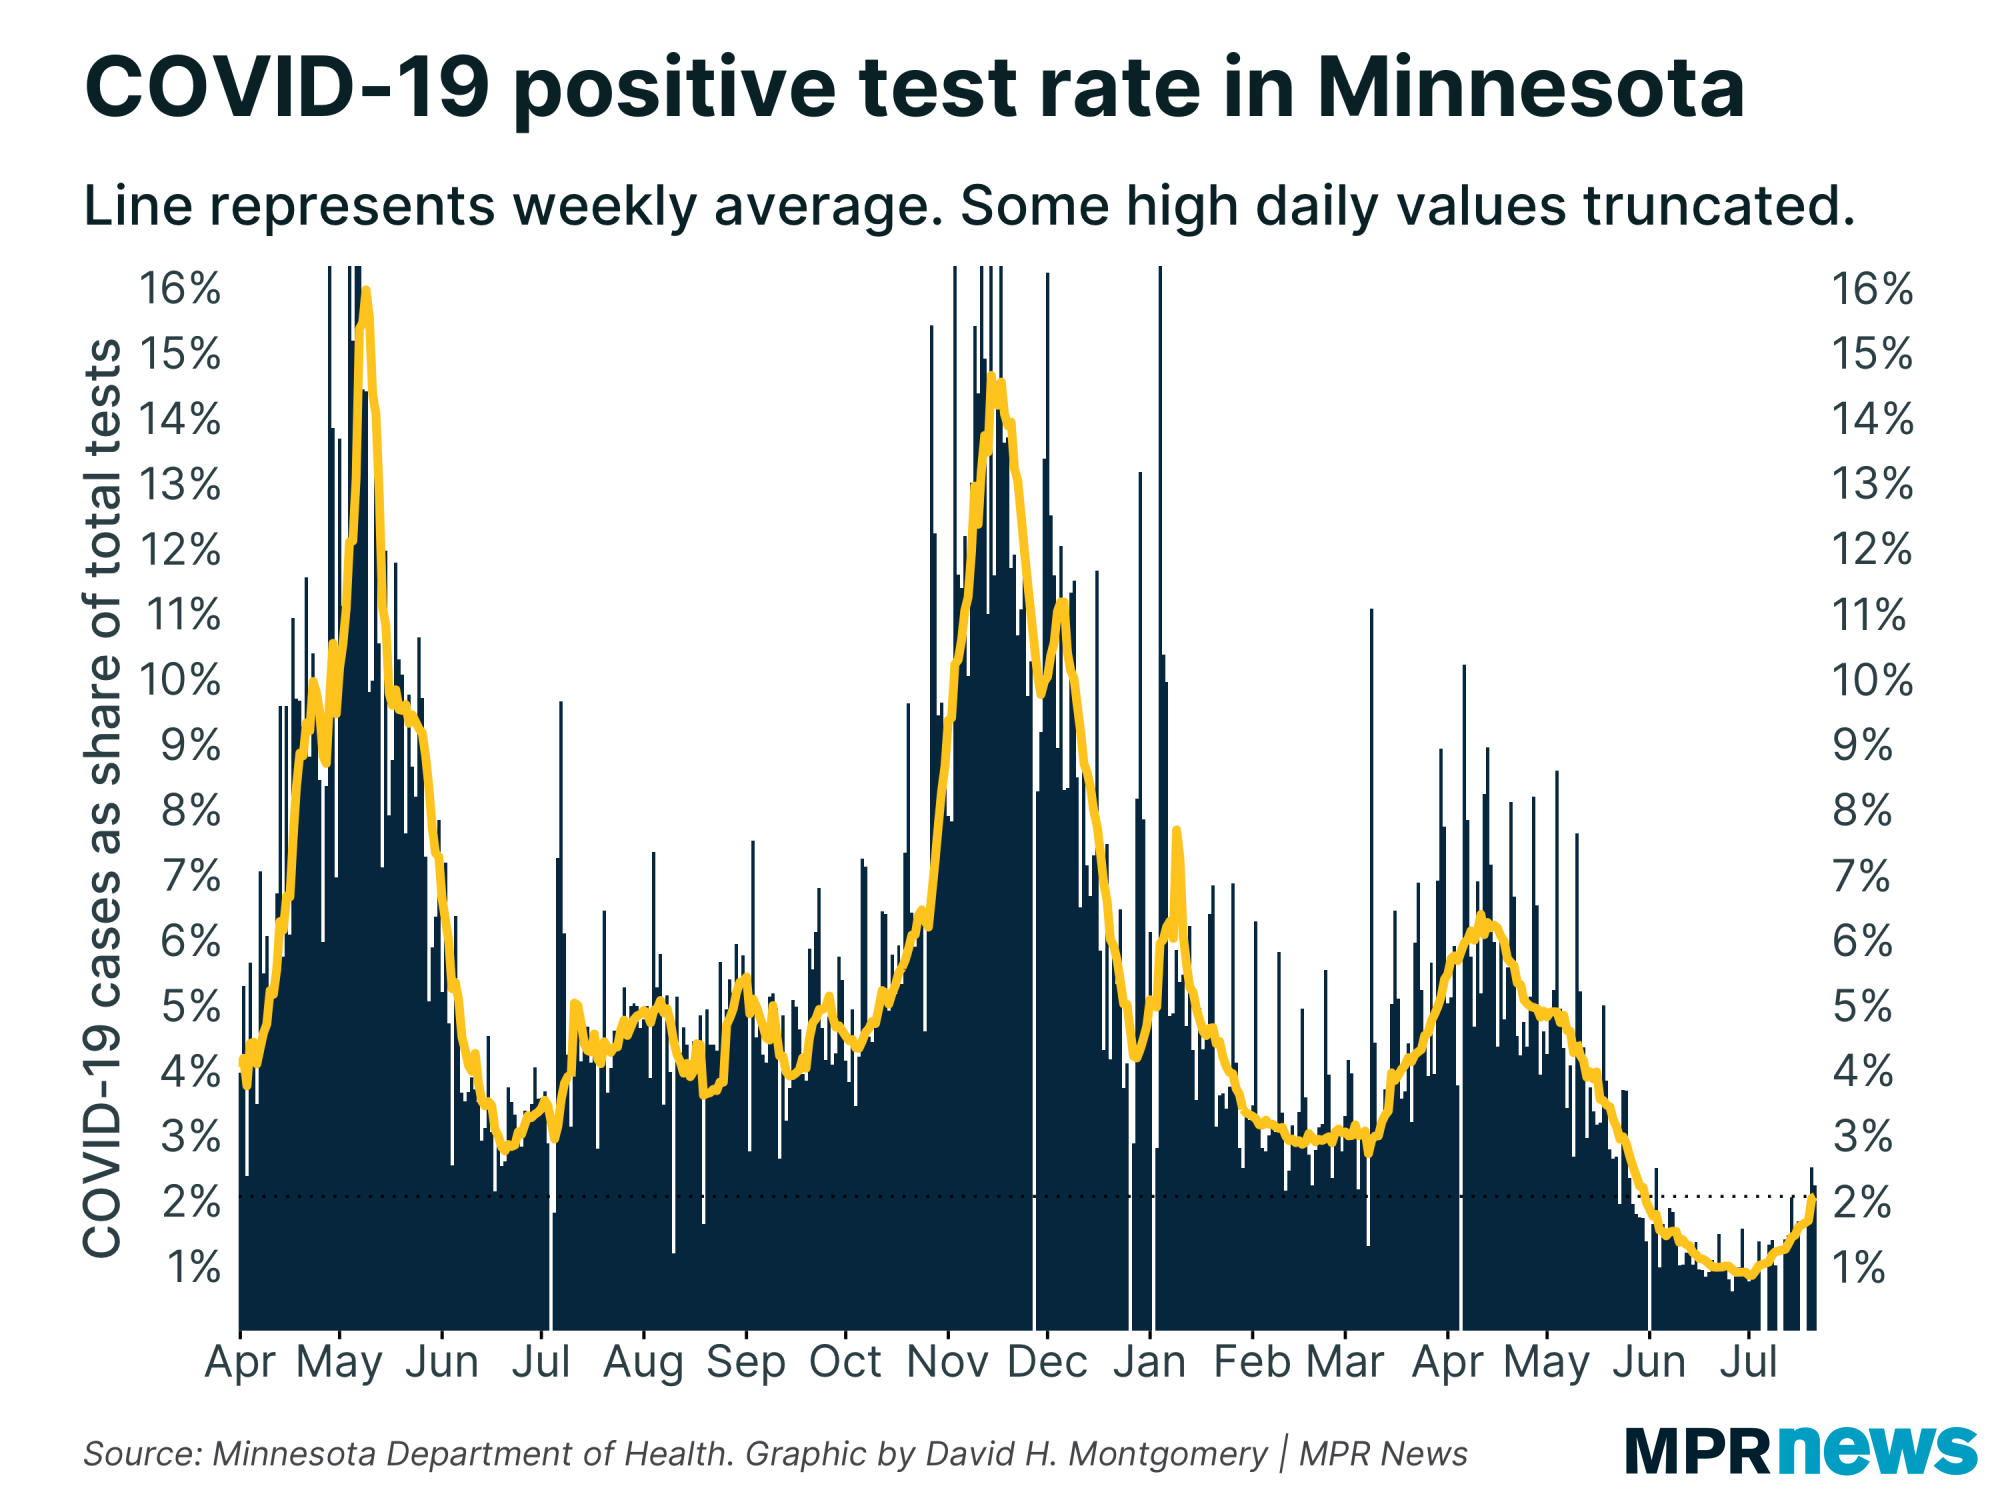
Remember, of course, that the spring 2020 wave took place amid sharply limited testing, so those early case counts are drastic underestimates. Positivity rate controls for that and helps put that first wave into context. |
| |
|
|
Here again, we can see a few things. This current rise in cases is not an artifact of testing volume; positivity rate has doubled in recent weeks. But it's doubled from 1 percent to 2 percent, and 2 percent is still lower than anything we've seen in Minnesota until two months ago.
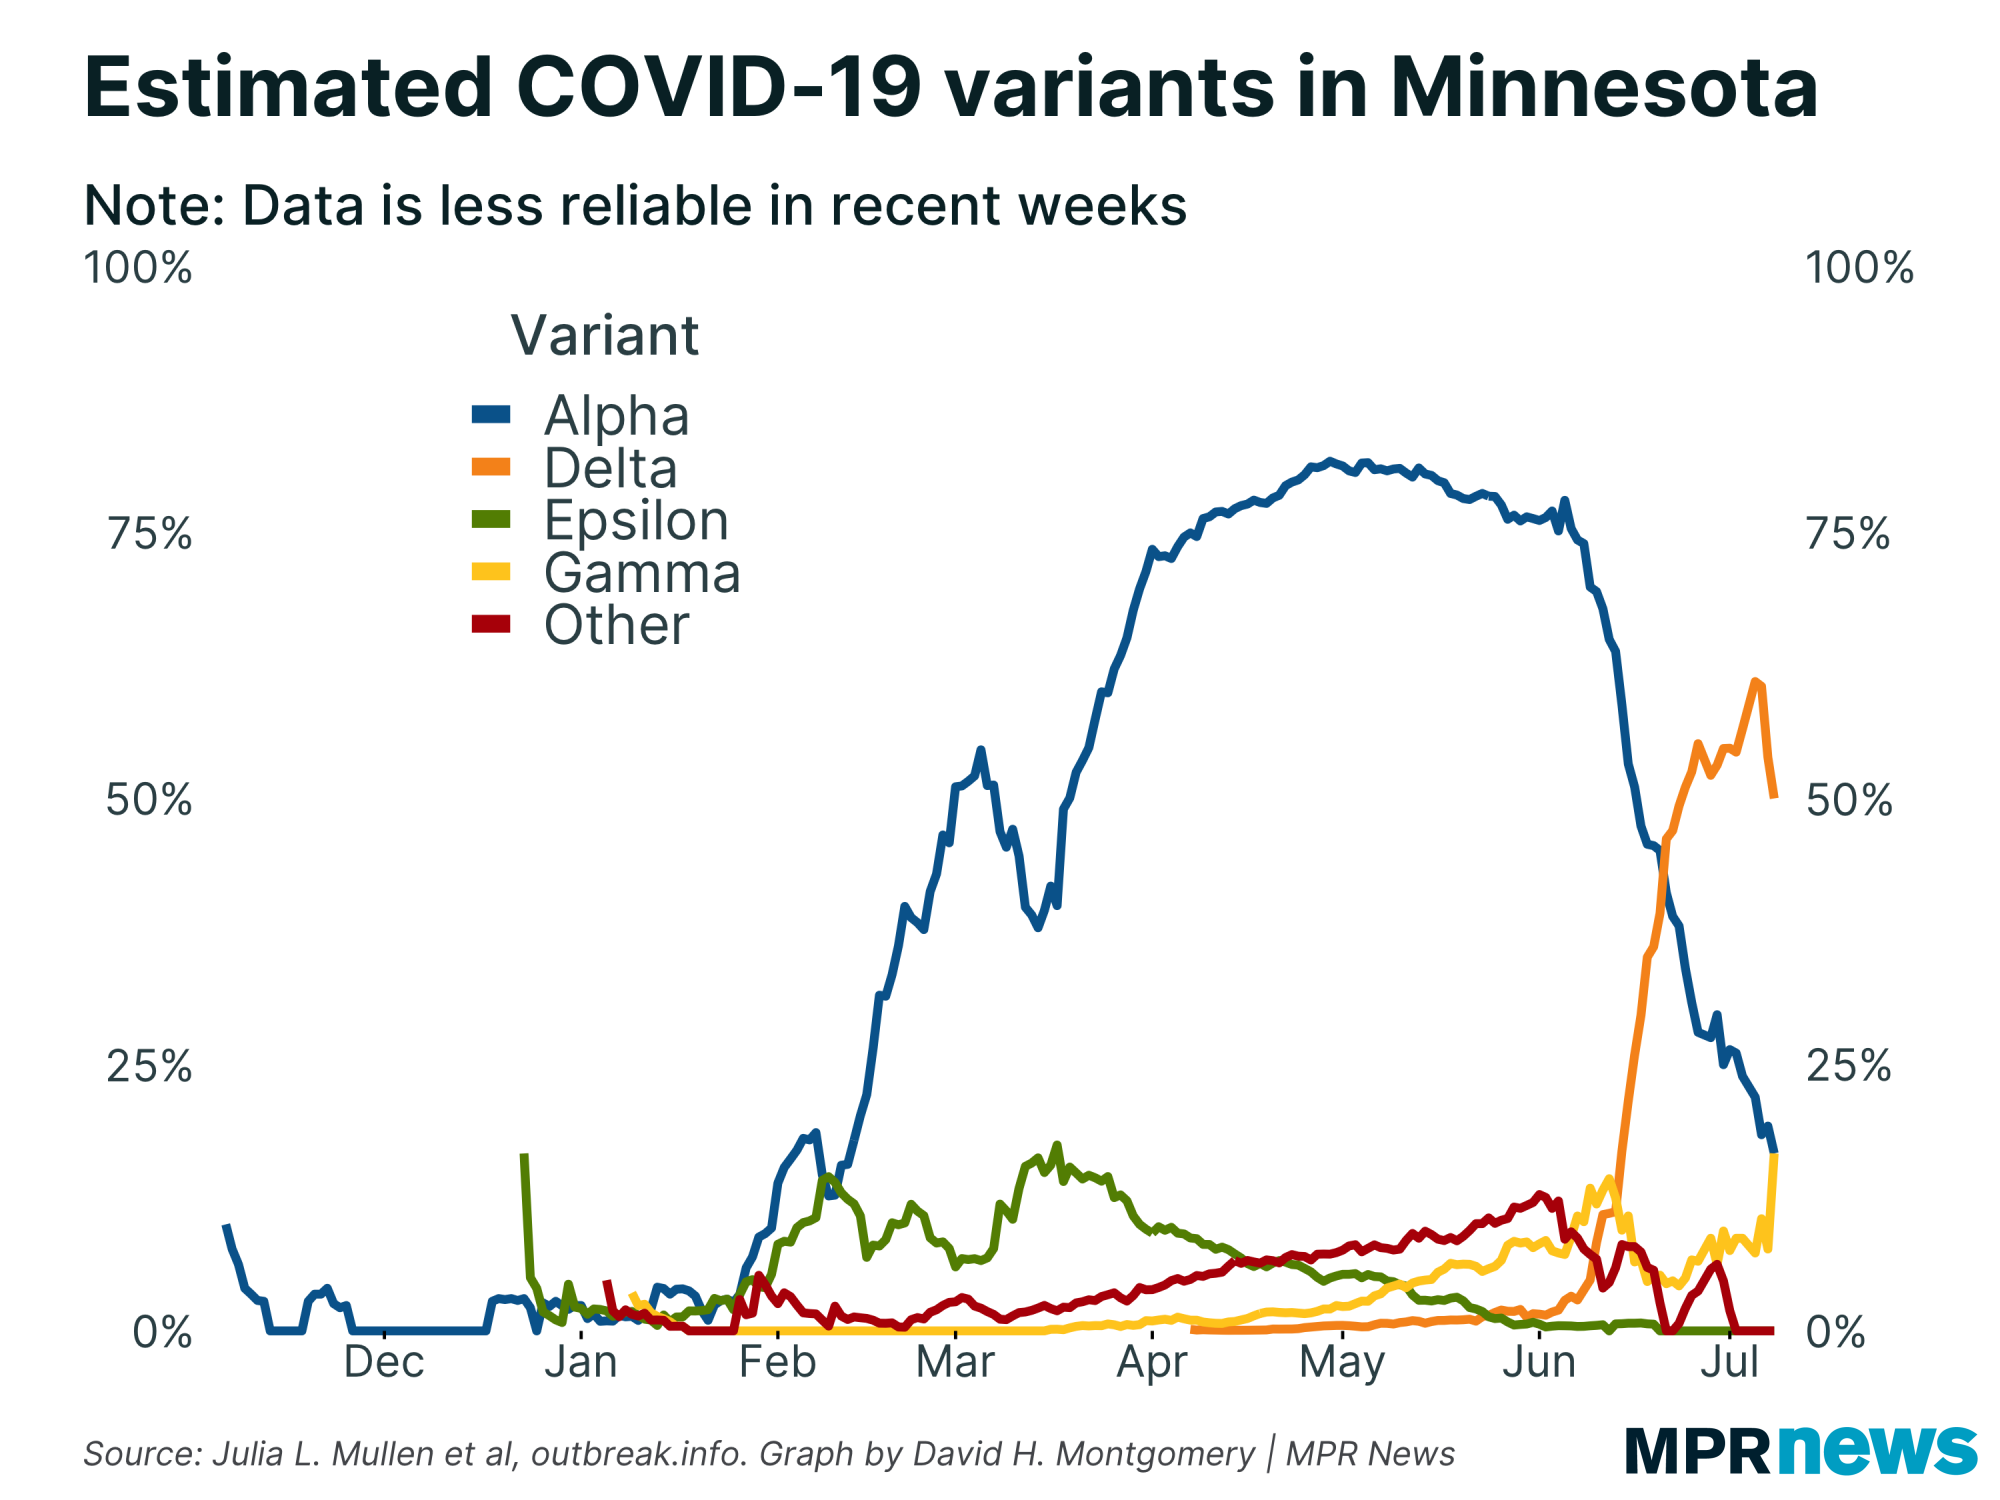
I'd be remiss if I didn't note that this wave is being driven primarily by the highly transmissible delta variant of COVID-19. Unfortunately my best data source is a week out of date here. But delta has probably been the dominant strain in Minnesota since at least mid-June. |
| |
|
|
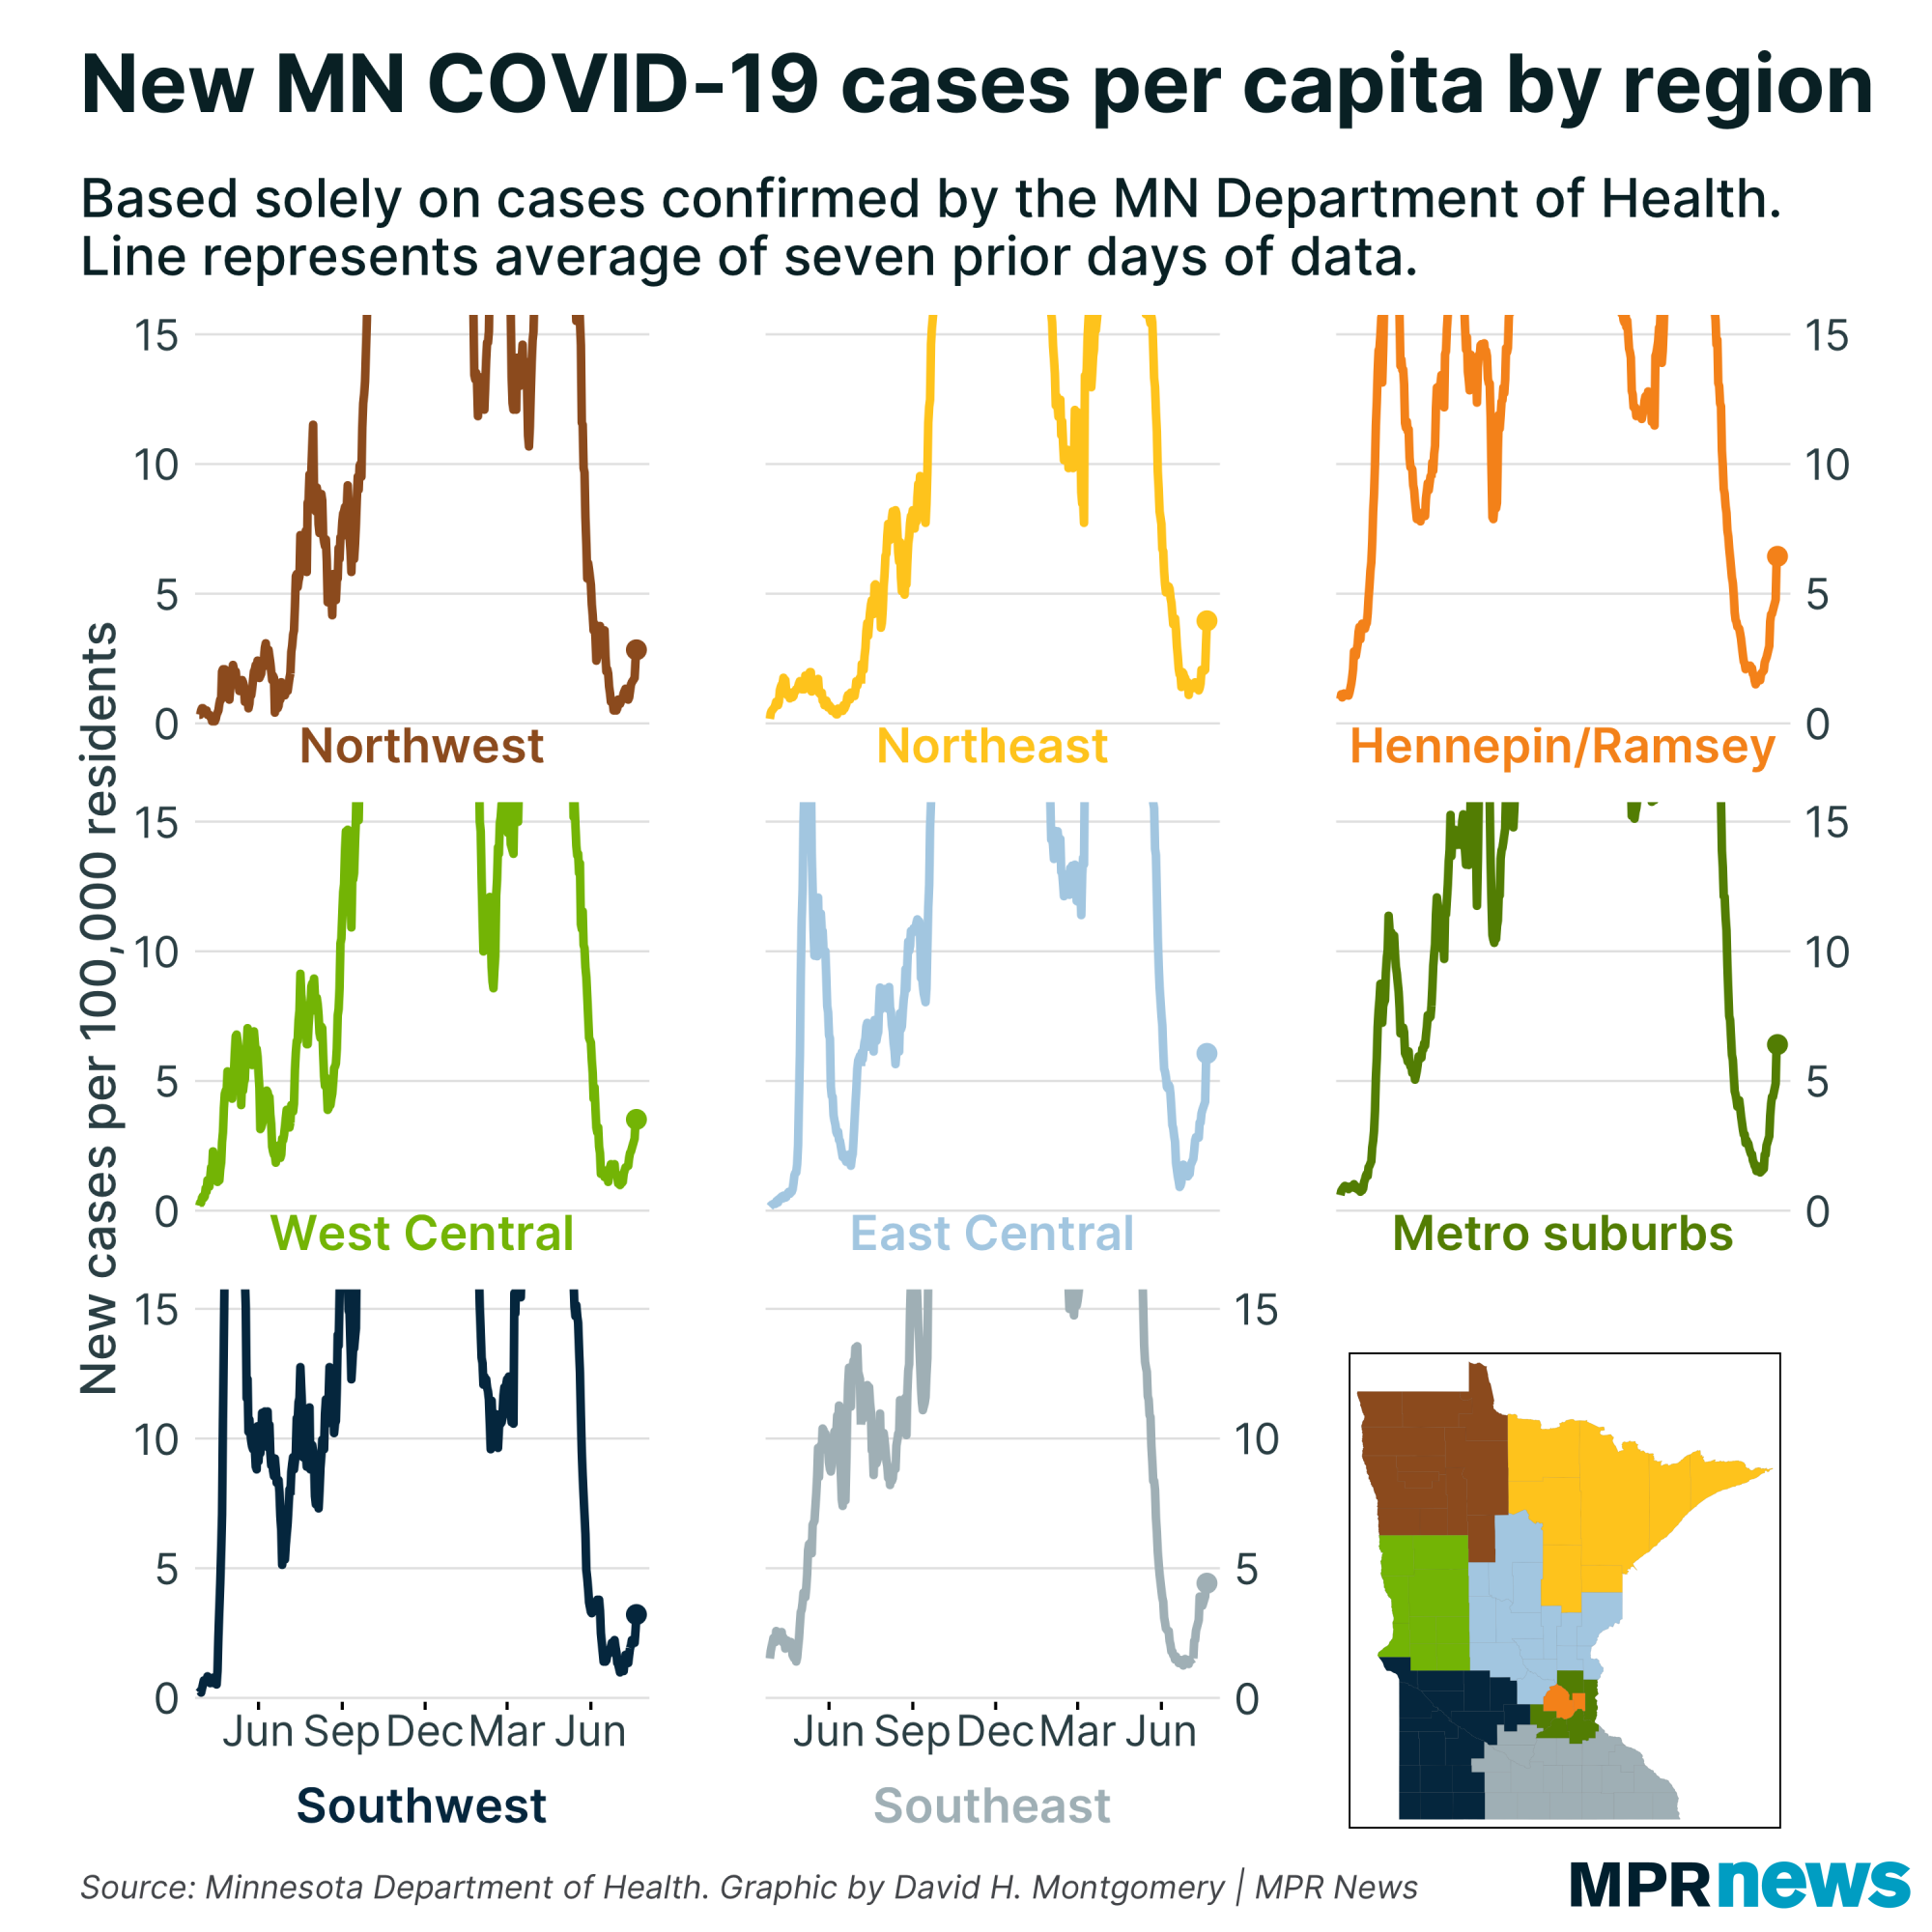
| This delta-fueled wave of cases isn't just localized to particular areas of the state, either. Early on cases were only rising in eastern Minnesota, but now they're going up everywhere. | | |
|
|
The Twin Cities metro and east-central Minnesota are seeing the highest rates of new cases so far. East-central Minnesota has the lowest vaccination rate in the state, but the metro has the highest. So what's going on there?
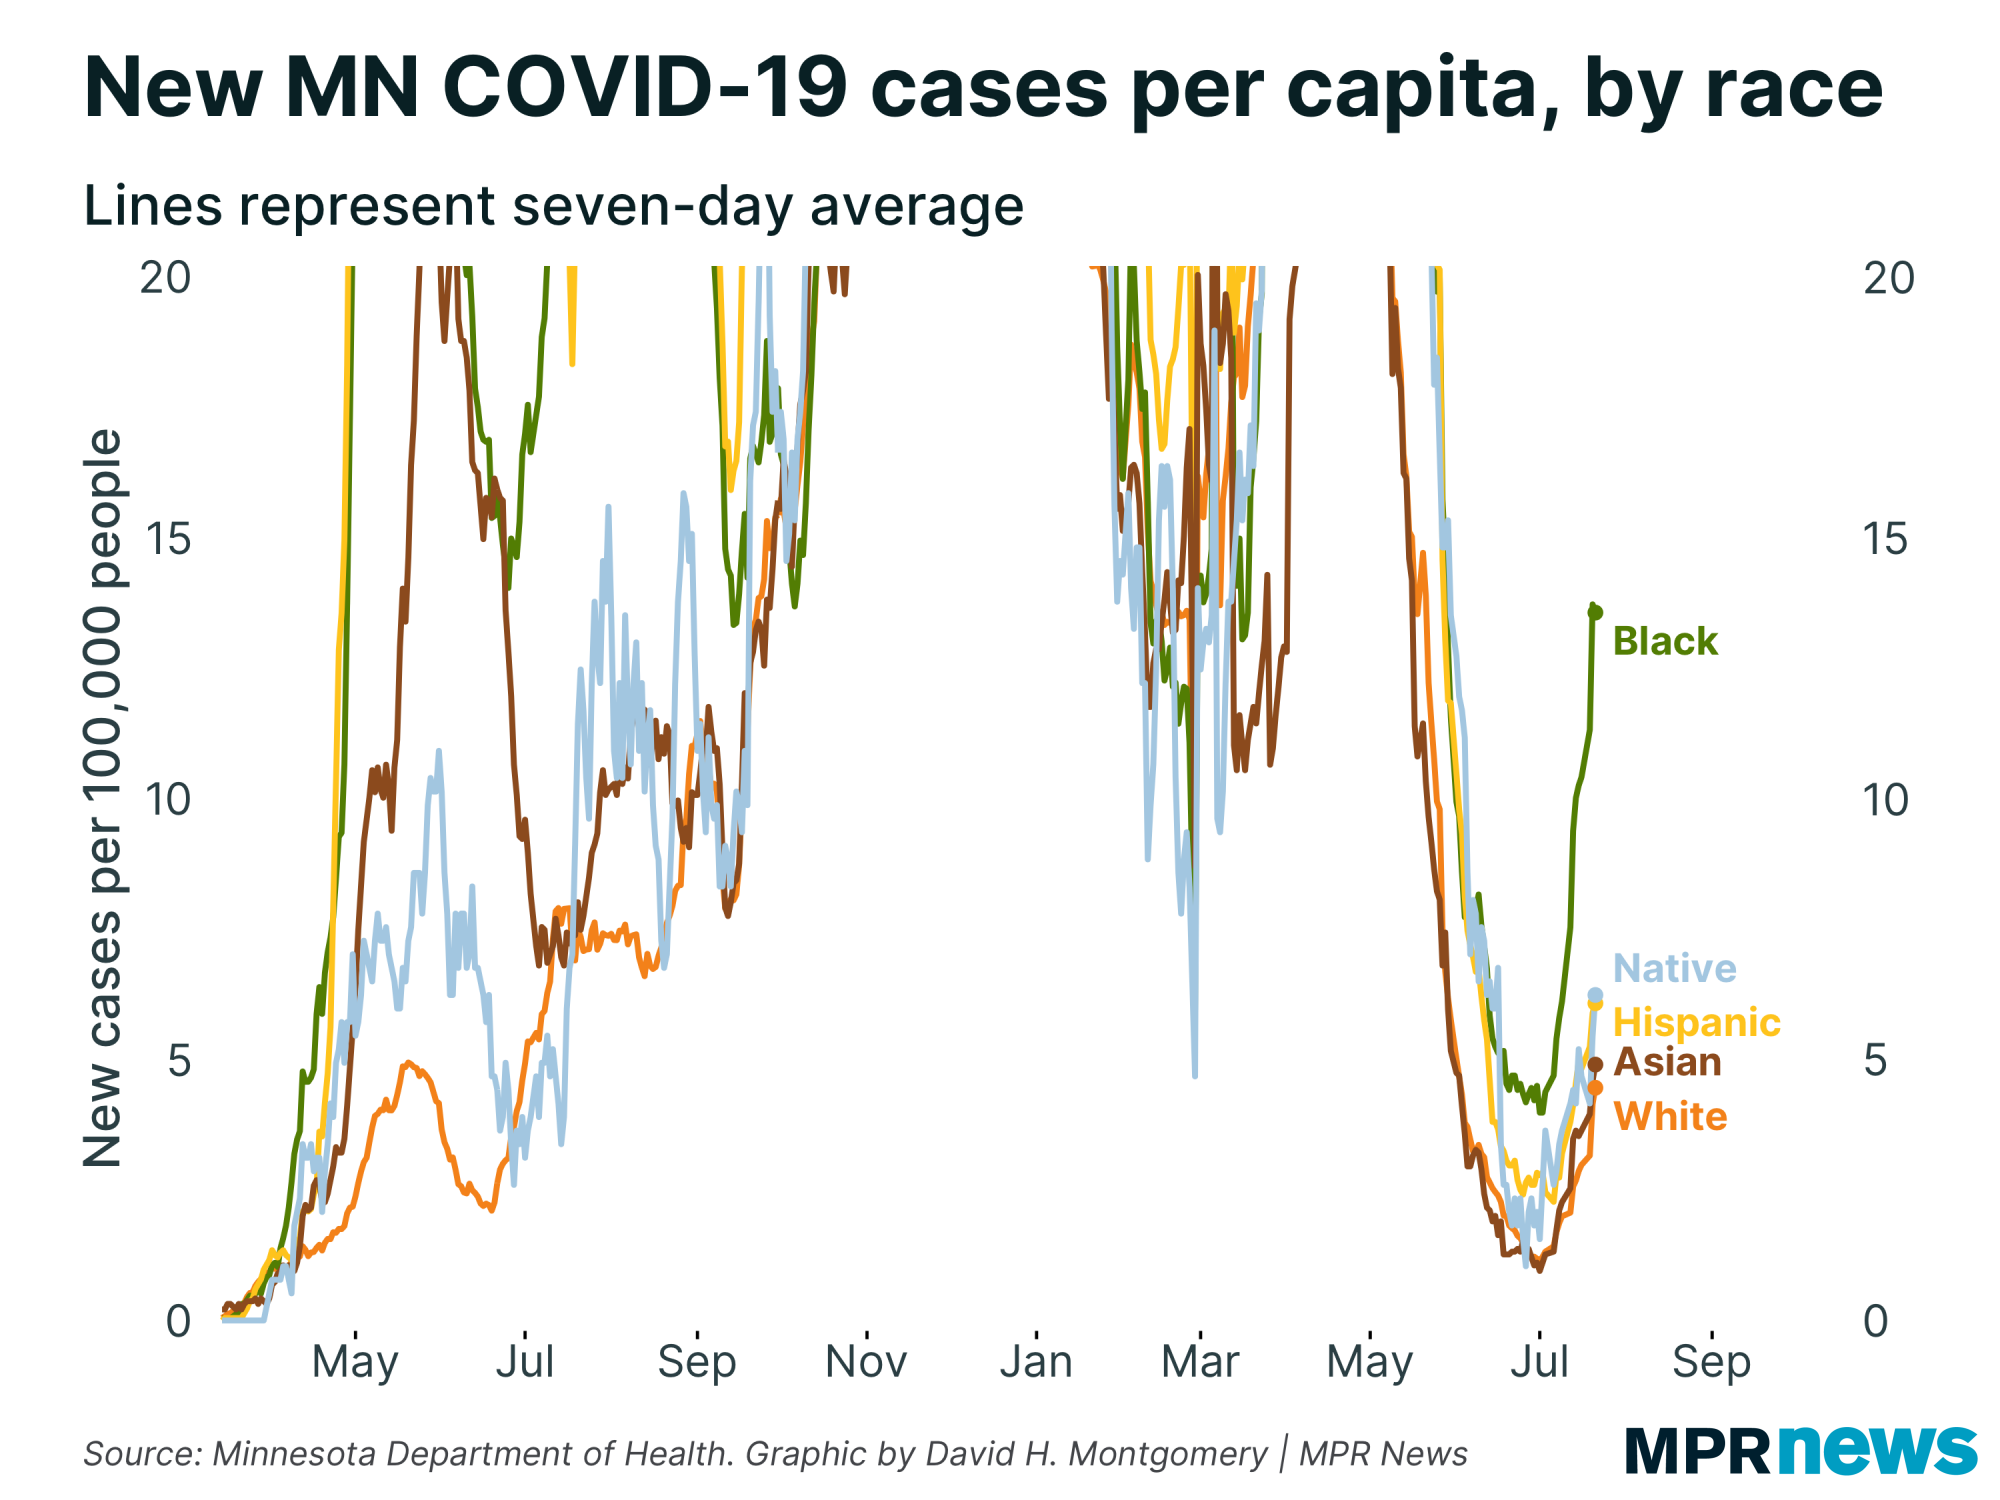
As I noted last time, one answer here may be in the racial dynamics. While the Twin Cities area overall has high vaccination rates, Minnesota's Black population (80 percent of whom live in the metro) has a low vaccination rate, just 47 percent of those 15 or older fully vaccinated, against 61 percent of whites. And Black Minnesotans have by far the highest confirmed case rate of any racial or ethnic group right now. |
| |
|
|
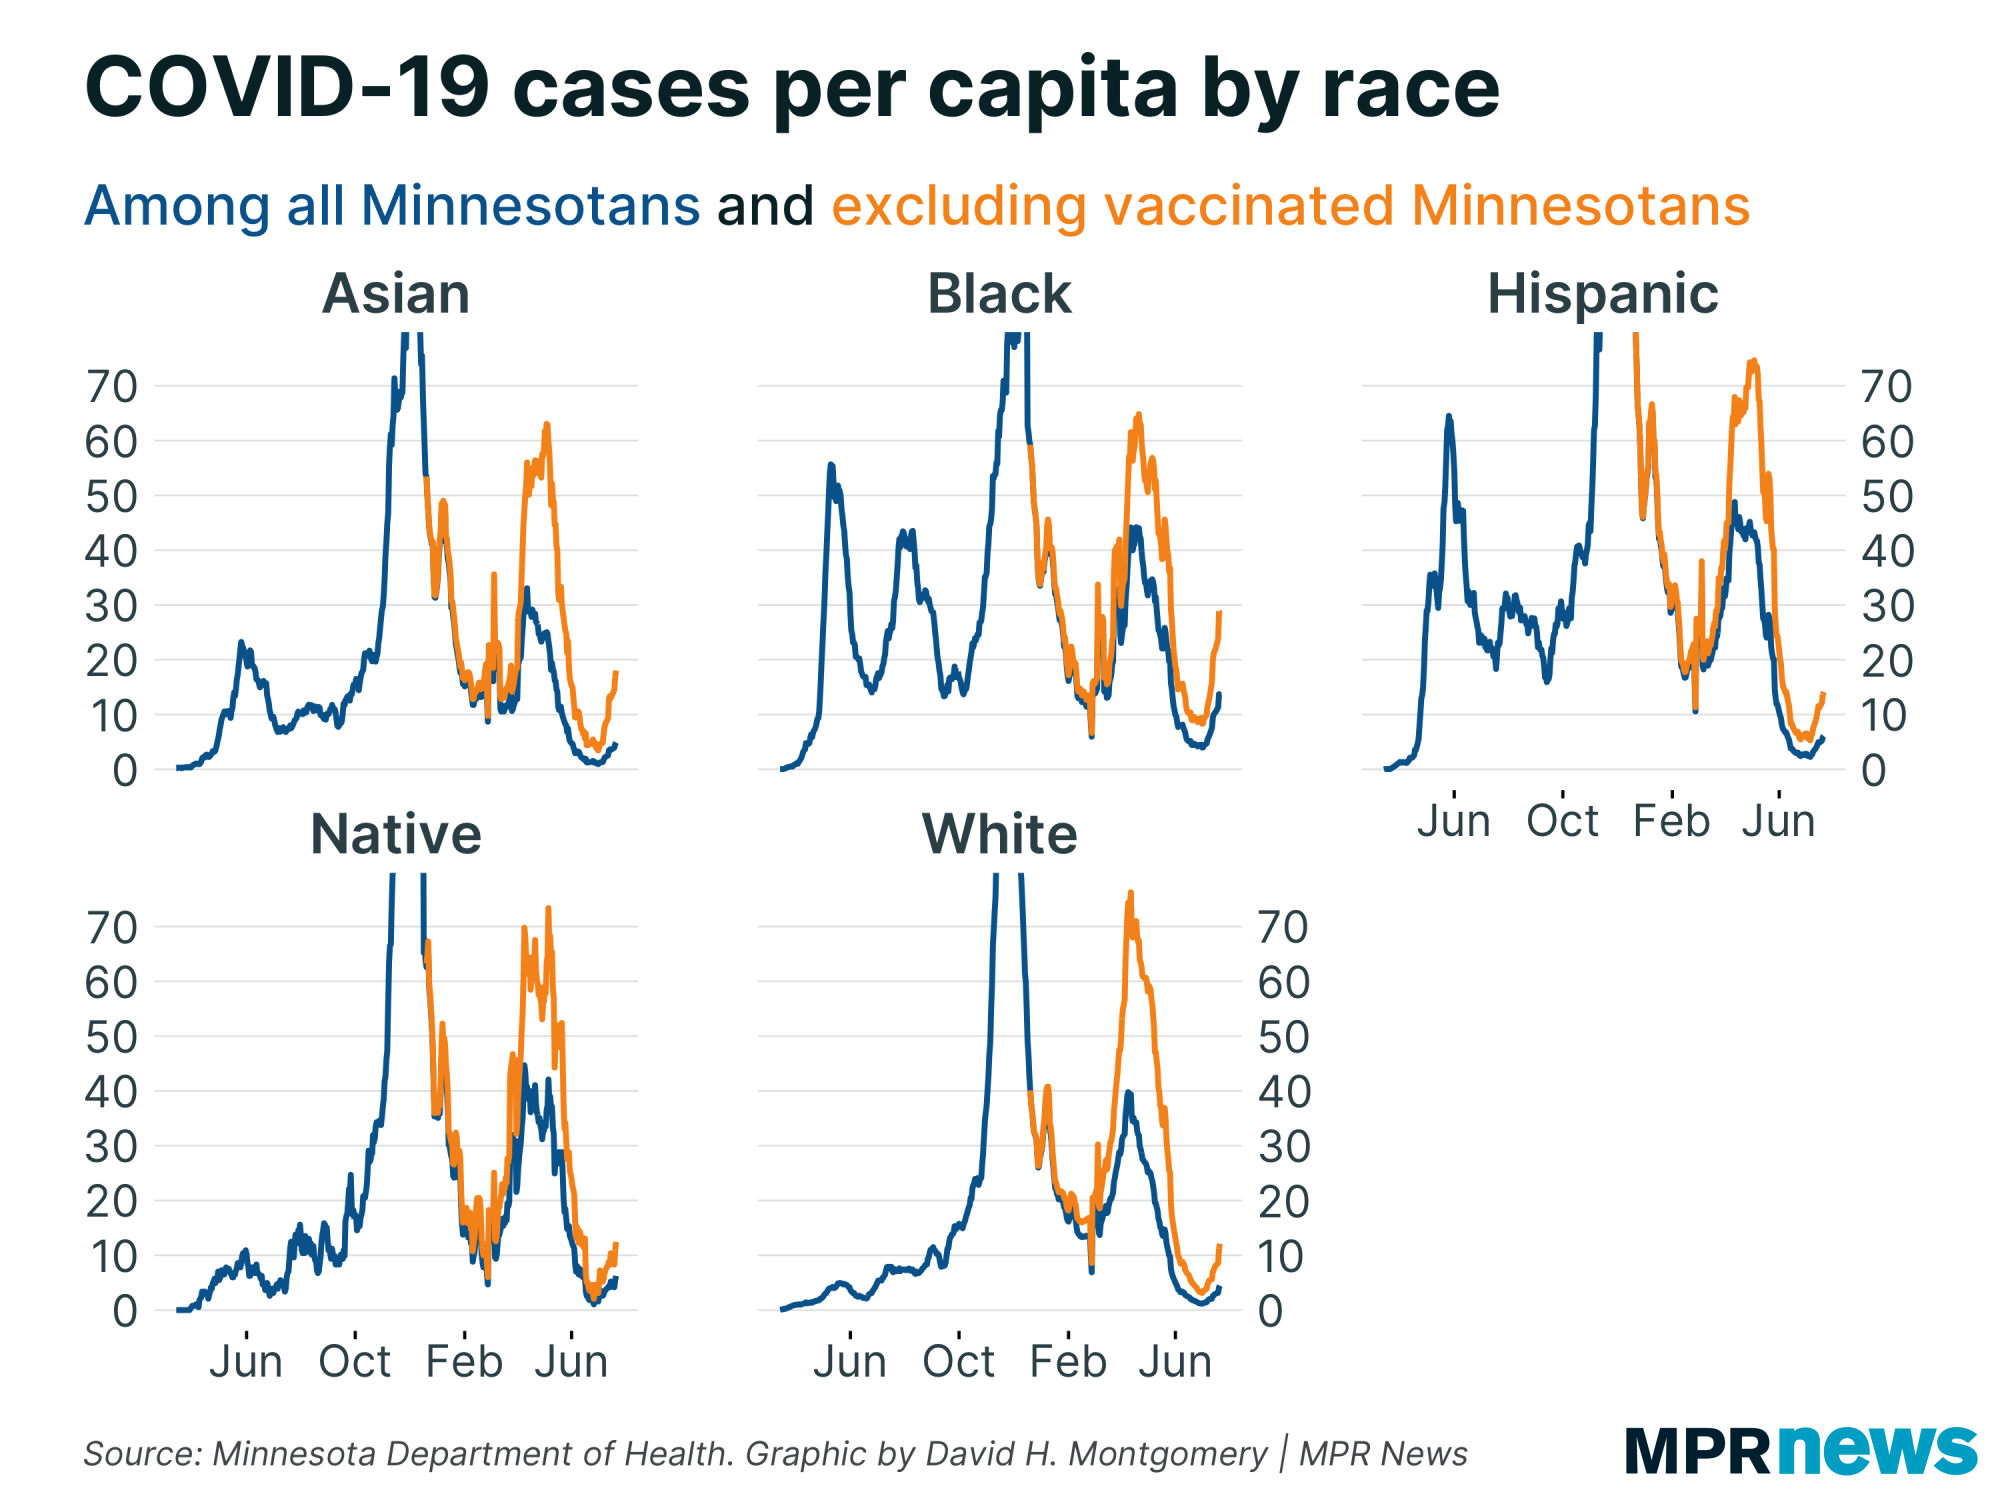
| If you adjust for vaccination rate, this is even more striking. We're seeing about 30 new cases per day per 100,000 unvaccinated Black Minnesotans, comparable on a statewide level to where we were in January or last October, and nearly three times the rate among unvaccinated white Minnesotans. | |
|
|
|
I'll hopefully have more detailed stats on this next week!
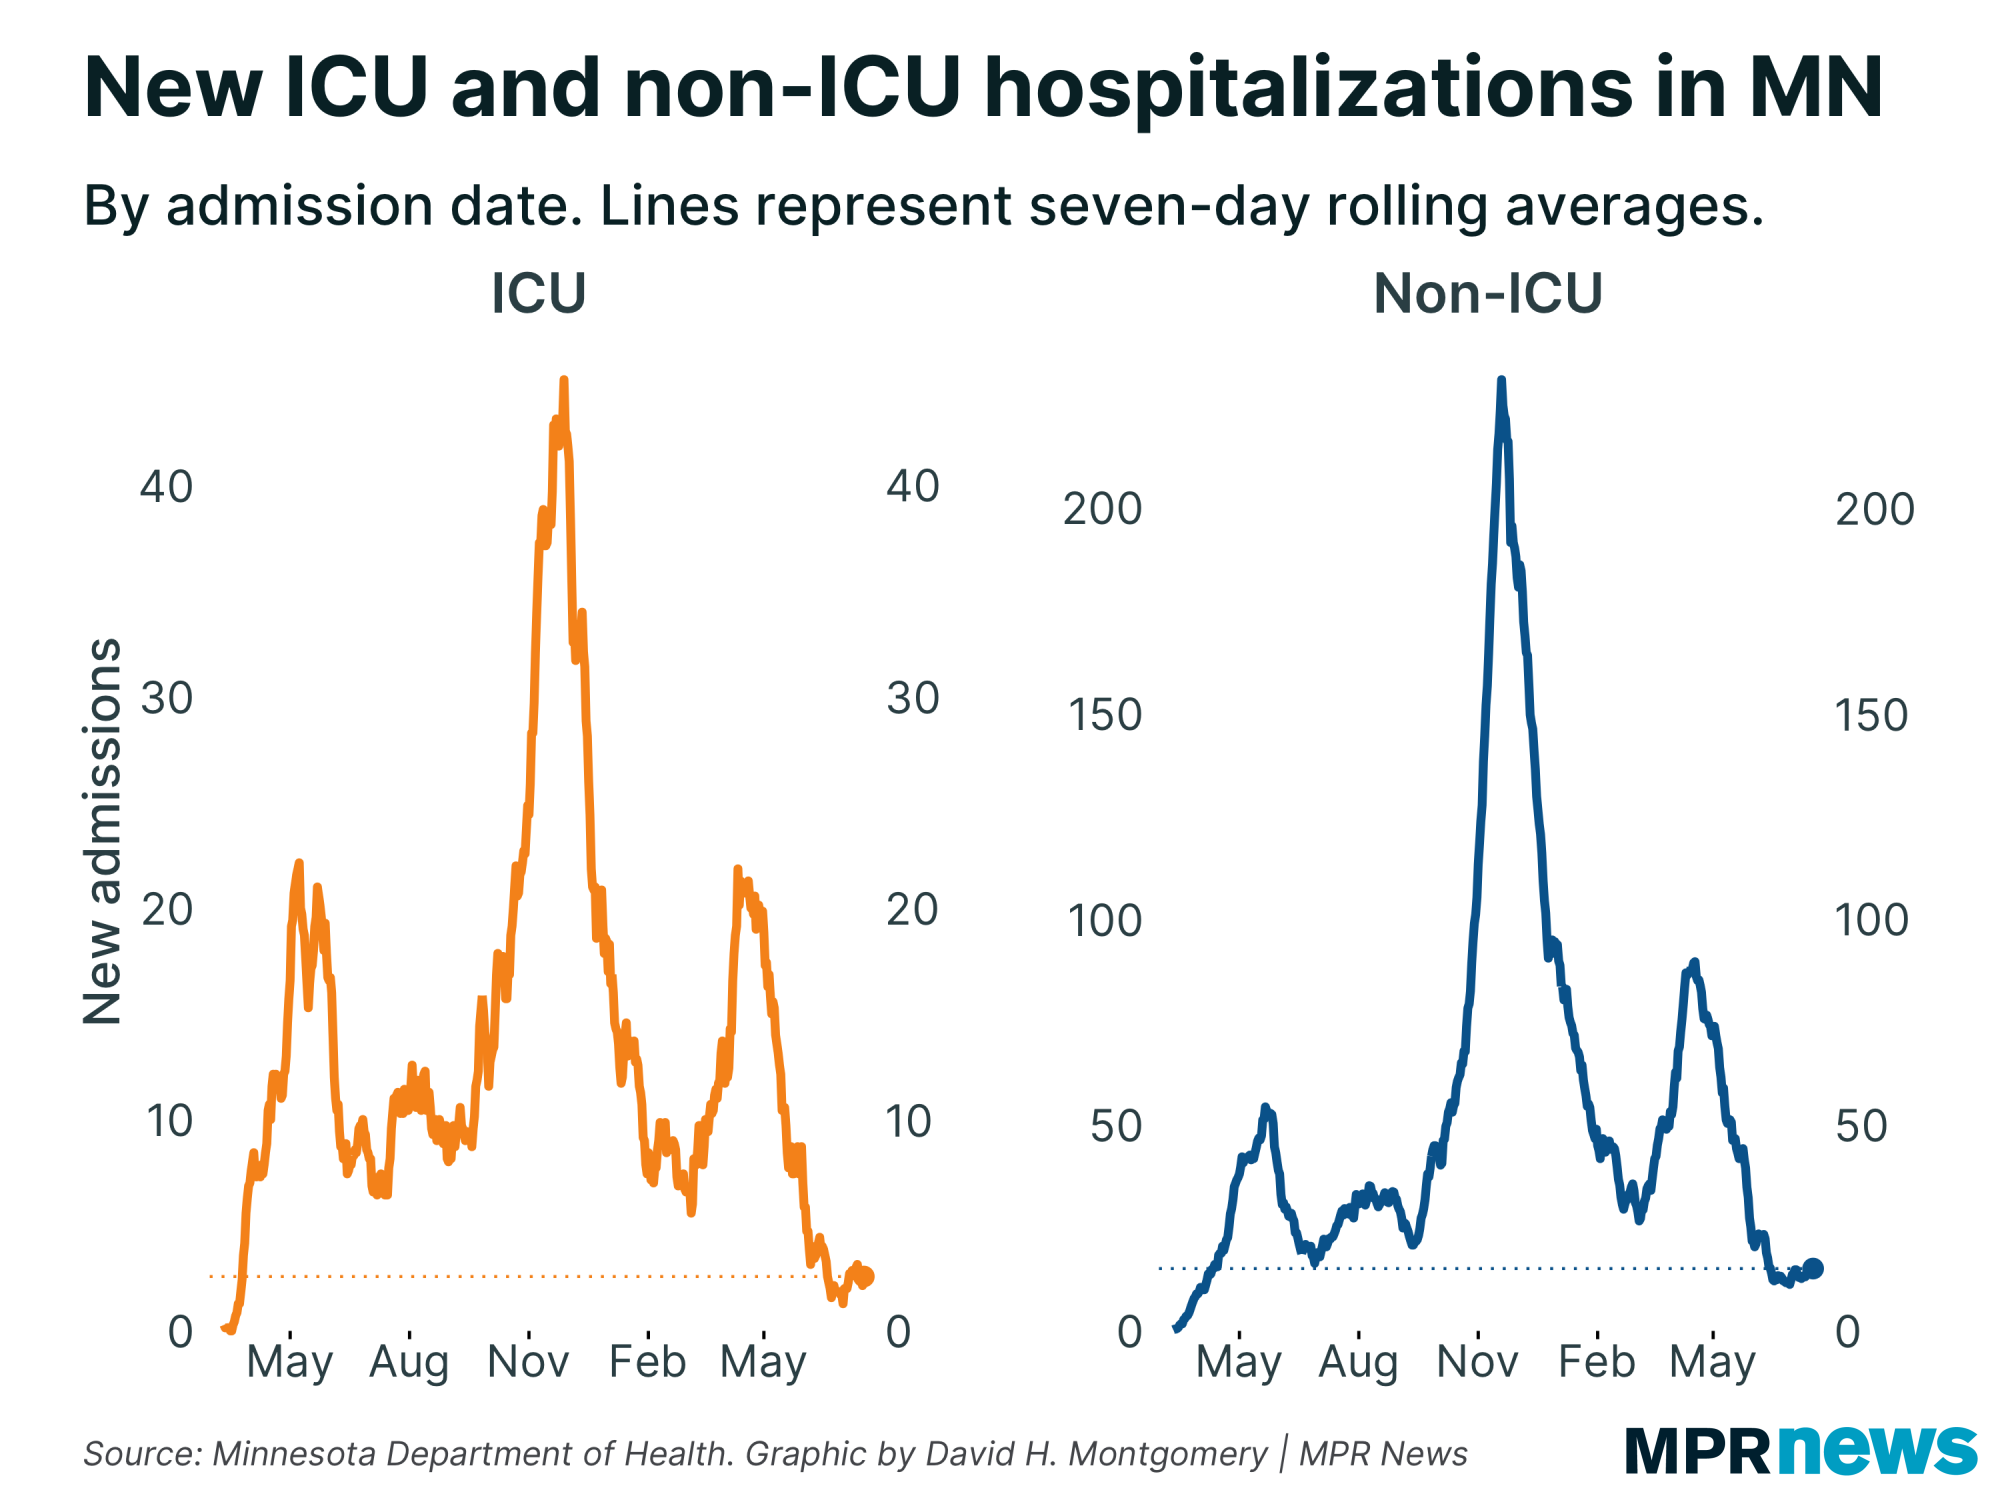
The final important stat to share right now is hospitalizations. That's arguably much more important right now than case counts, since so many of Minnesota's elderly or vulnerable residents are fully vaccinated now. If most of these people getting sick are young, healthy and recover quickly, that's a different picture from an outbreak where a significant share of victims get hospitalized.
So far, at least, hospitalizations aren't rising at the same velocity as cases. Hospitalization are up, but not by very much. |
| |
|
|
Now, hospitalizations are a lagging stat. It could be that a week from now this will look very different, as more of the newly infected get so sick they need hospital care. Or it could be that hospitalizations will only rise gradually since few of the people getting sick now are very vulnerable. (Or somewhere in between! It's also small consolation to people who do get hospitalized with COVID that their experience is rarer than it used to be.)
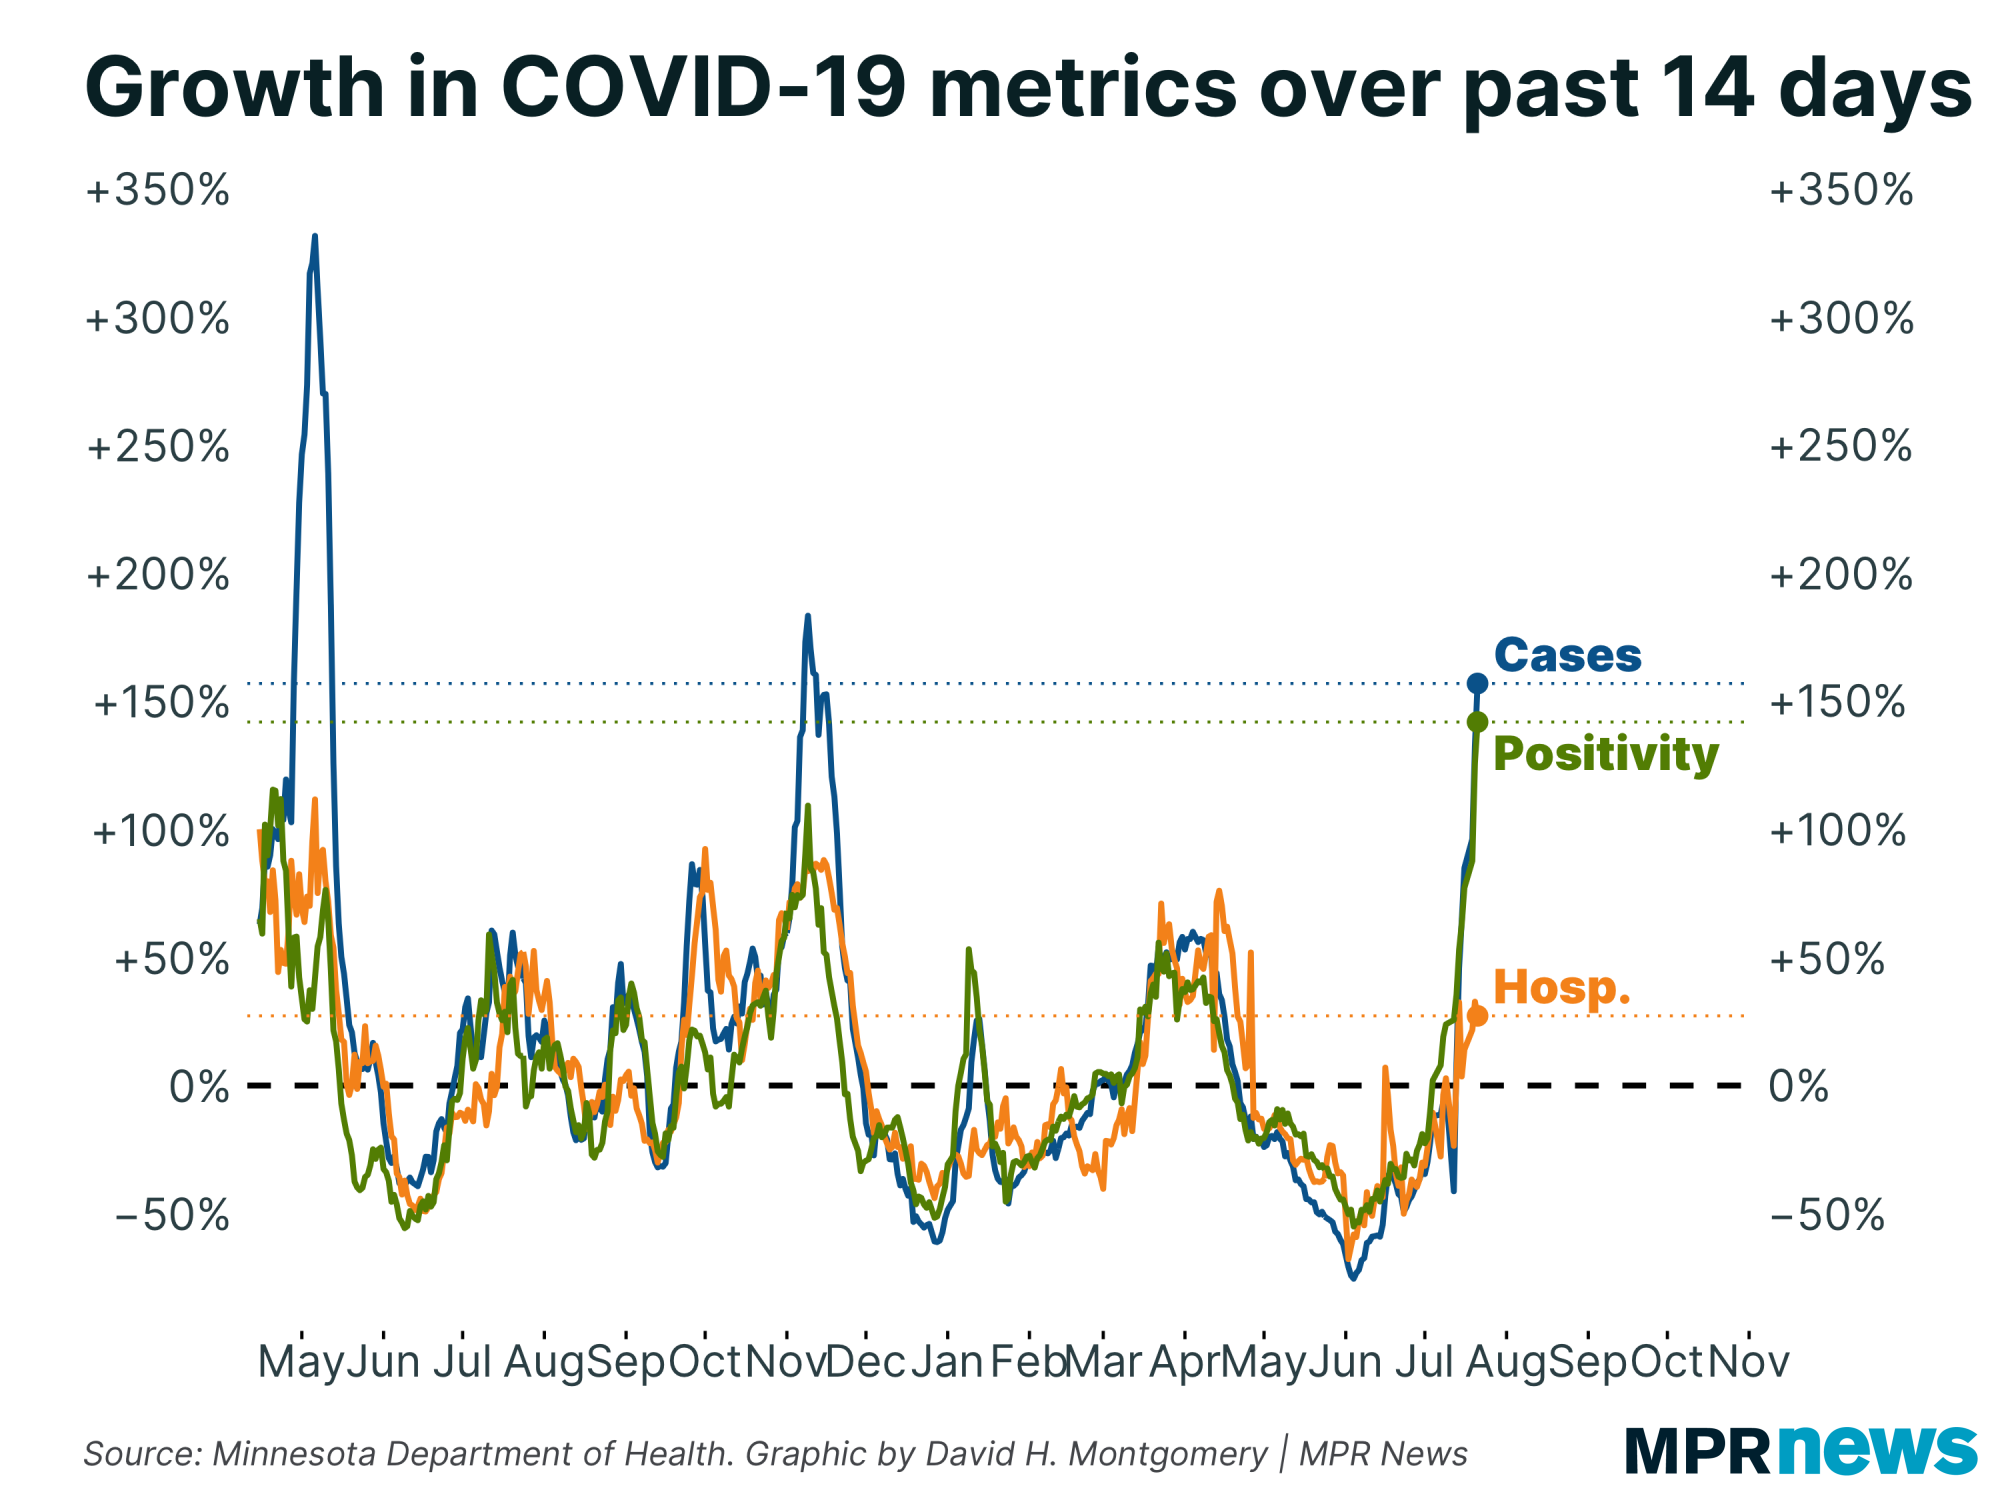
Here's cases, positivity rate and hospitalizations all next to each other. As you can see, the magnitude of the rise in hospitalizations is much smaller than the other two. (When comparing these metrics to past waves, remember that this current wave started from a much lower baseline. A 100 percent increase in cases from 100 cases per day takes you to 200 cases per day, +100. A 50 percent increase in cases from a 600 per day starting point takes you to 900, +300. You have to consider both relative and absolute magnitudes here.) |
| |
|
|
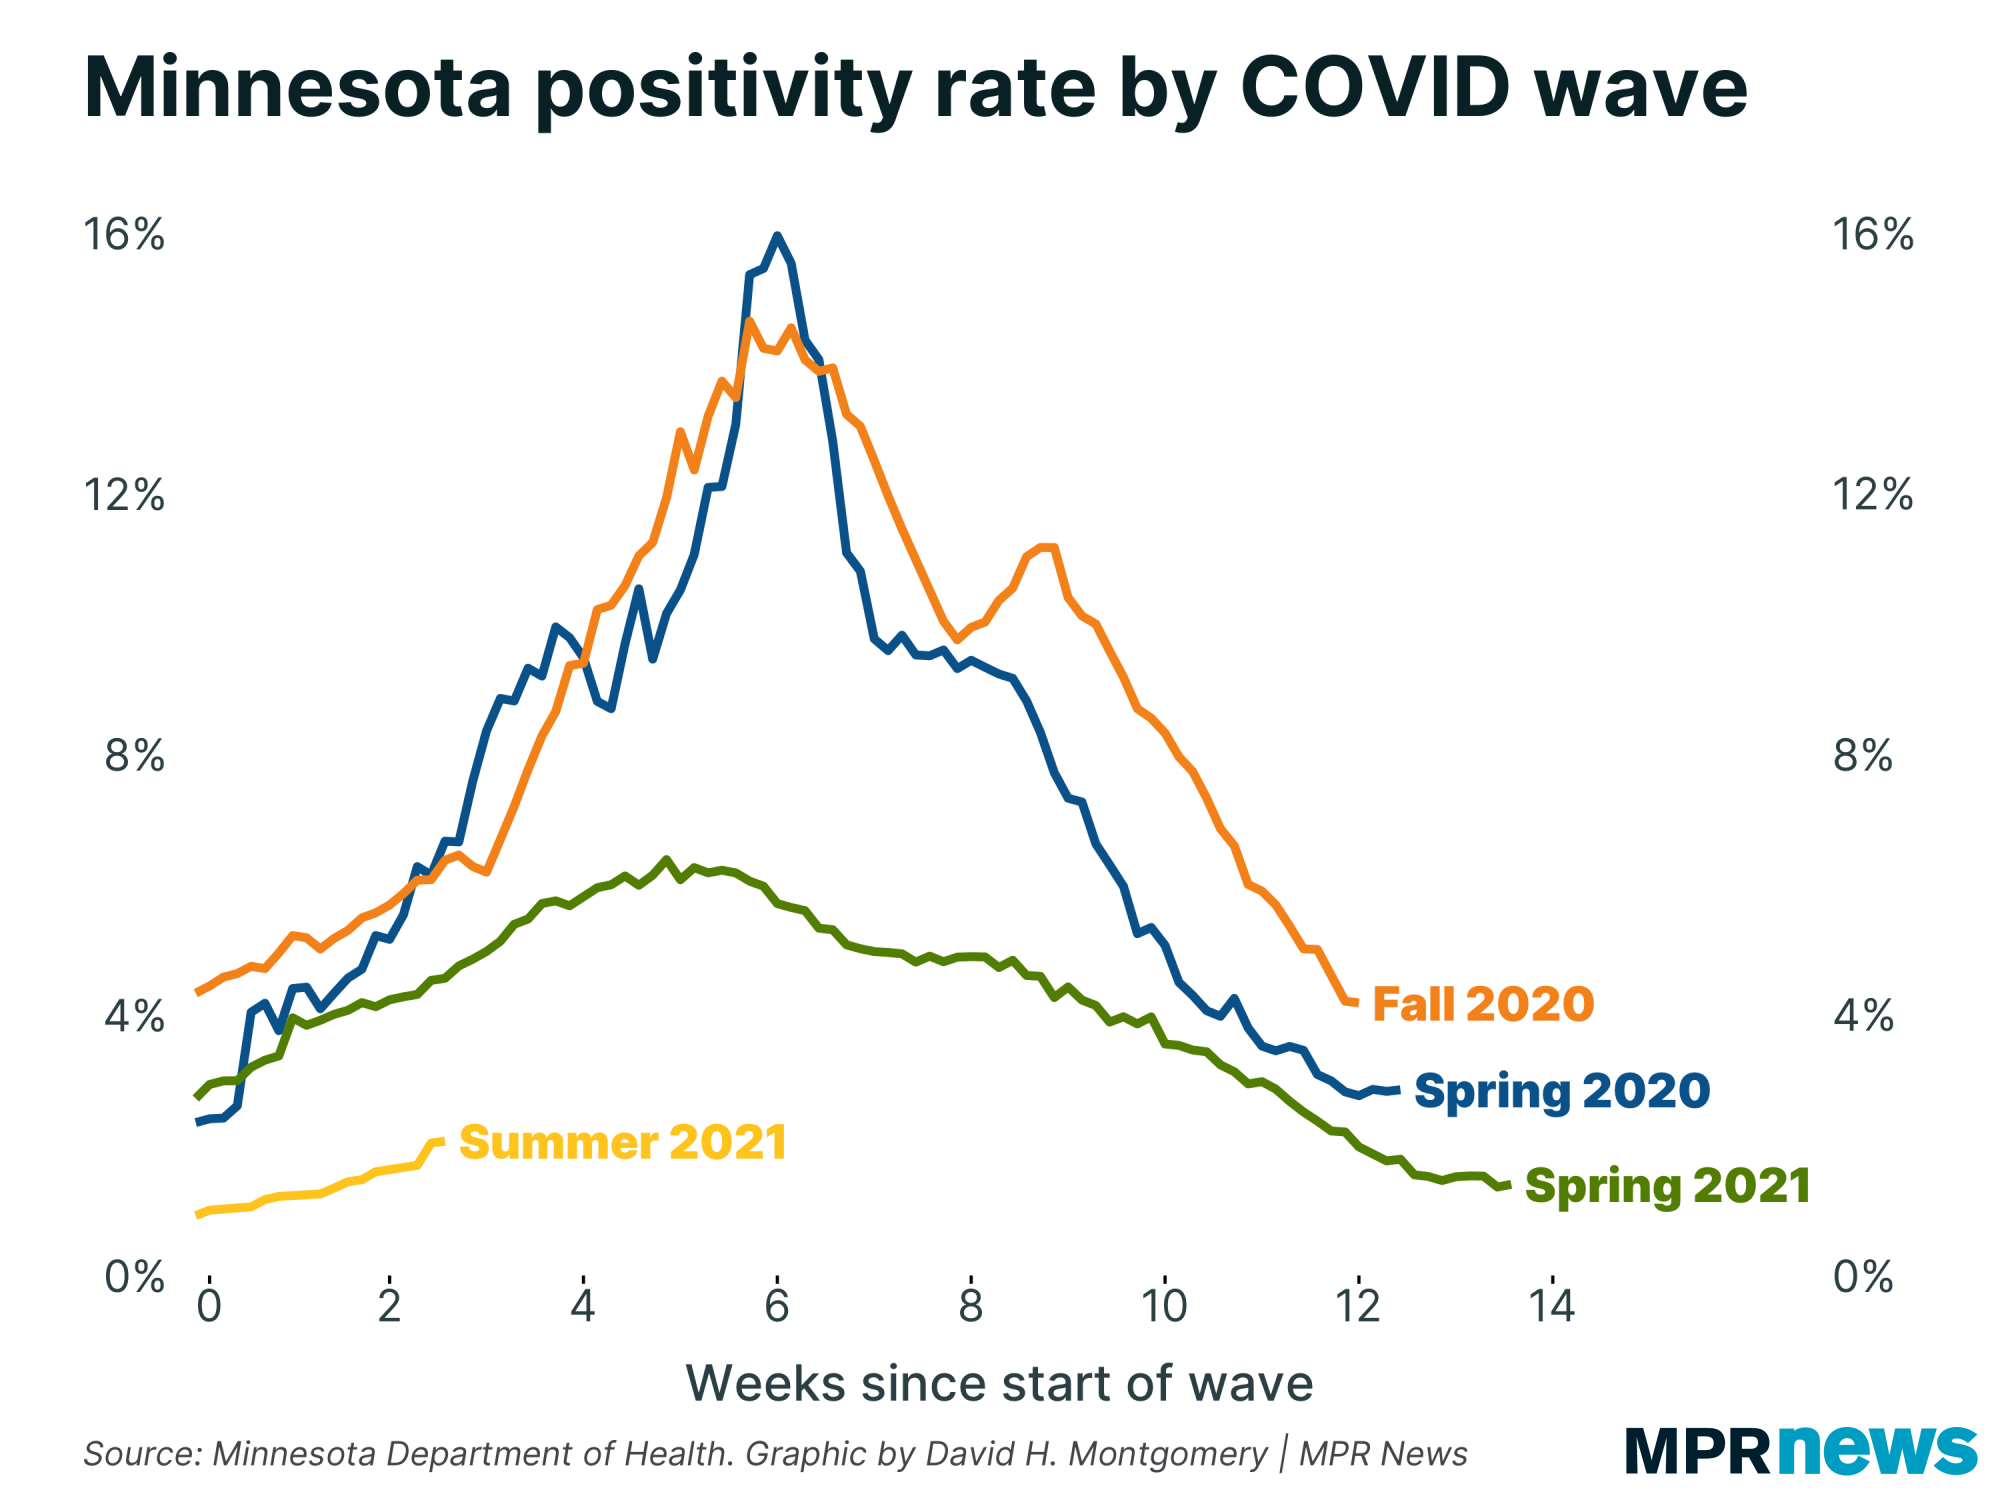
So let's put all this together now. How does what we're seeing right now compare to past waves?
For each wave, I eyeballed a "starting point," when positivity rate started to rise in earnest. Then I lined up each wave based on days since that starting point, so we can compare. | |
|
|
|
The first two waves — both pre-vaccines — look extremely similar. The third wave, with limited vaccination among vulnerable groups, was markedly different. And so far this nascent fourth wave is completely different — starting from a lower baseline, and rising at a slower rate.
Again, none of this is any guarantee that the pace won't pick up soon. Waves have tended to crest after about six weeks, so if that pattern still holds we've still got about three weeks of increases left to go, which could be more dramatic than the past three weeks.
But I wouldn't be shocked if this third wave ends up noticeably milder than the third (let alone the first two).
To make up some numbers, if you told me that this wave will peak in August with somewhere in the neighborhood of 500 new cases per day, a positivity rate around 4 percent and around 5 or 6 new ICU admissions per day, I would consider that very plausible. That would be significant, of course (especially for the susceptible population), but 500 cases per day, 4 percent positivity and 5 to 6 ICU admissions per day would be on par with some of the non-wave lows of the past two years, like last summer. |
| |
|
|
Below, I'll explore a few more stats about Minnesota's COVID-19 outbreak. If you want to learn more, I also recommend these other articles:
| | |
|
|
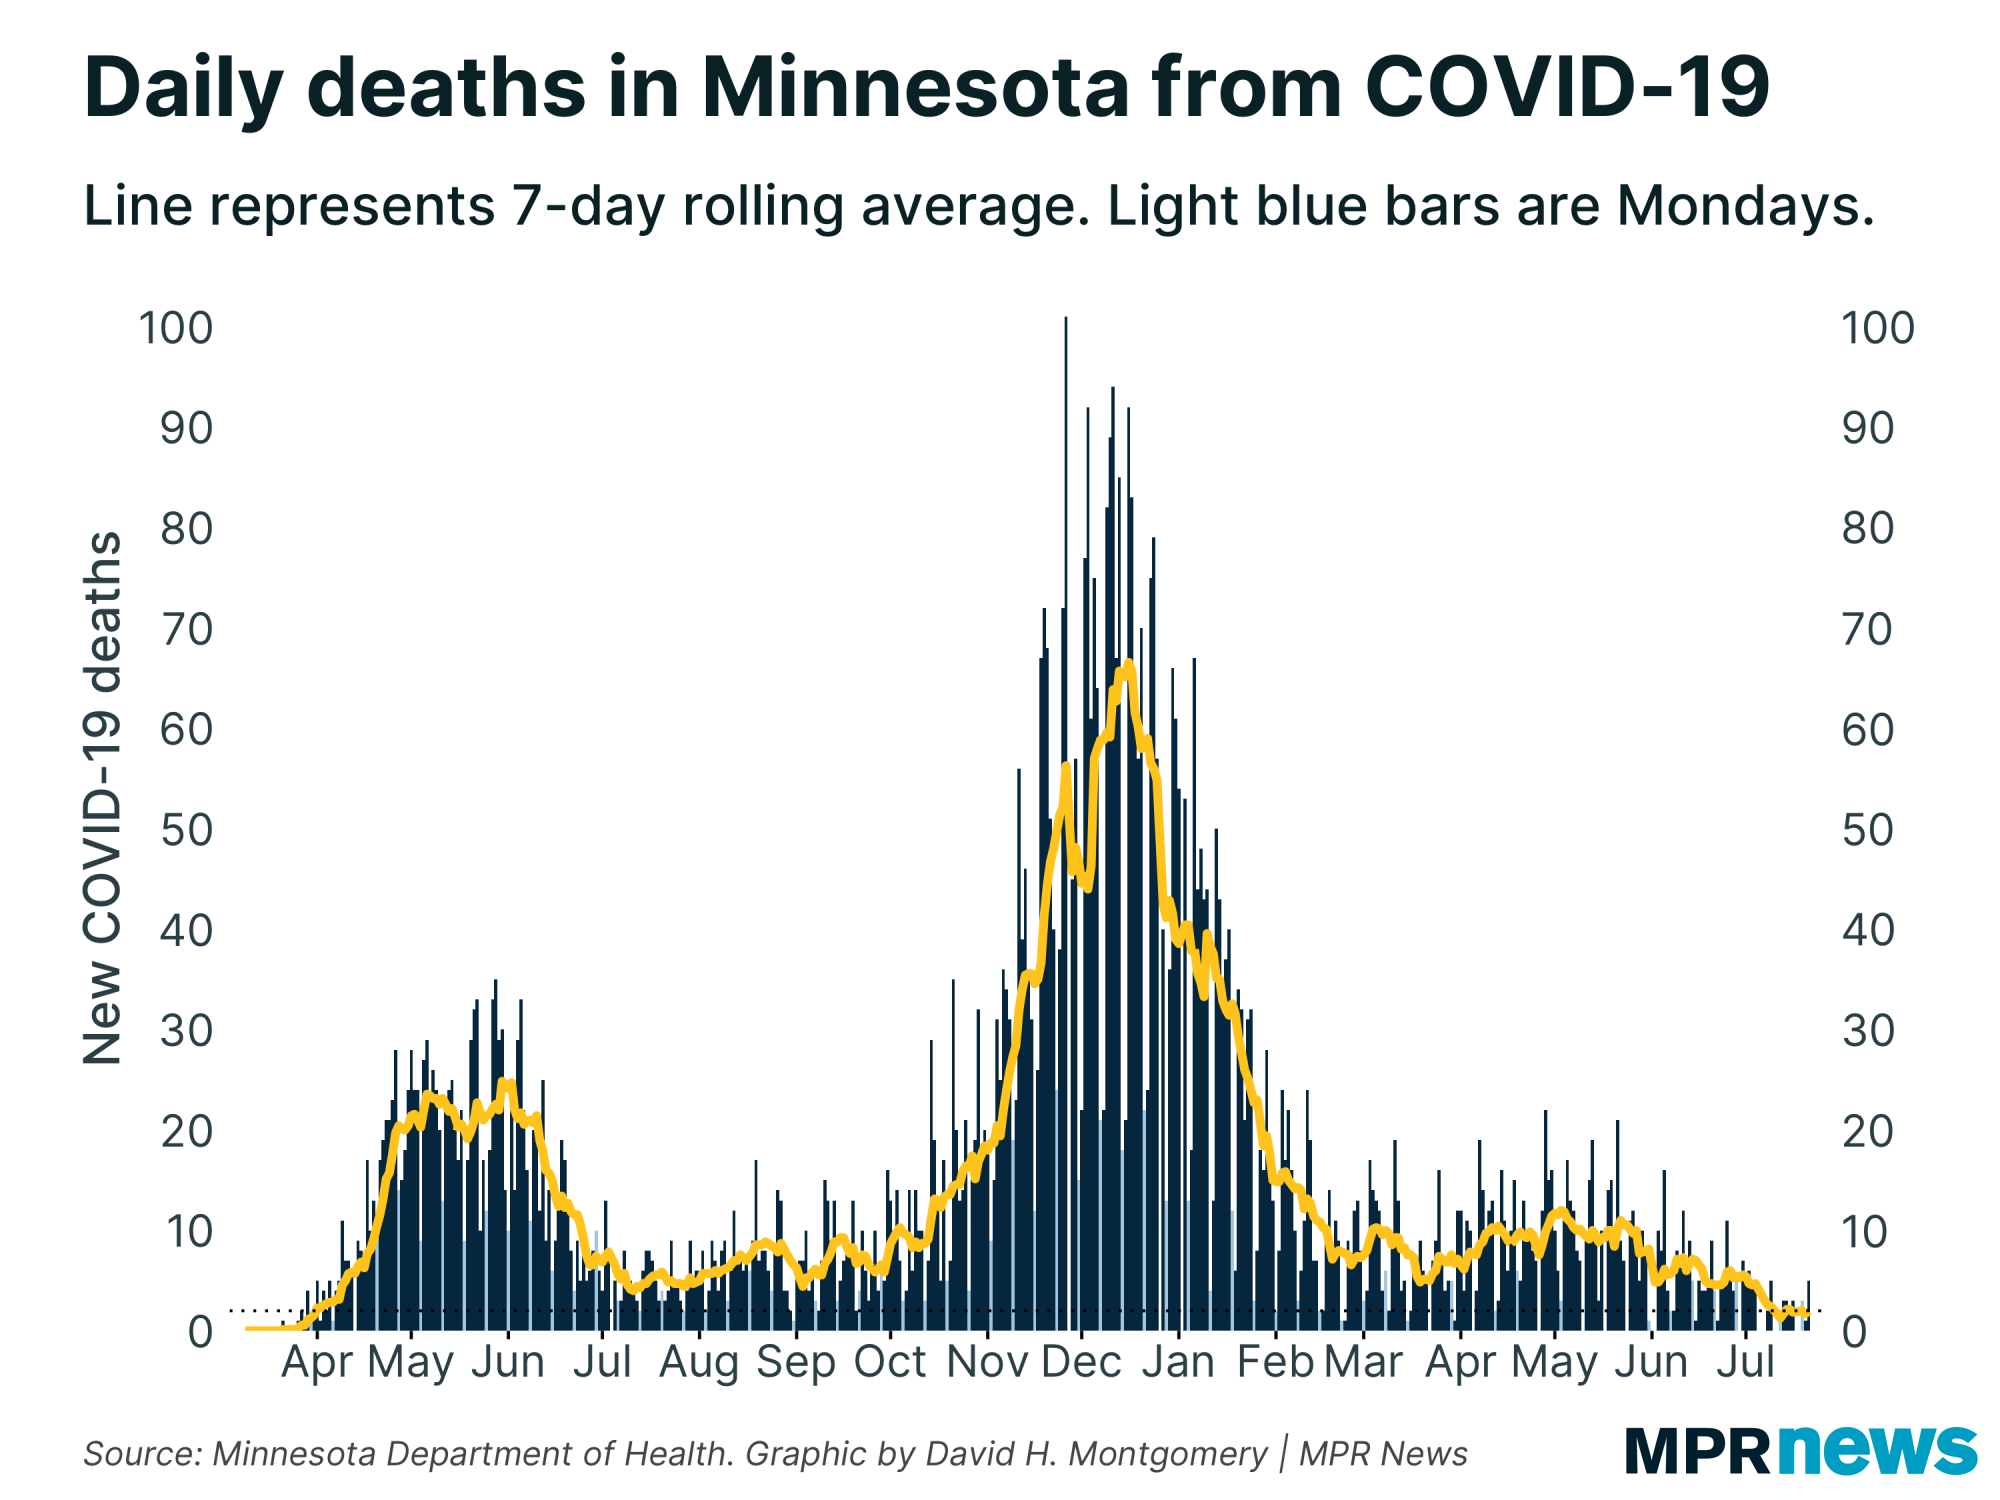
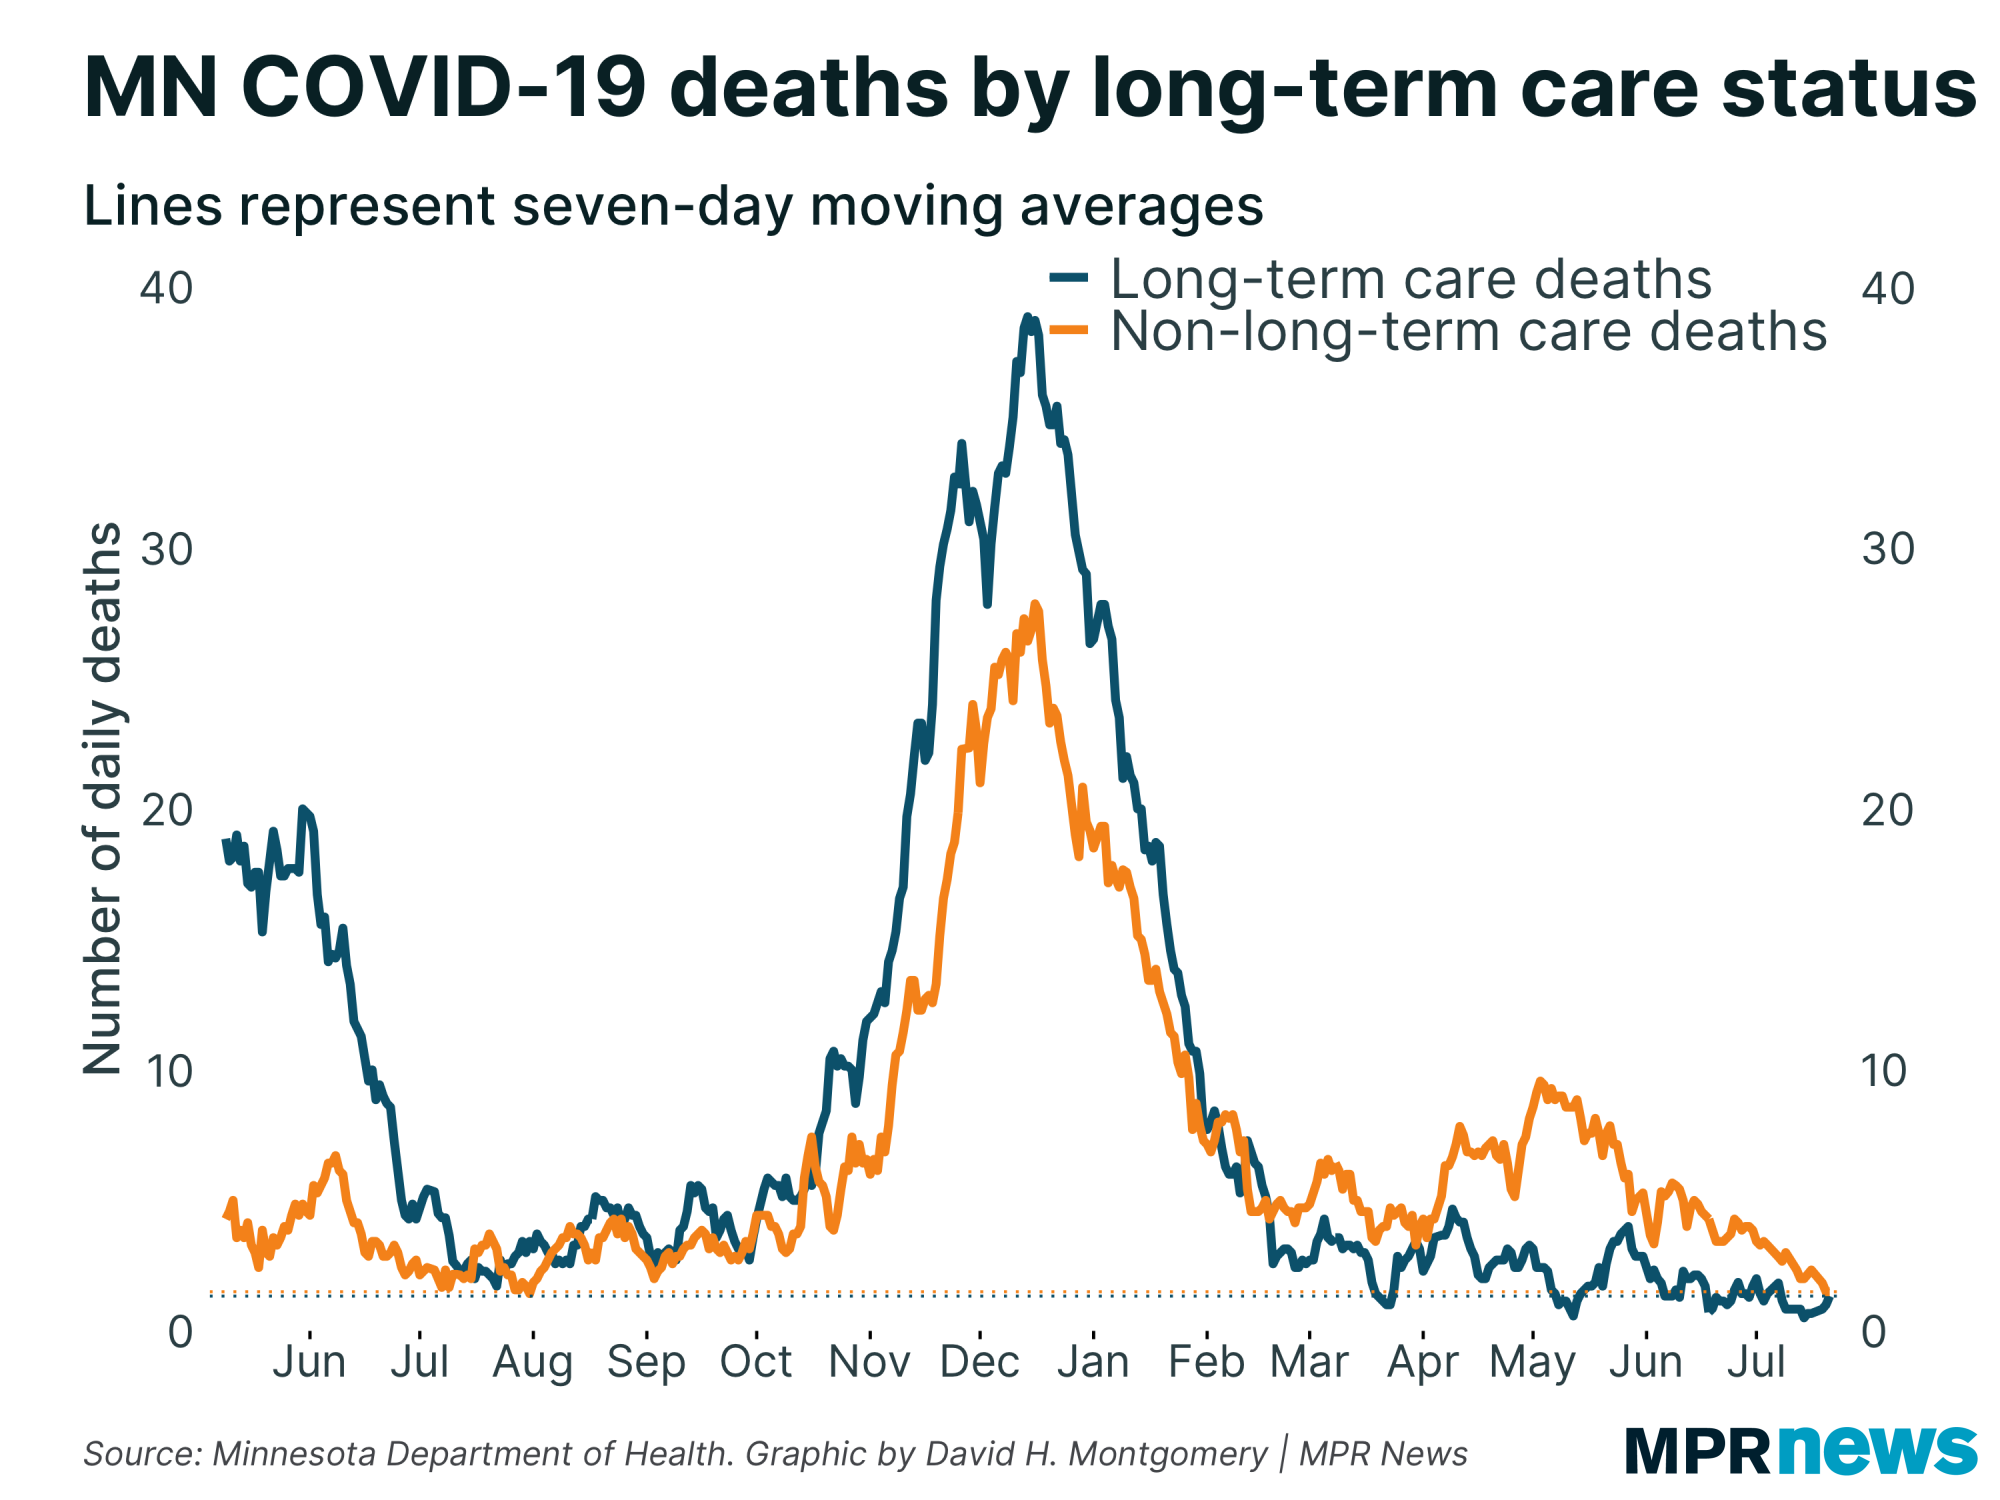
| Deaths hit record lows | | Even as Minnesota deals with an incipient fourth wave, our COVID-19 death stats are still reflecting the recovery from this spring's third wave. That means they've fallen down to record lows, around 2 newly reported deaths per day. |
| |
|
|
This decline in deaths has occurred both in and out of long-term care facilities. Nursing homes and other care facilities, home to the state's most vulnerable populations, saw outsized death rates for most of the pandemic. That changed back in February as Minnesota's older population got vaccinated, and ever since then we've averaged more deaths outside of long-term care.
Right now both figures are averaging less than two per day, with long-term care deaths remaining consistently low and non-long-term care deaths falling steadily. |
| |
|
|
| What remains to be seen is whether we'll see this rise again in a few weeks, reflecting deaths from the people infected by this current, delta variant-fueled fourth wave. | | |
|
|
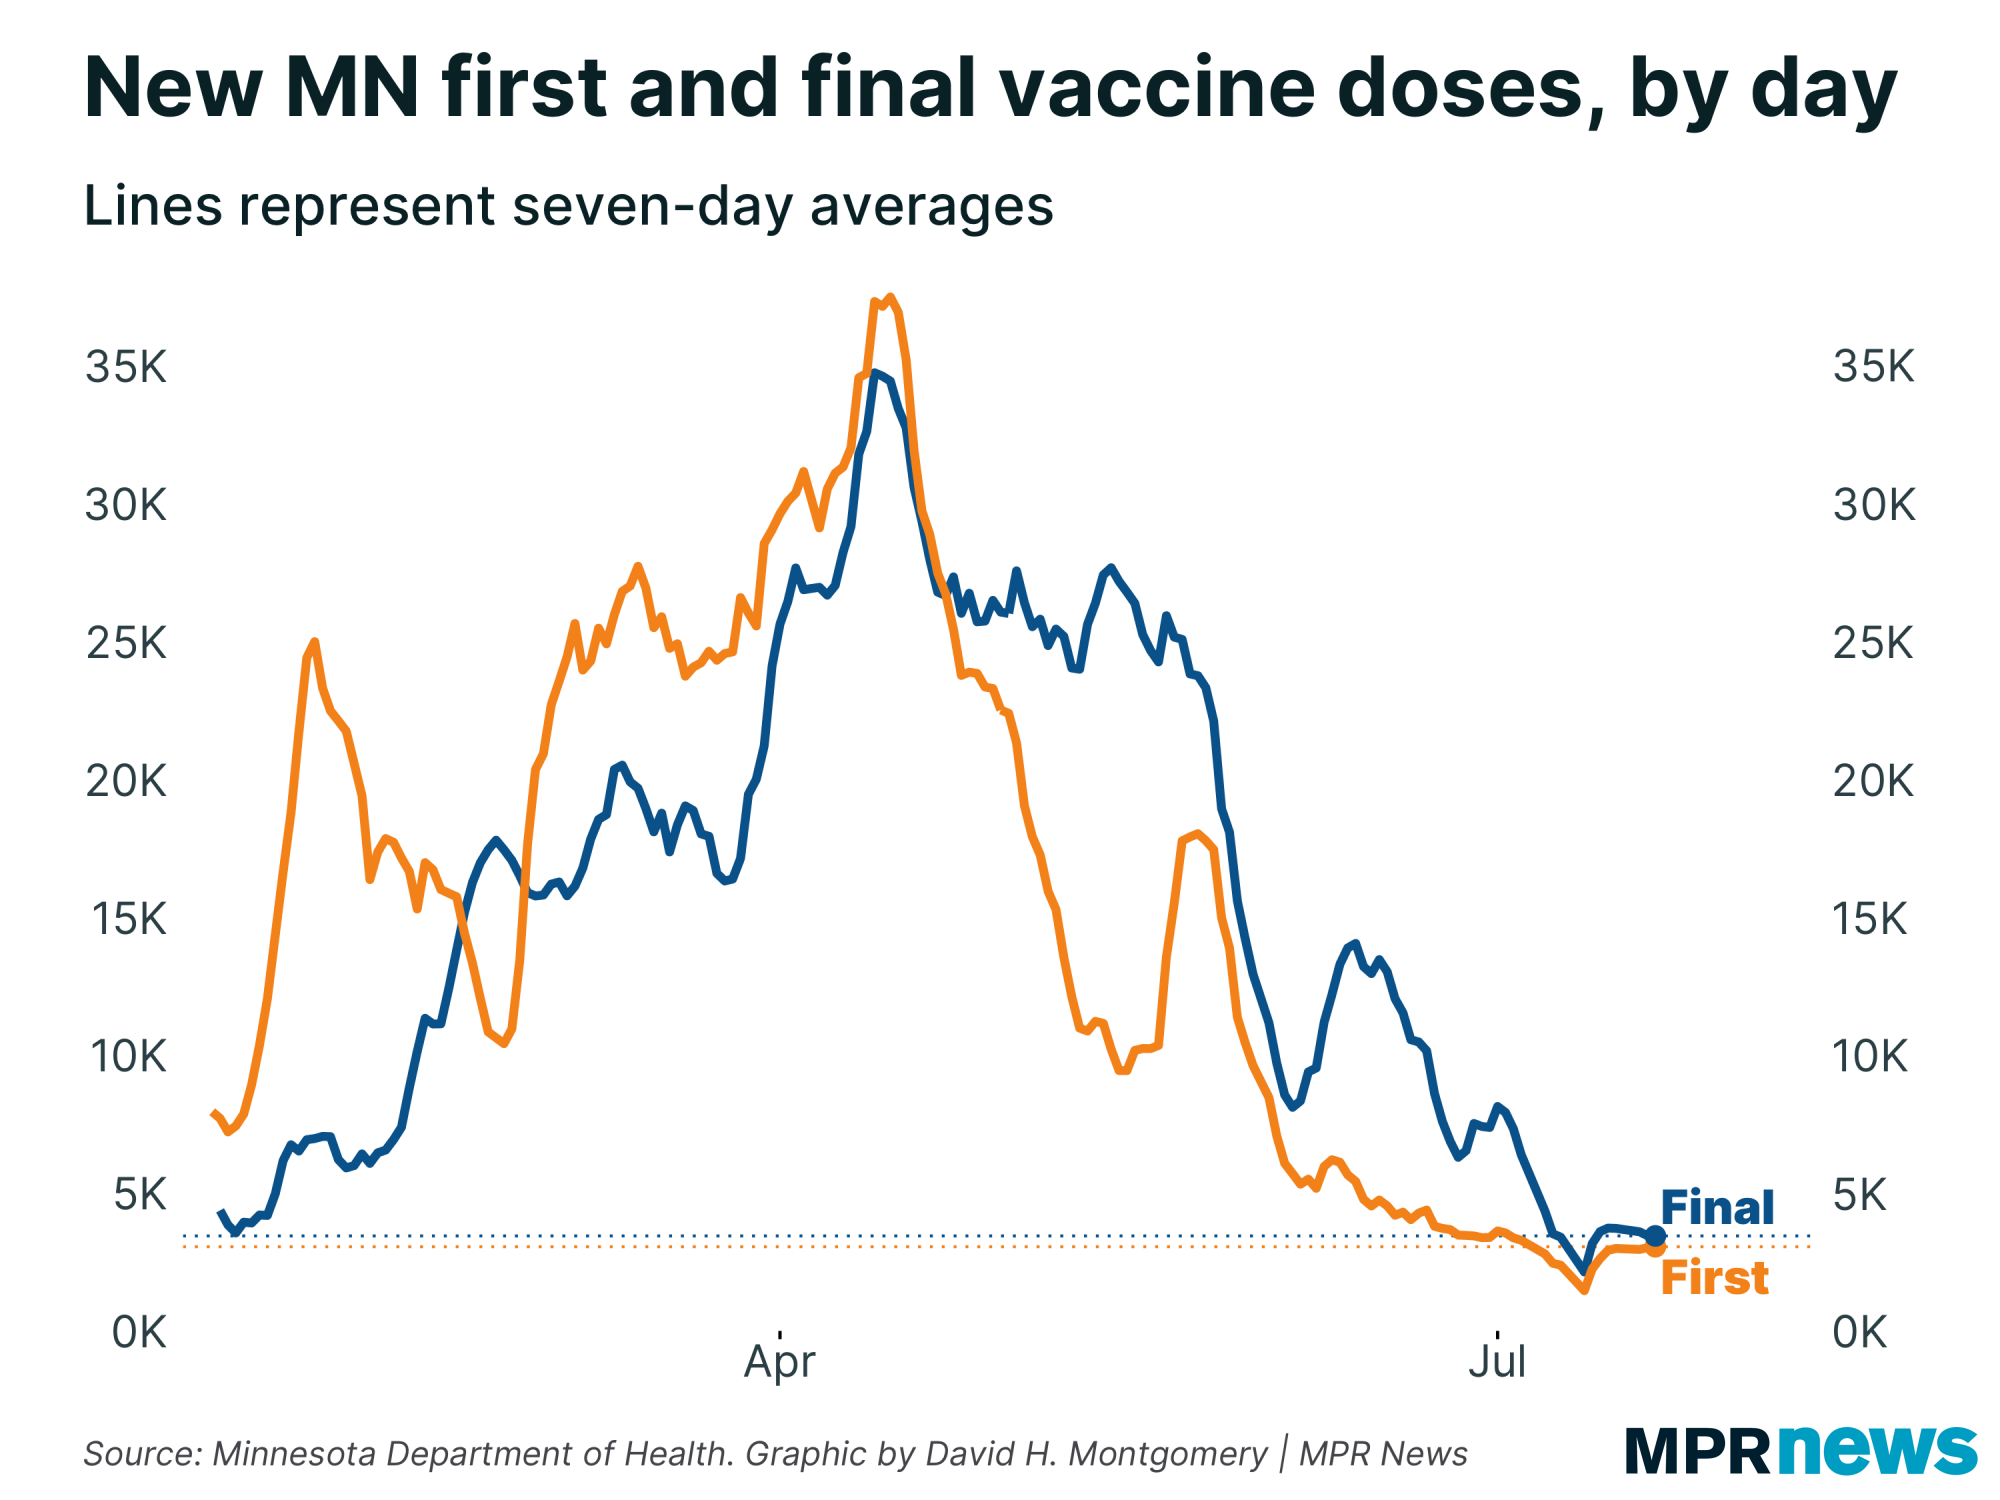
Slight uptick in vaccination rates
| | Back in early July, Minnesota's vaccination rates bottomed out just above 2,000 new first doses per day. Since then, we've seen a very slight uptick, to around 3,000 per day. |
| |
|
|
| What we don't know is whether this is driven by fears over this new COVID wave among previously hesitant populations. It could just be random noise. It could be a real and significant increase, but again it's quite limited in magnitude so far. Though 3,000 doses per day is a lot better than 2,000, it's a far cry from 10,000 or 30,000. | |
|
|
|
What's happening next?
|
I'm headed out for a camping vacation, so will be incommunicado the next few days. Next week I hope to be back with a closer look at how this wave is impacting Minnesota's Black communities, among other areas.
Thanks for subscribing to this newsletter and for all of you who've sent me your feedback. As always, if you like this newsletter, please share it and the sign-up link with others who you think might enjoy it.
— David |
| |
|
|
Preference Center ❘ Unsubscribe You received this email because you subscribed or it was sent to you by a friend. This email was sent by: %%Member_Busname%%
%%Member_Addr%% %%Member_City%%, %%Member_State%%, %%Member_PostalCode%%
  |
|
|
| | |