| Welcome back to COVID in Minnesota TODAY, an email newsletter from MPR News about understanding the latest developments in Minnesota's COVID-19 outbreak. | | |
|
|
| Minnesota's COVID-19 metrics moved in the wrong direction this week. But the manner in which they rose was less alarming than last week's disaster. What will next week hold? We'll find out. | | |
|
|
Three things to know
| - Minnesota's COVID-19 metrics continue to rise, but rose less quickly this week than last
- Kids 5 to 11 are getting vaccinated at a brisk but not record-setting pace
- COVID-19 deaths remain high, but one big difference is long-term care residents aren't getting ravaged at the same rates they were last year
|
| |
|
|
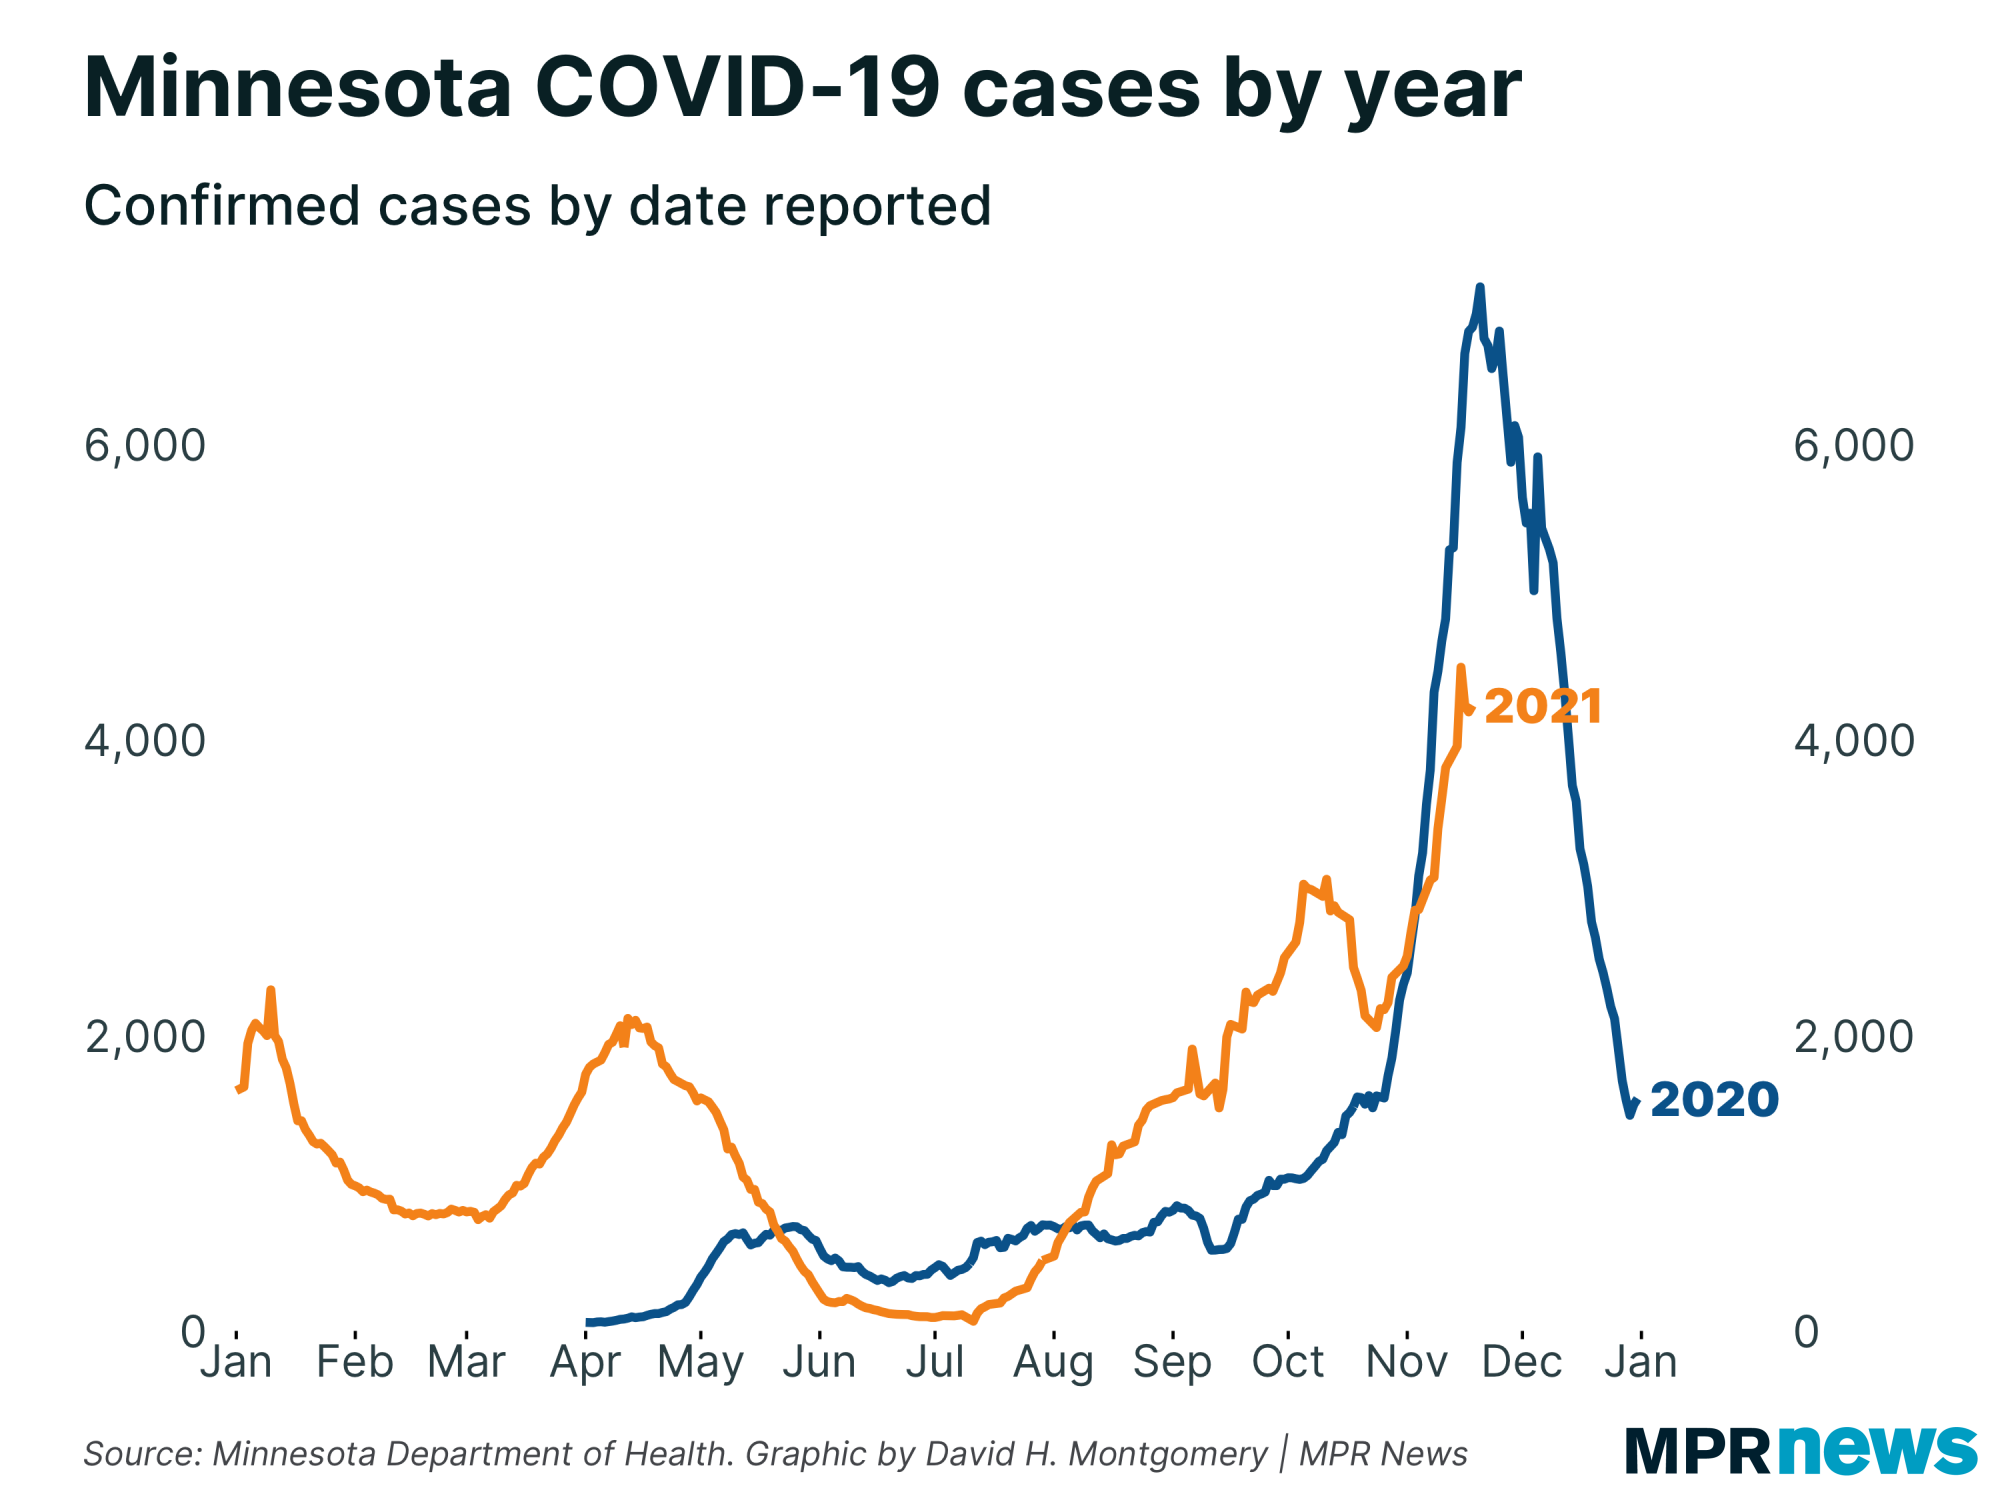
Last week, confirmed cases were skyrocketing at essentially the same pace we saw in last November's deadly surge.
This week, fortunately, saw that pace slacken a little bit. It was a bit bumpy with some ups and downs, but the upshot is over the last week, average new cases in Minnesota went up by 11 percent. Last week they shot up 33 percent. | |
|
|
|
Some of those ups and downs are artificial. Last Wednesday and Thursday were really brutal days because of a minor backlog from the weekend. So this Wednesday and Thursday actually saw cases drop week-over-week. That was artificial, just as last week's bumps on those days were. We've now worked that backlog out of our system, and the upshot is the pace of new cases has dramatically slowed.
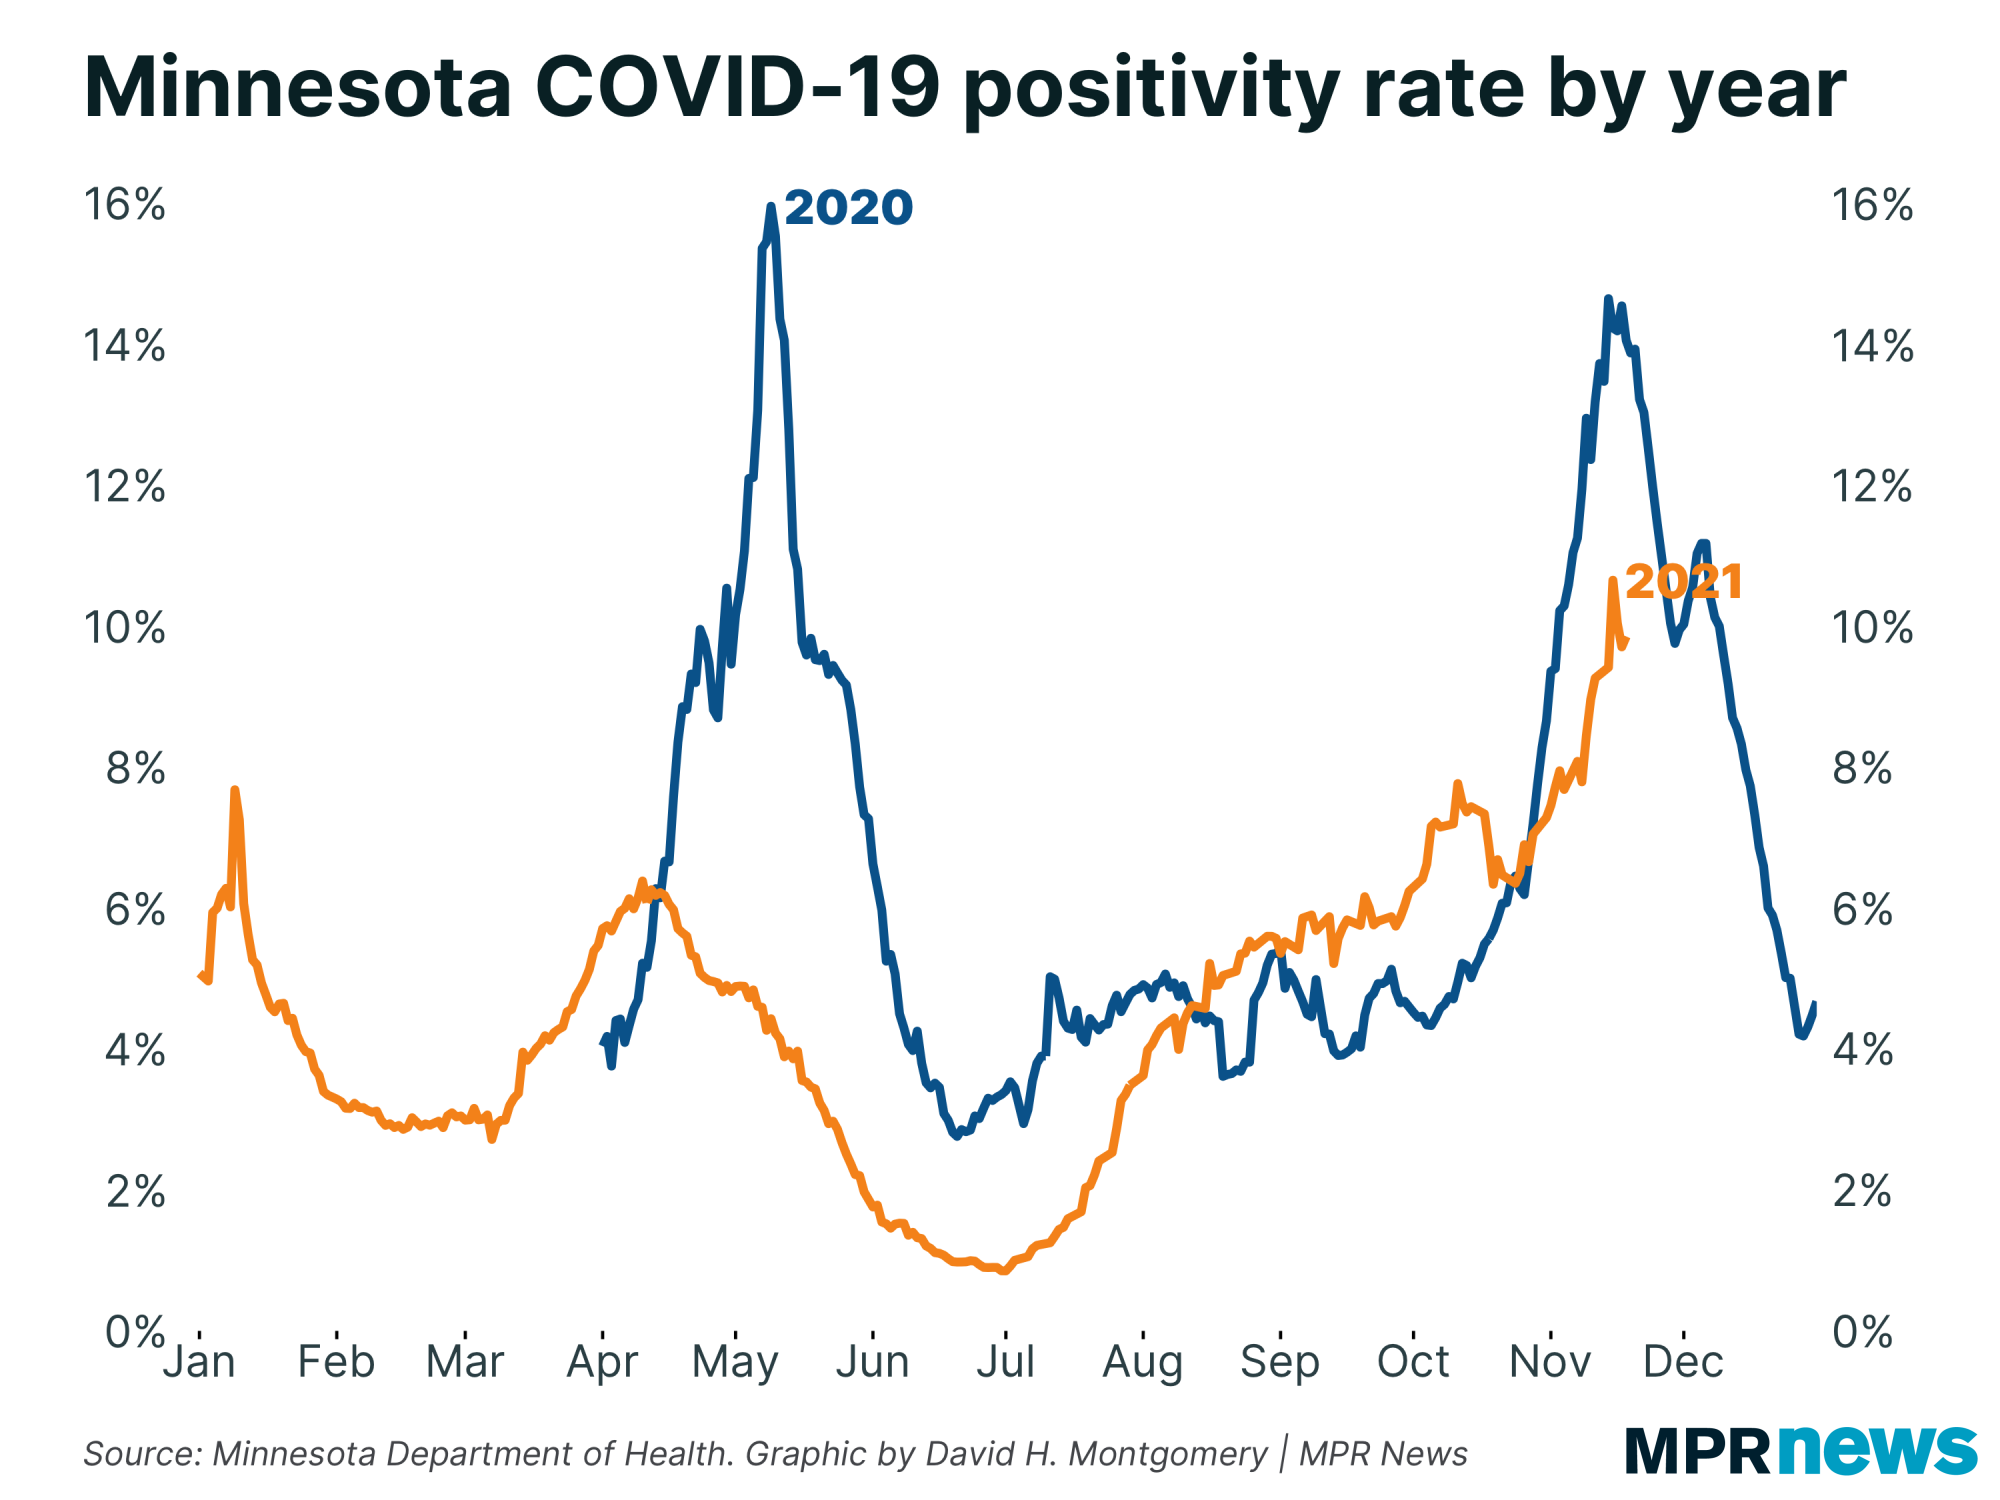
It's even more dramatic with positivity rate, up 6 percent this week after 20 percent last week, and clearly not at all on the same trajectory as last fall. Though we briefly passed 10 percent positivity this week, nothing yet suggests we're going to be threatening to pass 15 percent any time soon. (It's possible, we're just not heading in that direction.) |
| |
|
|
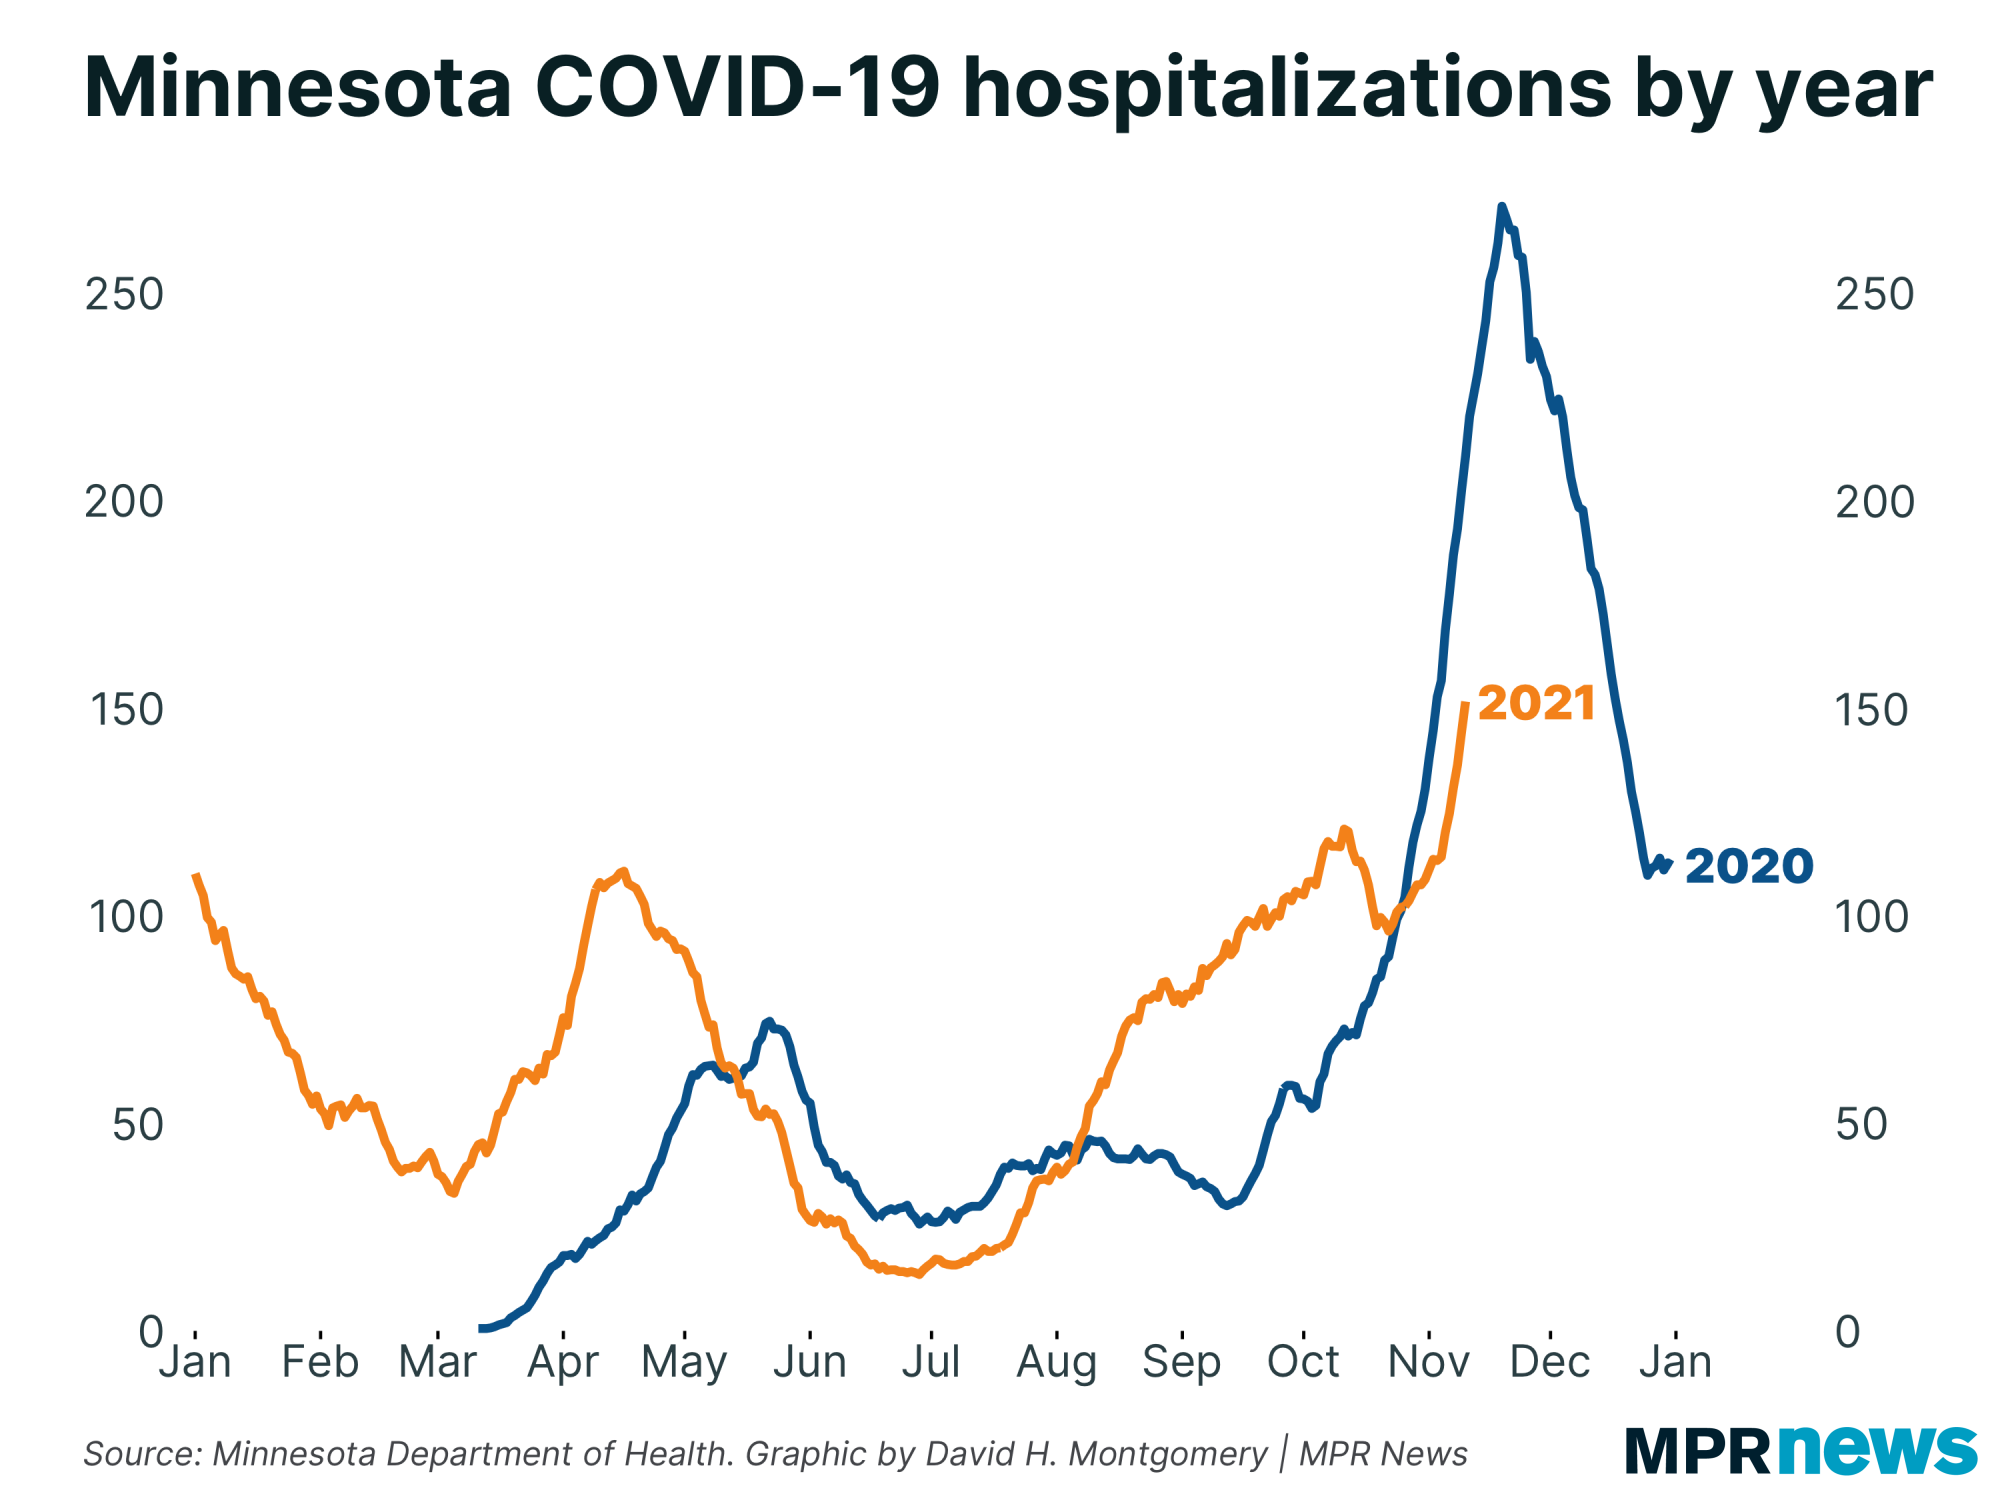
| The one metric that is rising aggressively is hospitalizations — but remember this metric has a bit of a lag after infections. This week's spike in hospitalizations could just be last week's spike in cases playing out. | | |
|
|
But the hospital crunch is real, and a good rebuttal to anyone who argues that cases don't matter as a metric in the age of vaccines. Theoretically we could reach a point on day where cases are irrelevant because infections rarely turn serious. But we're clearly not there yet; there continues to be a tight correlation between case counts and hospitalizations. Until we see those decouple, cases will continue to be useful as a leading indicator of what will happen with hospitalizations.
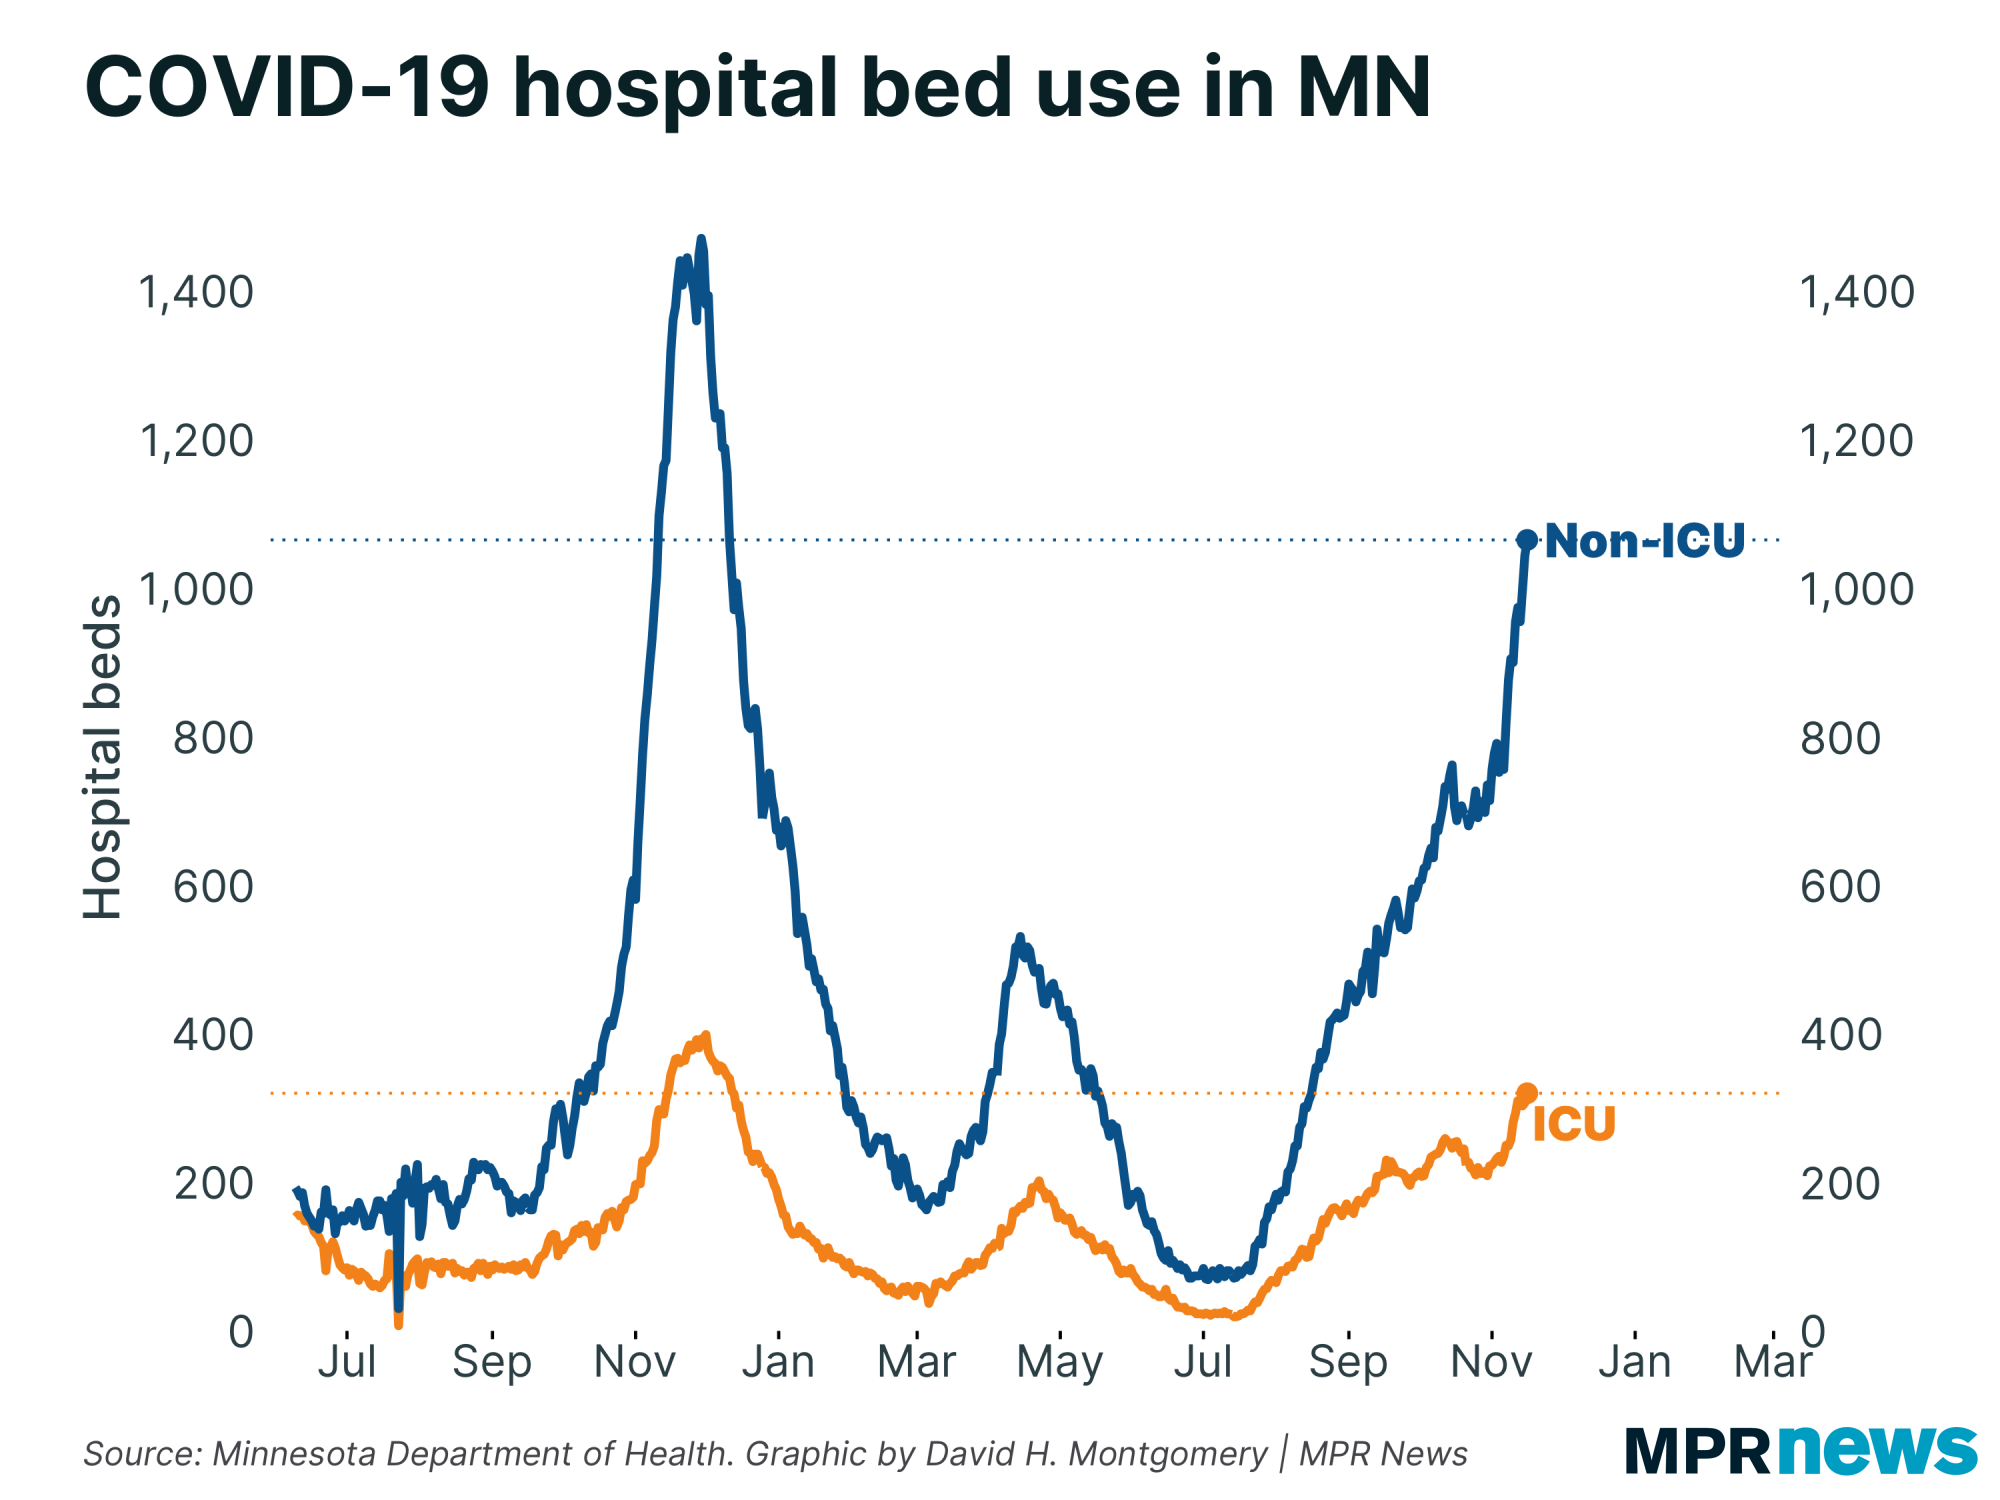
In the meantime, we're seeing COVID-19 hospital capacity at not far below the levels reached last fall. |
| |
|
|
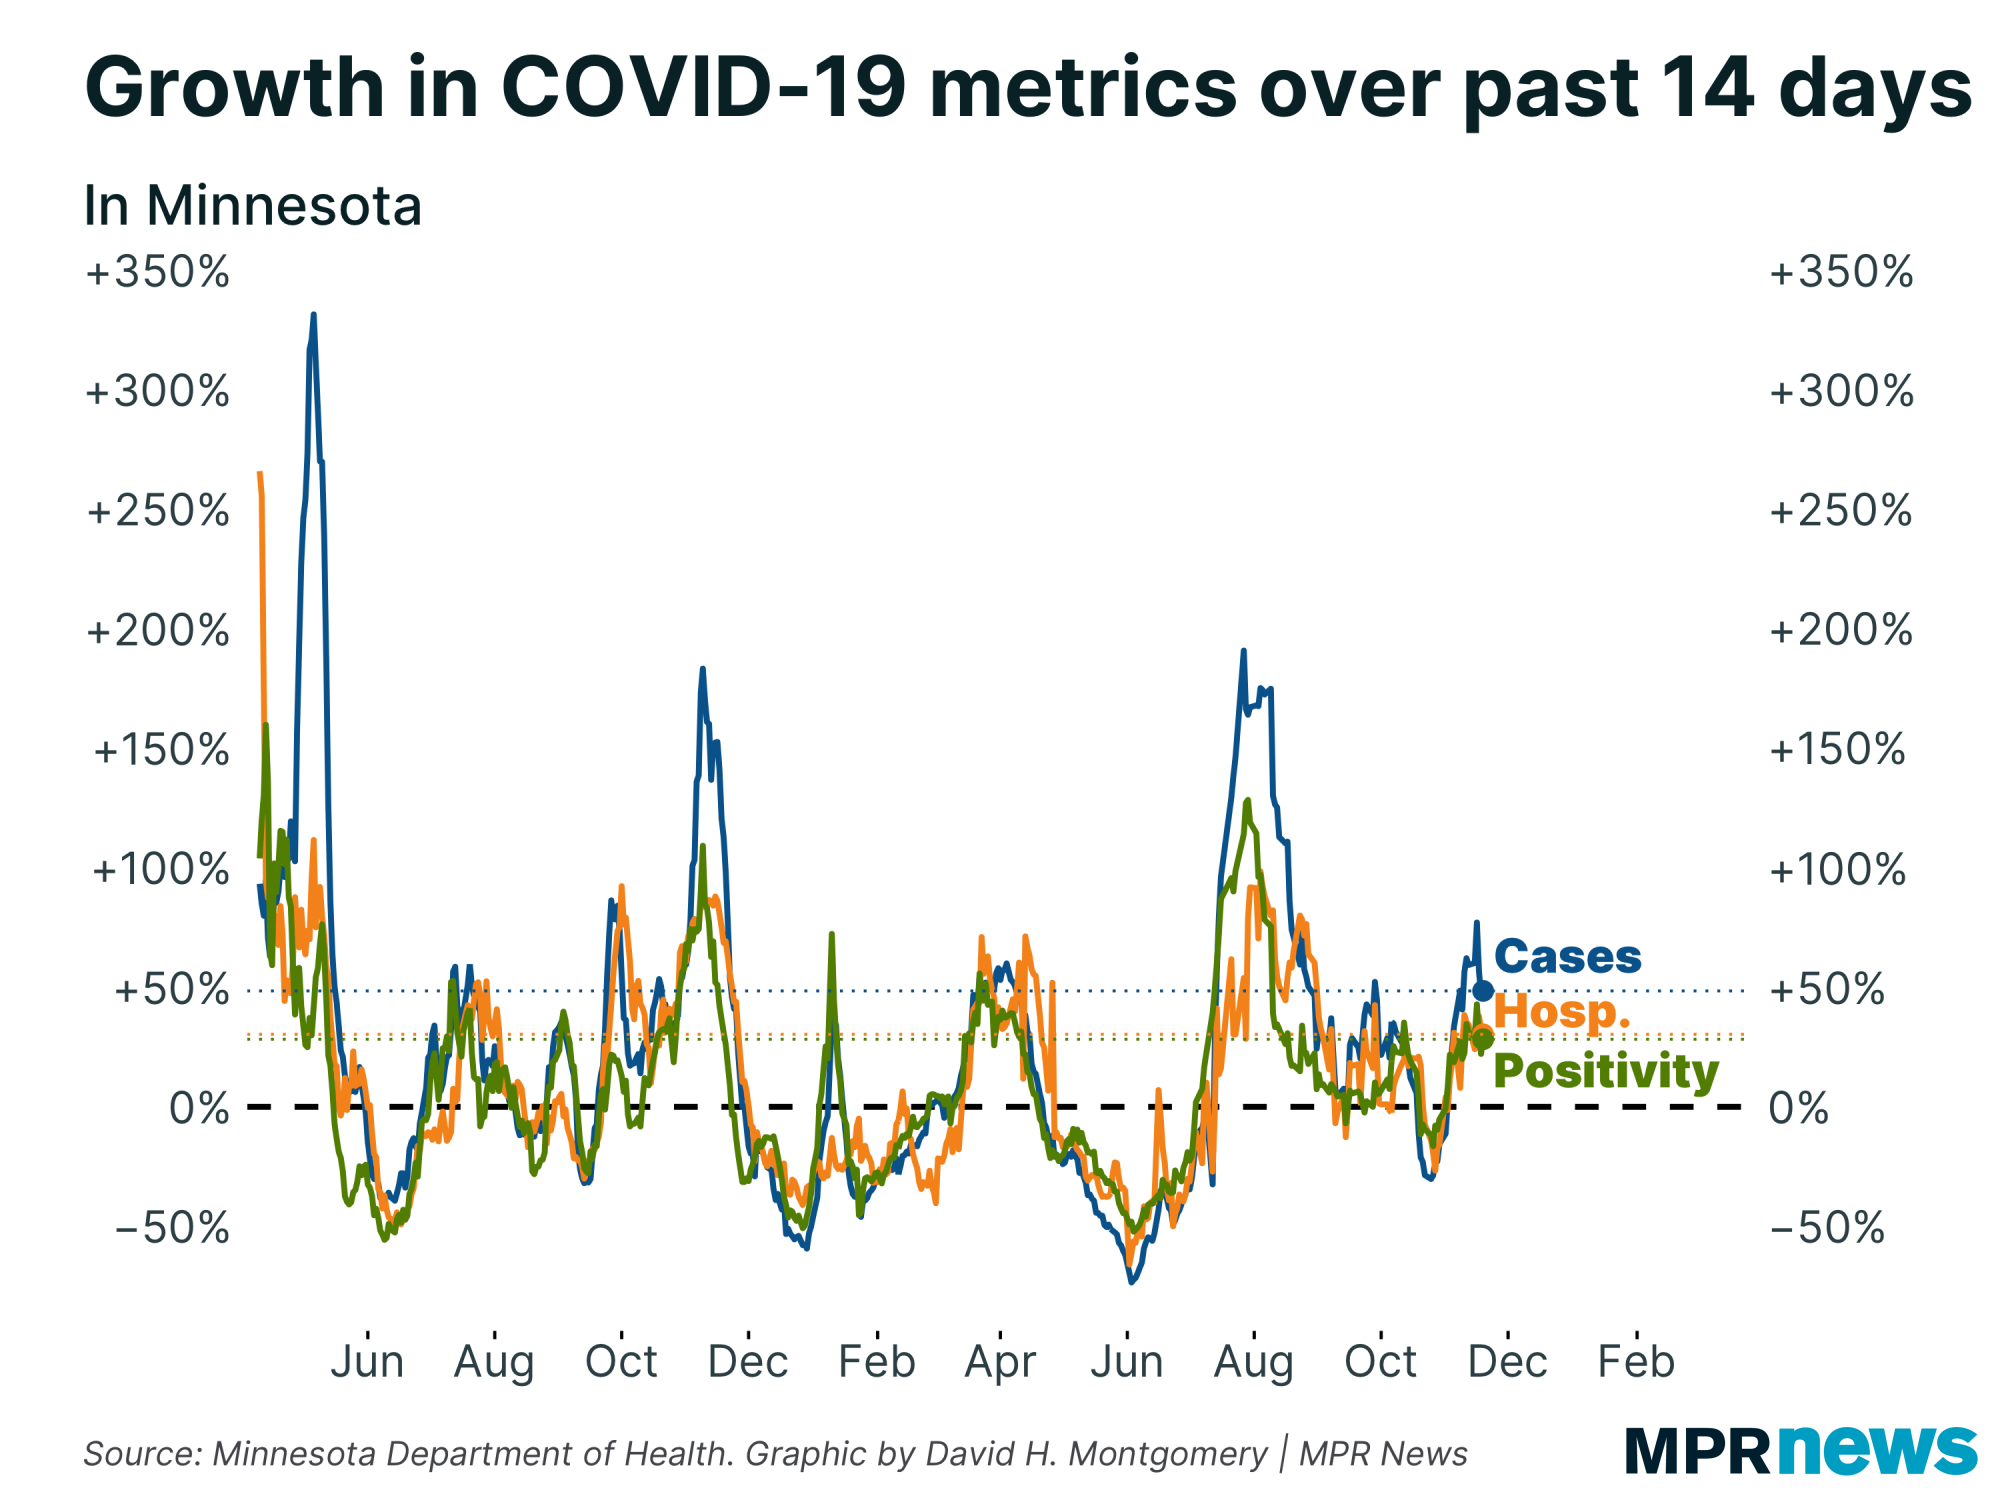
| The graph below tells the whole story. All these metrics are still rising (hence the lines being above zero). But they're no longer accelerating, indicated by lines moving upward. | | |
|
|
Any day that we don't see COVID-19 metrics accelerate is relatively good news. And if this slowdown continues for more than a few days, that could be a sign of an impending peak. (Growth slows before it reverses.)
That's all for the future. One week of slow growth is no guarantee that next week will also feature slow growth! It's possible we could leap right back to acceleration.
As readers of this newsletter know, my attempts to forecast the future based on current rates-of-change have a decidedly mixed track record! A growth slowdown back in August, about the time when past weeks had peaked, turned out to be entirely illusory, and cases kept rising and rising as weeks turned into months.
All that is prologue for this coming bit of ill-advised bad statistics from yours truly. The hypothesis I present to you is, what if the rise in cases we saw from early July through late October was not in fact a COVID-19 "wave" as we've traditionally understood it? Whatever it was, it clearly didn't follow the "rules" we've observed in past waves. Maybe that's just because the delta variant is different.
But if July through October wasn't a "wave," then what we've seen in November clearly looks like past waves, with aggressively spiking cases counts, positivity rate and hospitalizations.
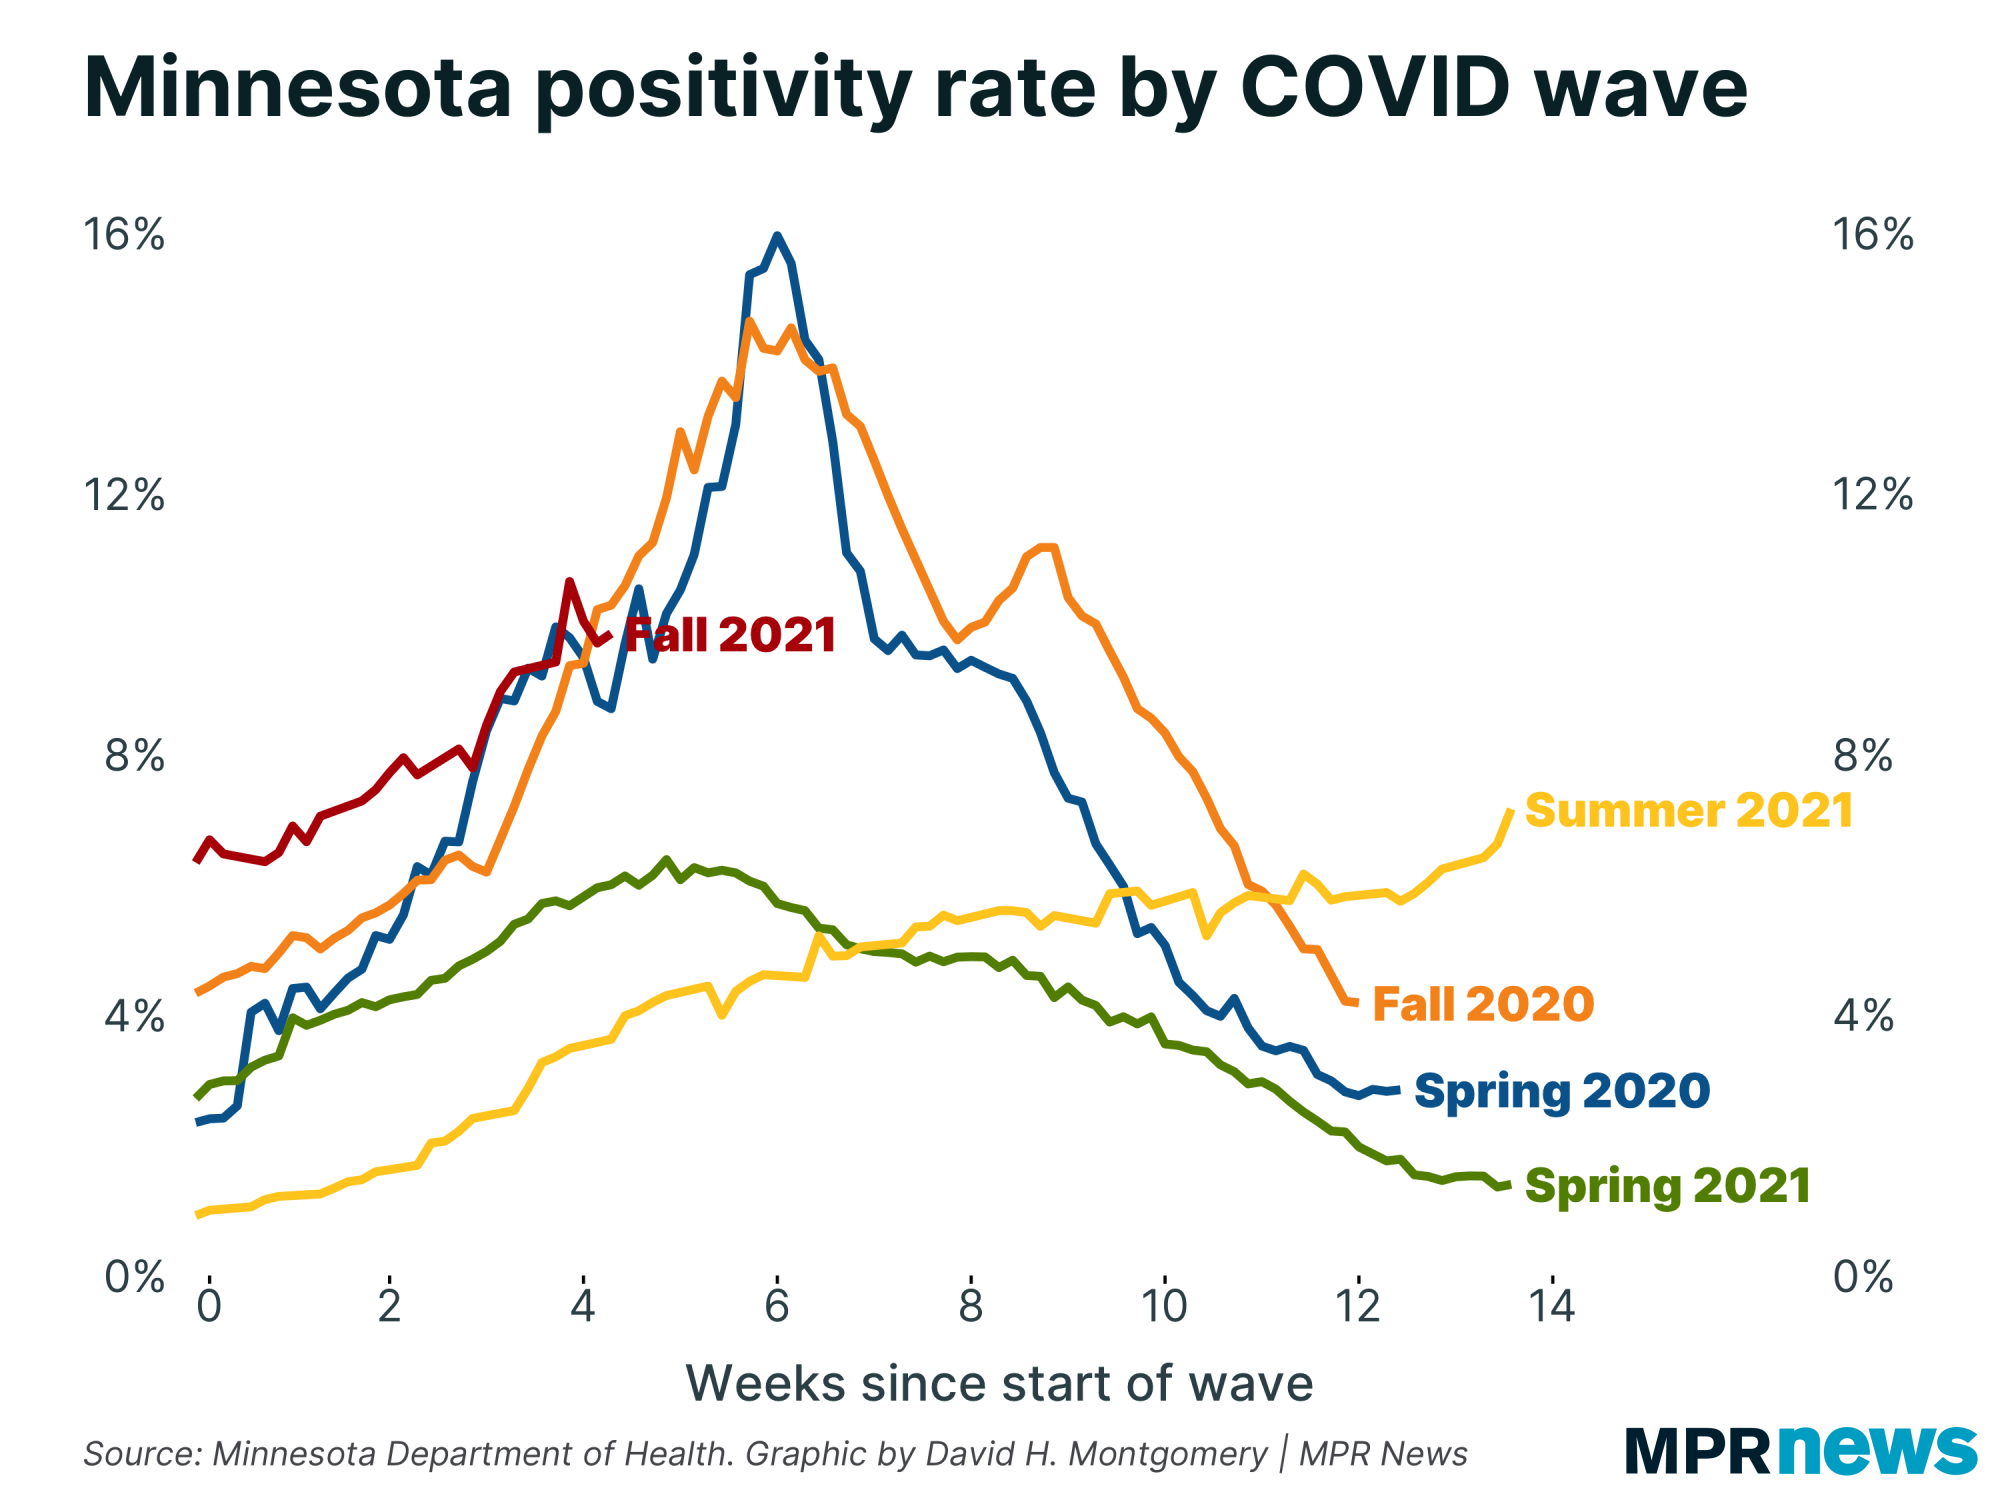
So here's a chart many of you are familiar with, lining up Minnesota's COVID-19 waves next to each other. But here I broke out the Summer 2021 line from the Fall 2021 line, which kicks off at the moment positivity began rising again in late October, after that teasing fall. |
| |
|
|
If this hypothesis is accurate, and this is a "normal wave," then we might expect a peak to come in about two weeks — around the beginning of December.
Is it accurate? Who knows. This method is super fuzzy to begin with. On top of that, the move I did here — "The data doesn't fit the model, so I'm going to throw out the bad data and see if the fit improves" — is incredibly sketchy! You shouldn't trust me on this until such point as evidence validates this hypothesis.
But I believe there's value in making public predictions before we know the result, so I'm putting myself out there again with a very soft prediction that we're due for a peak around early December. (If this week's trend is any indicator, our peak will be lower than the two bad 2020 waves, but that's going even further out on a limb!)
As always, I will update you in a few weeks with how things turned out. |
| |
|
|
Below, I'll explore a few more stats about Minnesota's COVID-19 outbreak. If you want to learn more, I also recommend these other articles:
| | |
|
|
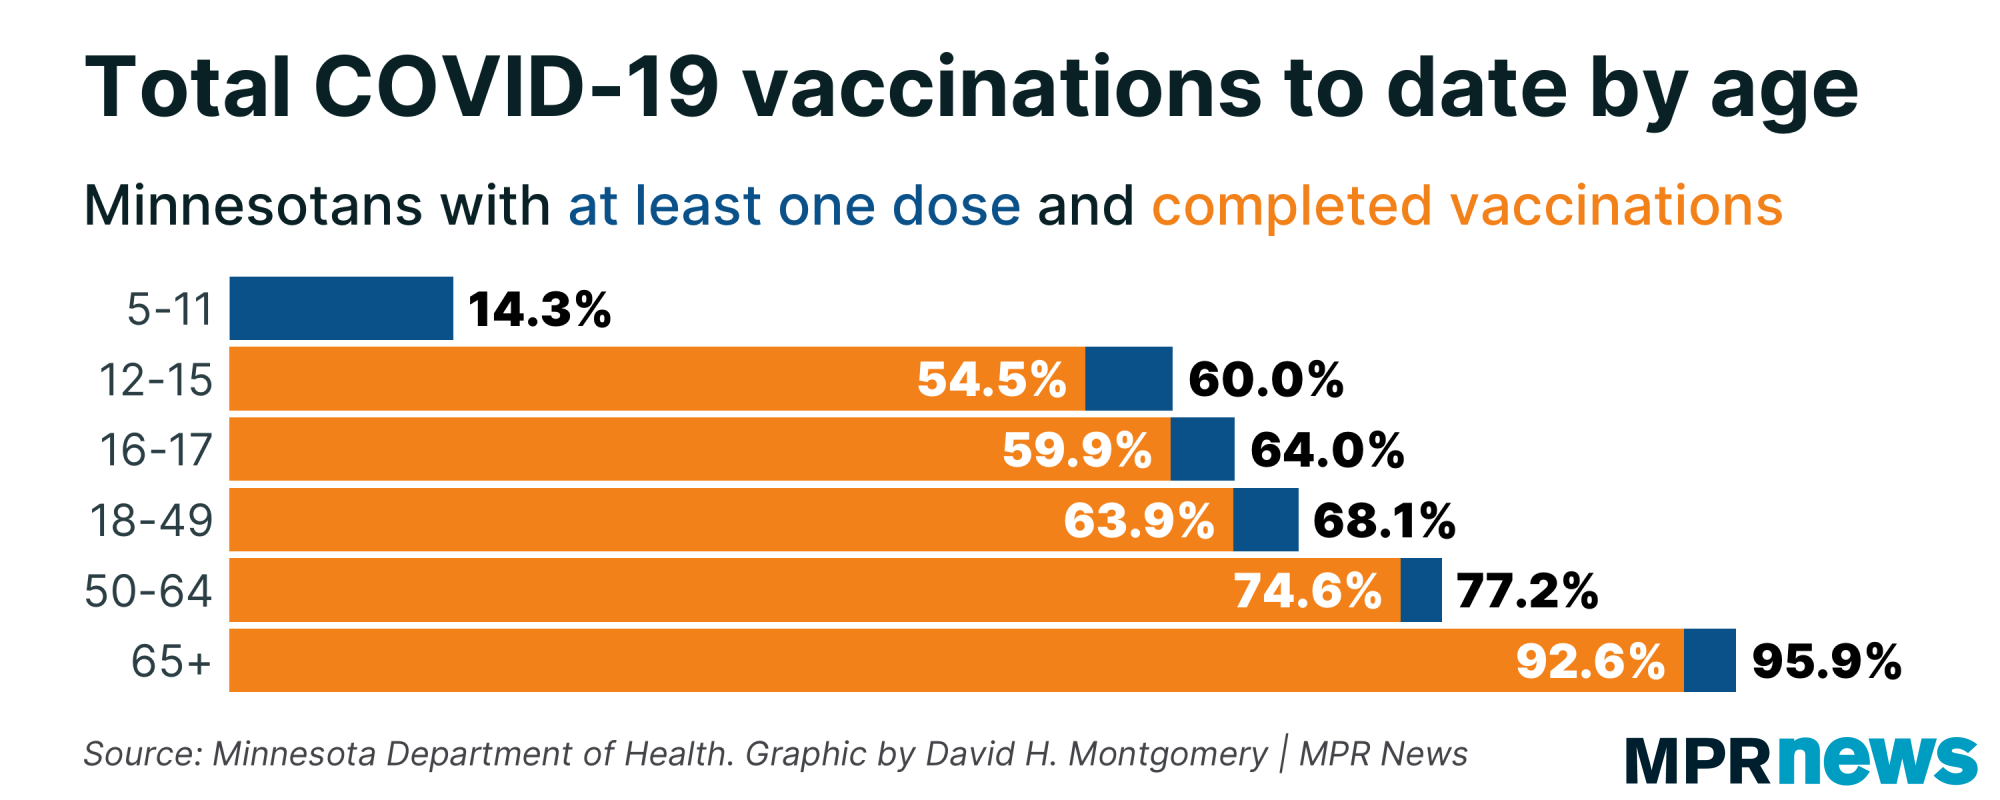
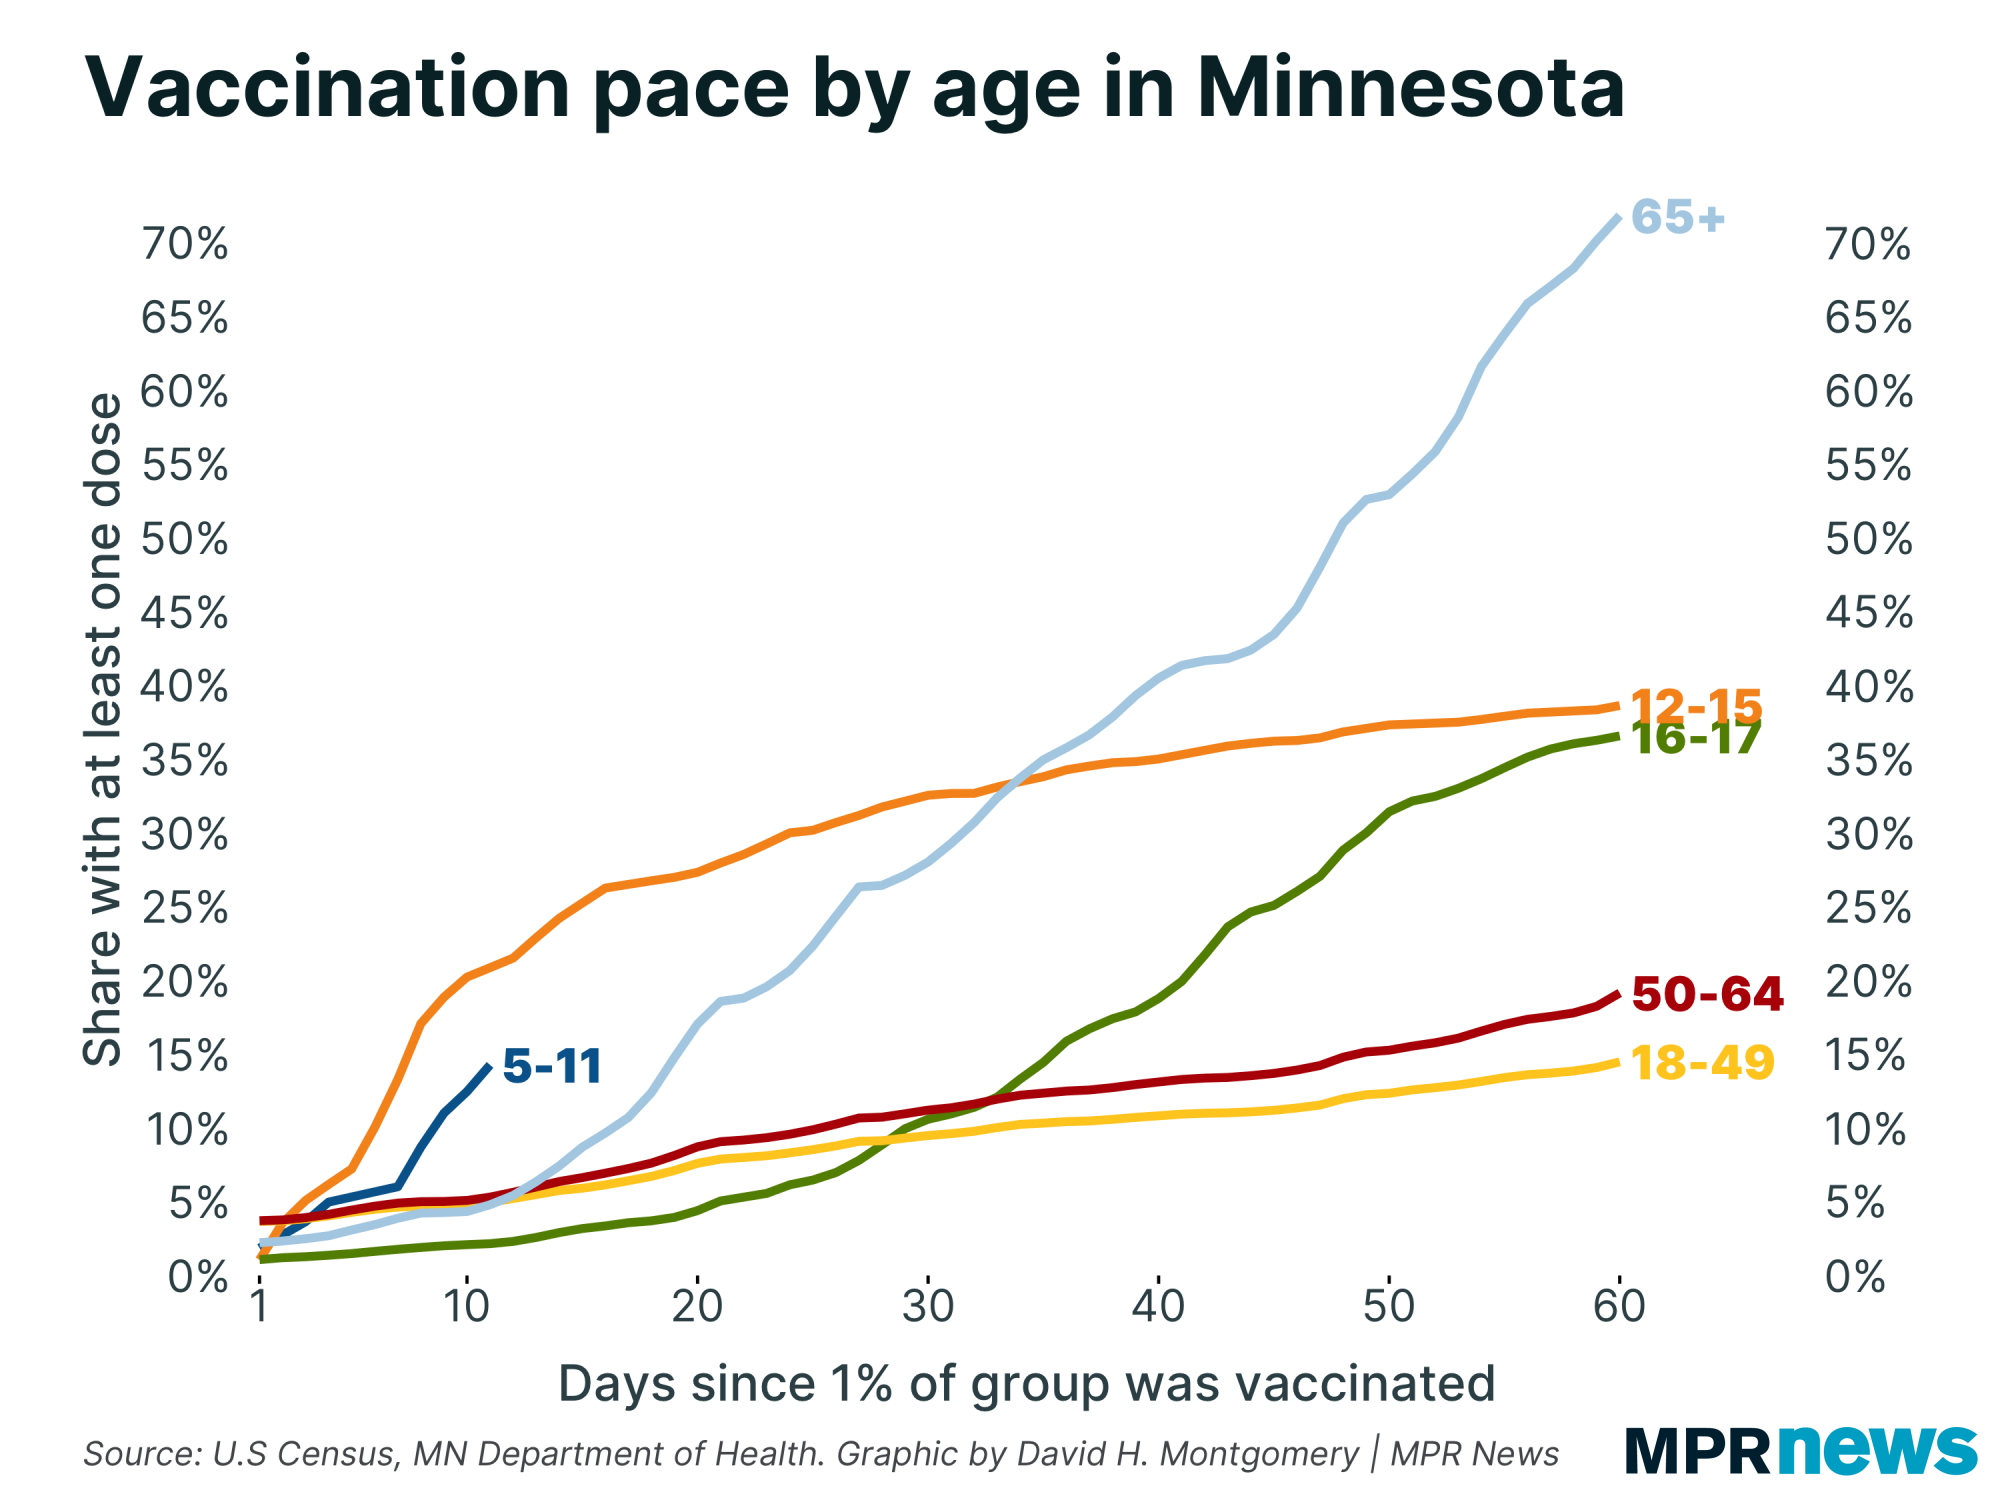
| Kid vaccinations rising at modest pace | | As of today, just over 14 percent of Minnesota kids aged 5 to 11 have received at least one dose of COVID-19 vaccine. | |
|
|
|
| That's just under 10 percent of this group in a week, a respectable pace. It's slightly slower than we saw among 12- to 15-year olds when they first became eligible, but faster than other age groups (though those earlier age groups faced supply constraints that aren't around any more). | |
|
|
|
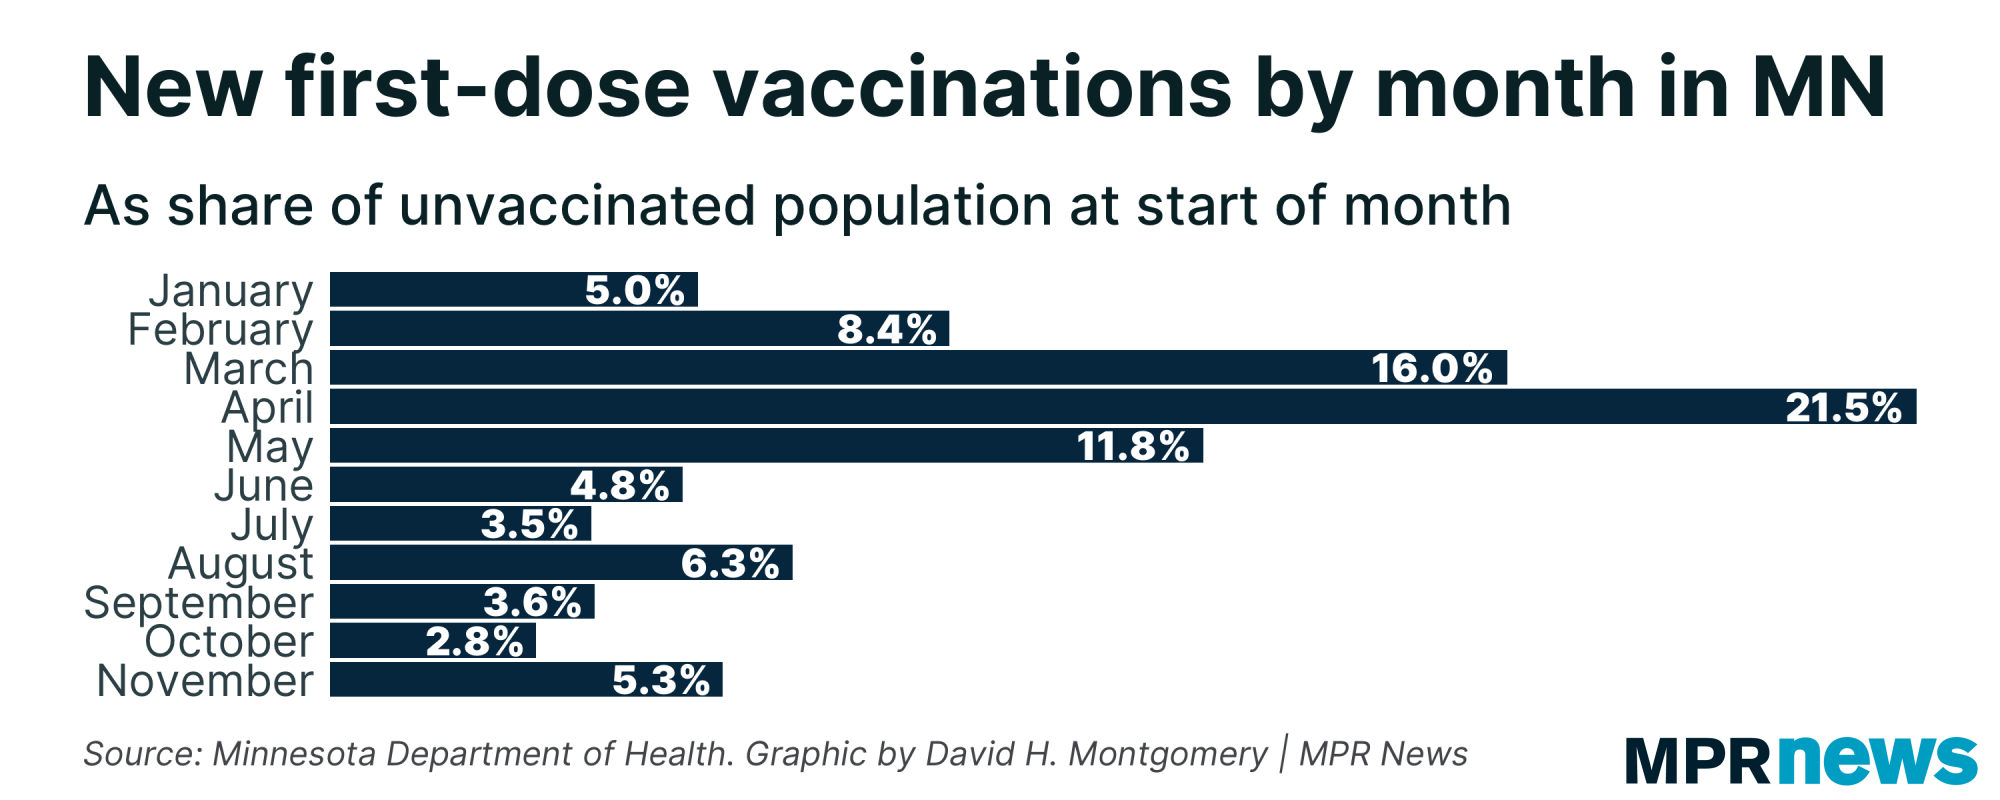
| Buoyed by the kids, Minnesota has seen more than 5.3 percent of its unvaccinated population get their first dose this month, with 11 days remaining. That's the highest rate since August (when 12- to 15-year-olds drove the increase) and a real chance of being the highest since May. | |
|
|
|
| (Note, of course, that the denominator of the unvaccinated population gets smaller with each passing month, meaning the same number of new shots represents a rising percentage here.) | | |
|
|
Deaths still up, especially outside nursing homes
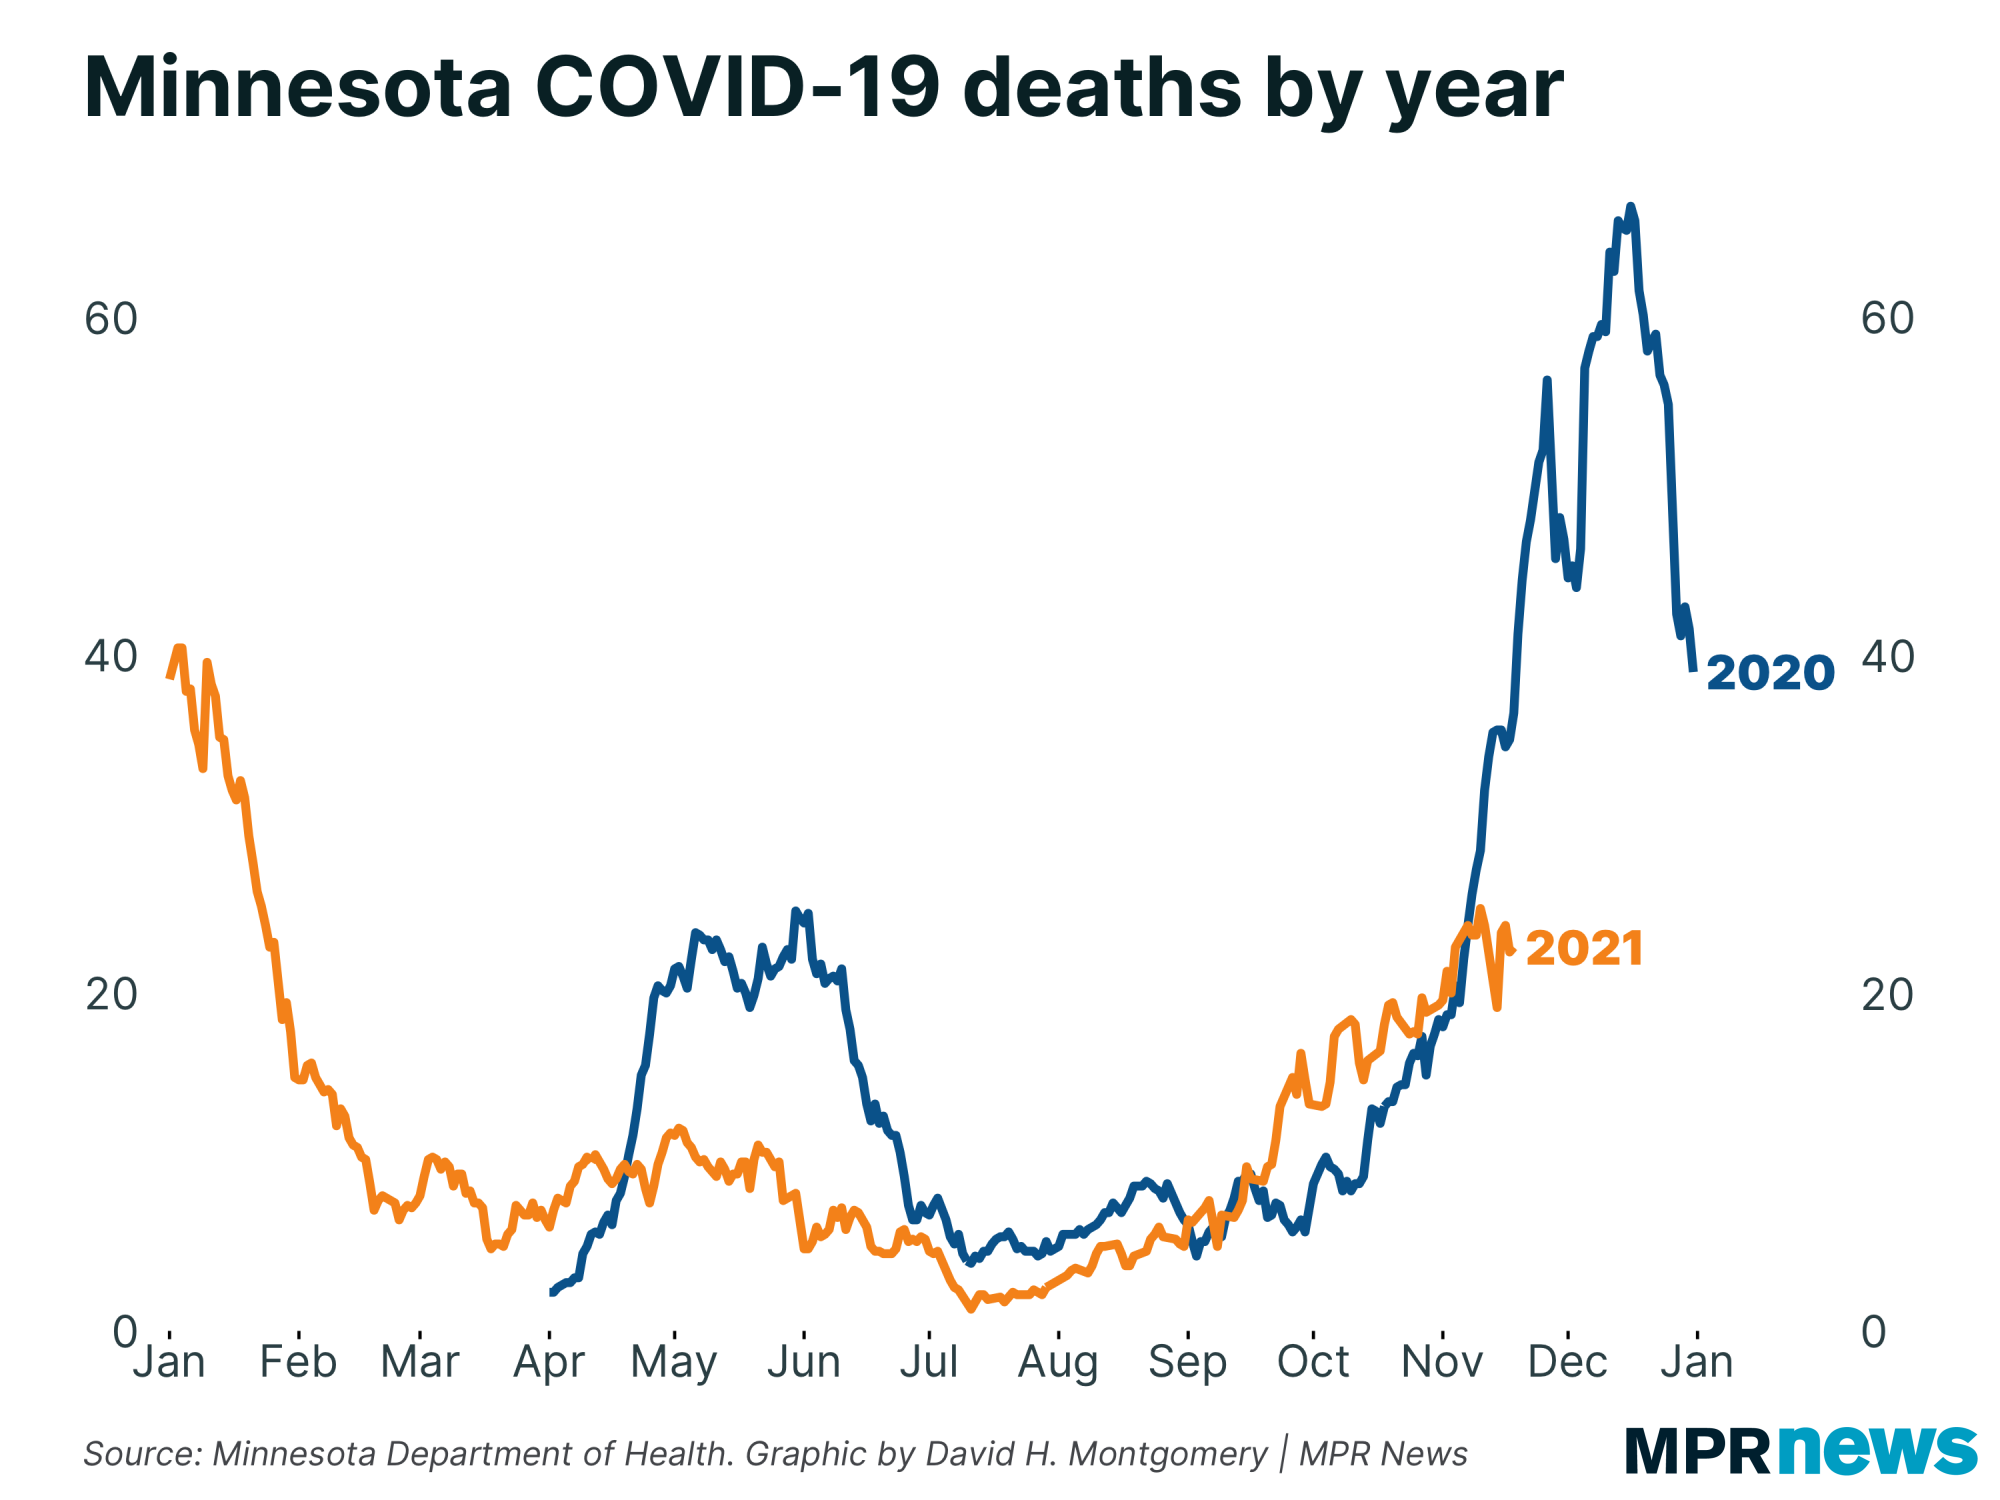
| Minnesota is currently averaging around 22 COVID-19 deaths per day, the highest rate since January.
This is on par with the death rate observed back in Spring 2020, but far below the Fall 2020 peak. |
| |
|
|
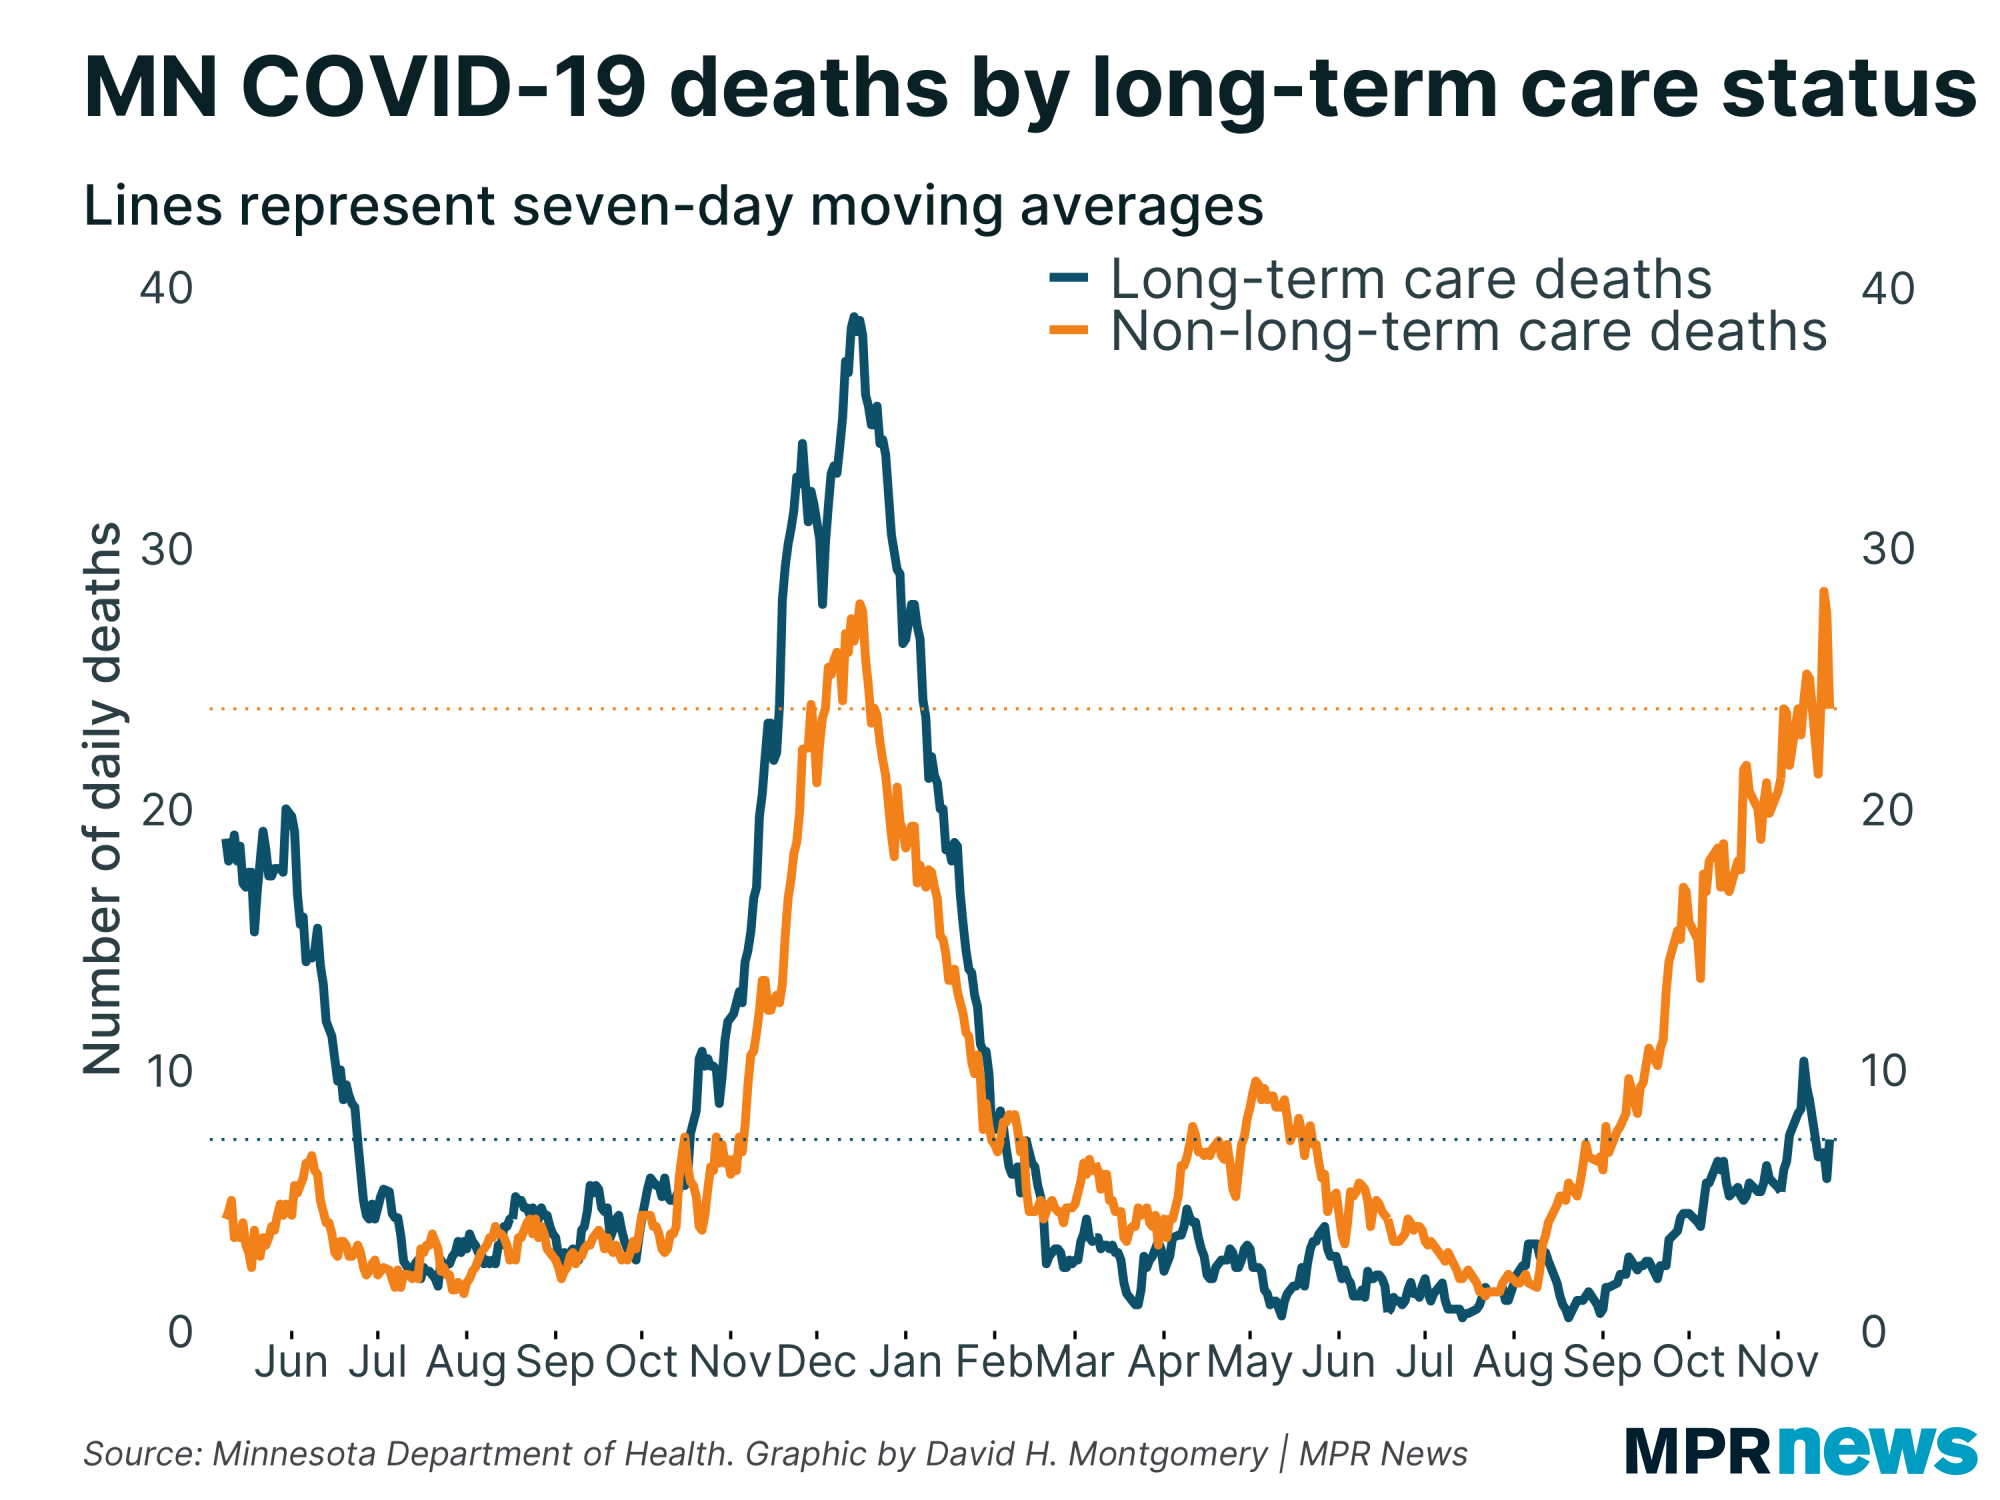
Under the hood, there's something interesting going on. Deaths in 2020 were concentrated among the vulnerable residents of long-term care facilities, who often accounted for an absolute majority of all COVID-19 deaths despite being a tiny fraction of the state's population.
Once the vaccination campaign got underway, however, COVID-19 deaths in this group plummeted. They've risen a bit lately, but never higher than one-quarter of the peak last fall.
But deaths for people outside of long-term care facilities are as high as they've ever been. Earlier this week, in fact, we set a new record for the number of non-long-term care deaths, even higher than the pre-vaccine Fall 2020 peak! That's stunning, and indicates the disease is still being extremely deadly in some populations — even if the most vulnerable population has been largely protected. |
| |
|
|
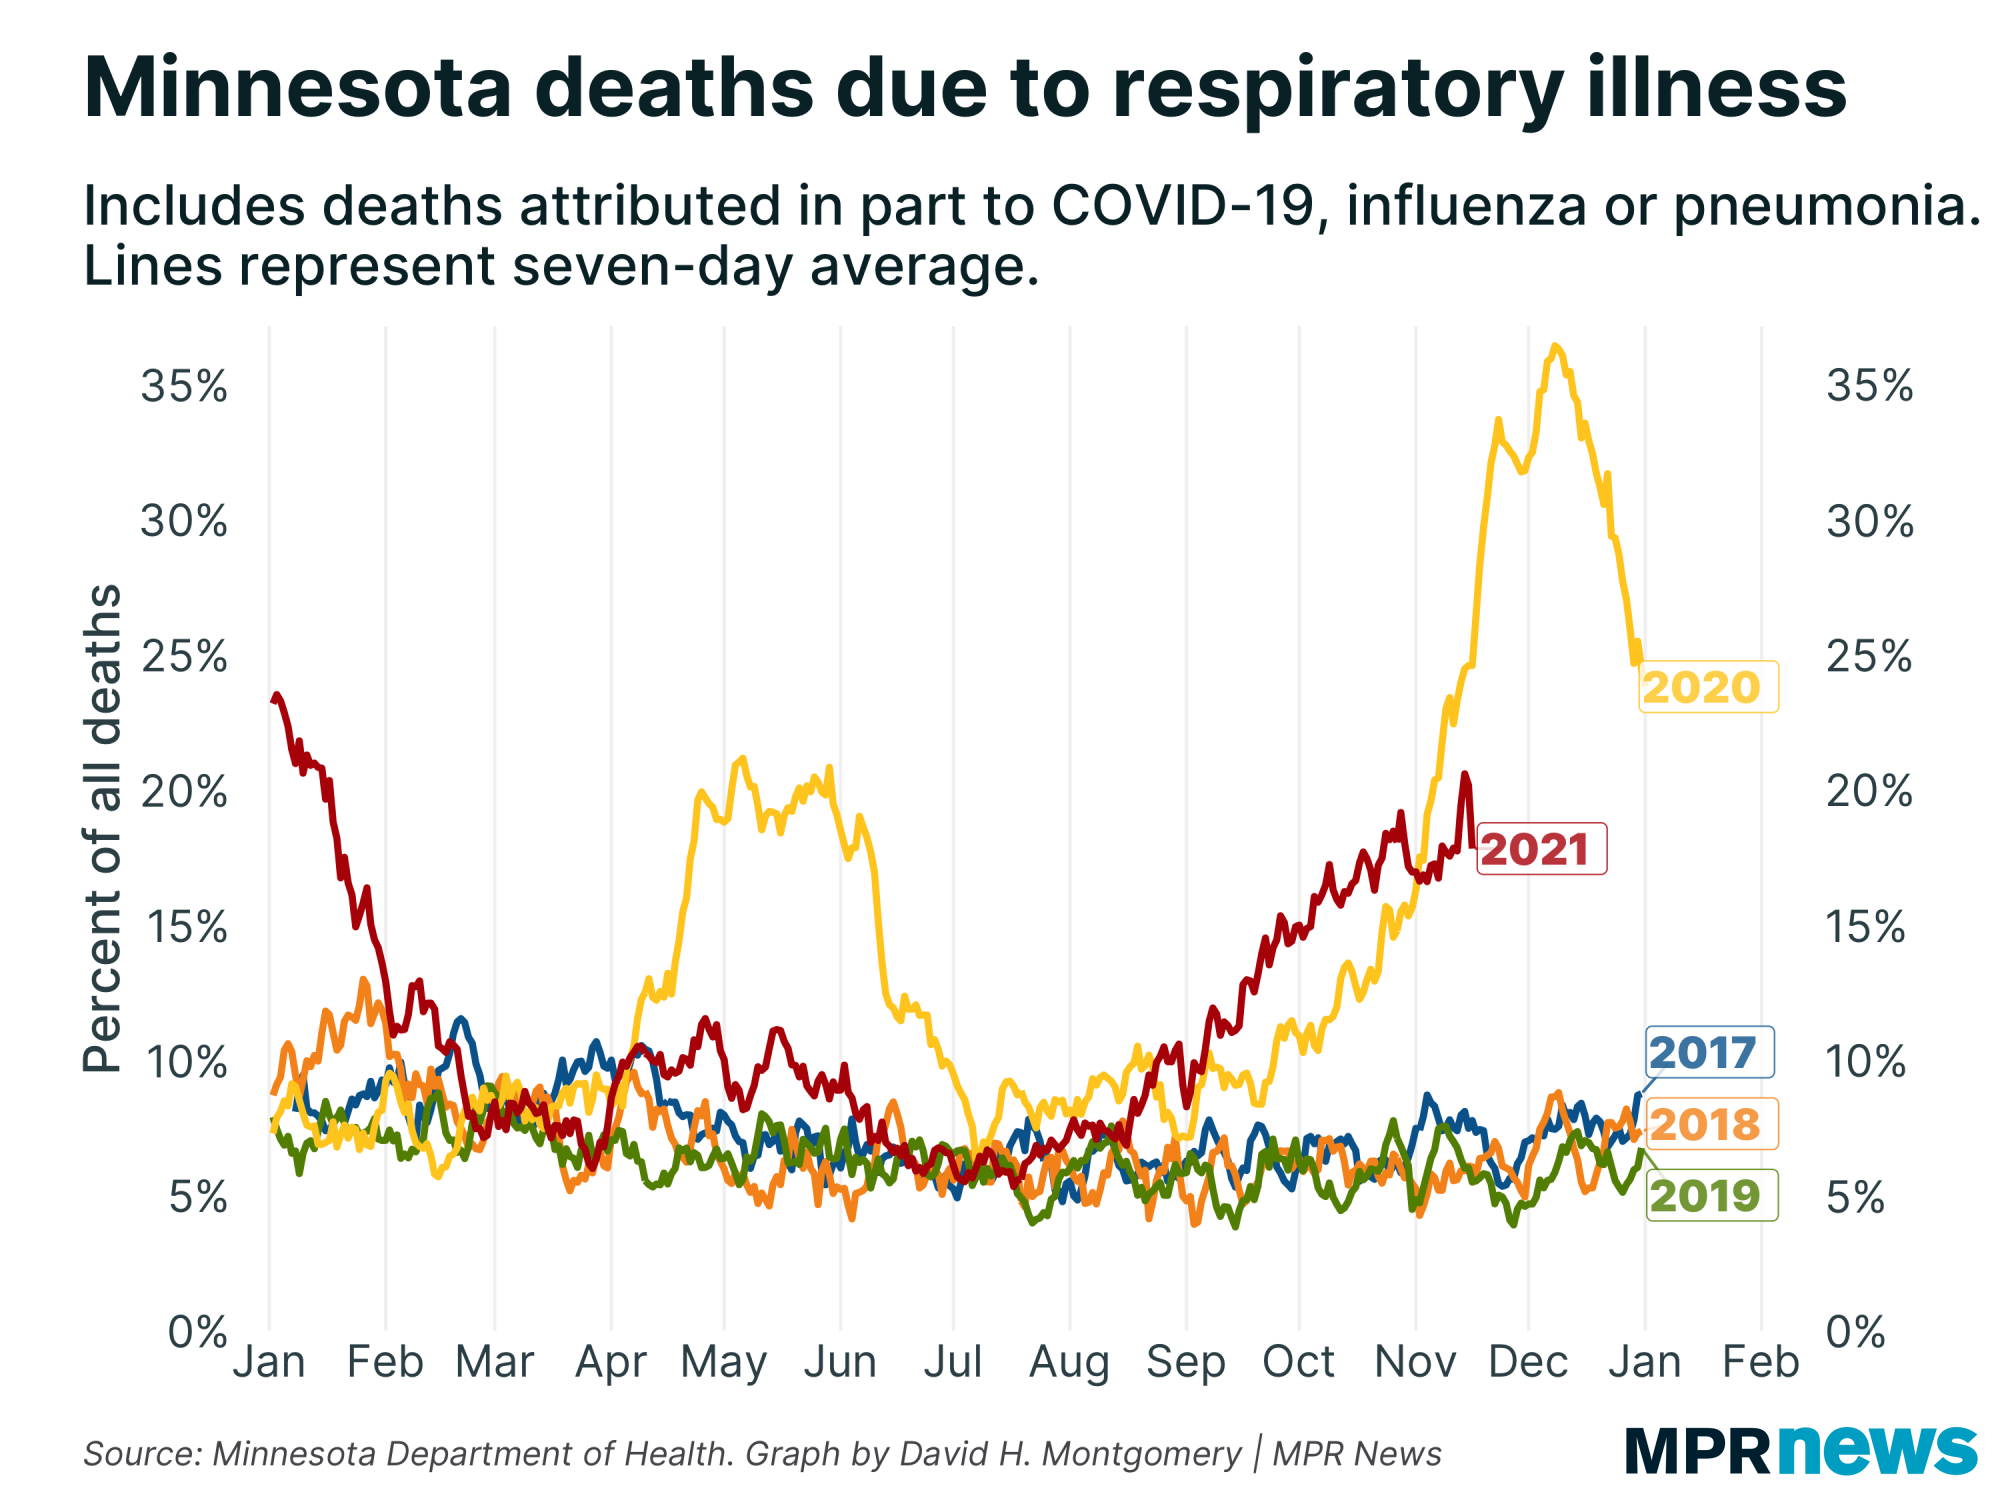
Zooming way out, at this time of year, around 5 to 8 percent of Minnesota's deaths are usually attributed to a respiratory disease of some sort.
Last fall, this spiked as high as 30 percent amid the deadly COVID-19 wave. We're not nearly that high now, but we're still at an elevated range of 17 percent or so — a higher share for respiratory illnesses than any non-COVID period in the last few years. |
| |
|
|
What's happening next?
|
A few big things happening next week.
First, we'll be watching to see if this week's slowdown continues, or if we get back to accelerating growth.
Second, I'm really hoping a trend becomes evident by Wednesday — because the Thanksgiving holiday is going to mess up our data for about two weeks. The combination of backlogged data and reduced testing on the holiday weekend will make it very hard to discern the signal in the noise. I'll do my best, of course, but it's going to be messy.
Third, Thanksgiving means I probably won't write a newsletter next week, unless circumstances or inspiration warrant it. Otherwise, I'll be back after the holiday with a check-in on how things are going.
Thanks for subscribing to this newsletter and for all of you who've sent me your feedback. As always, if you like this newsletter, please share it and the sign-up link with others who you think might enjoy it.
— David |
| |
|
|
Preference Center ❘ Unsubscribe You received this email because you subscribed or it was sent to you by a friend. This email was sent by: %%Member_Busname%%
%%Member_Addr%% %%Member_City%%, %%Member_State%%, %%Member_PostalCode%%
  |
|
|
| | |