| Welcome back to COVID in Minnesota TODAY, an email newsletter from MPR News about understanding the latest developments in Minnesota's COVID-19 outbreak. | | |
|
|
Minnesota's current COVID-19 wave is sort of like a roller coaster right now. We've been hauled upward for what seems like forever. Last week we finally went over the peak, and it seemed like we were in for a thrilling descent.
But instead, this week we've been banking hard around a curve — and we can't see whether the curve leads to a new plunge or back up another hill.
We know that eventually we'll get back down to ground level. All rides end eventually. But we're stuck on here until the end. And it's a really rickety, uncomfortable ride that sometimes kills people? Anyway, this metaphor has been stretched too far already. Let's get to the stats. |
| |
|
|
Three things to know
| - Minnesota hit a peak in its COVID-19 outbreak last week — but the recovery stalled out this week
- We don't know whether we'll resume declining cases next week, stay plateaued, or even see another surge
- Just over 500,000 Minnesota kids 5 to 11 are about to become eligible for the COVID-19 vaccine. But this seems likely to only have a fairly modest impact on Minnesota's overall vaccination rate in the next month
|
| |
|
|
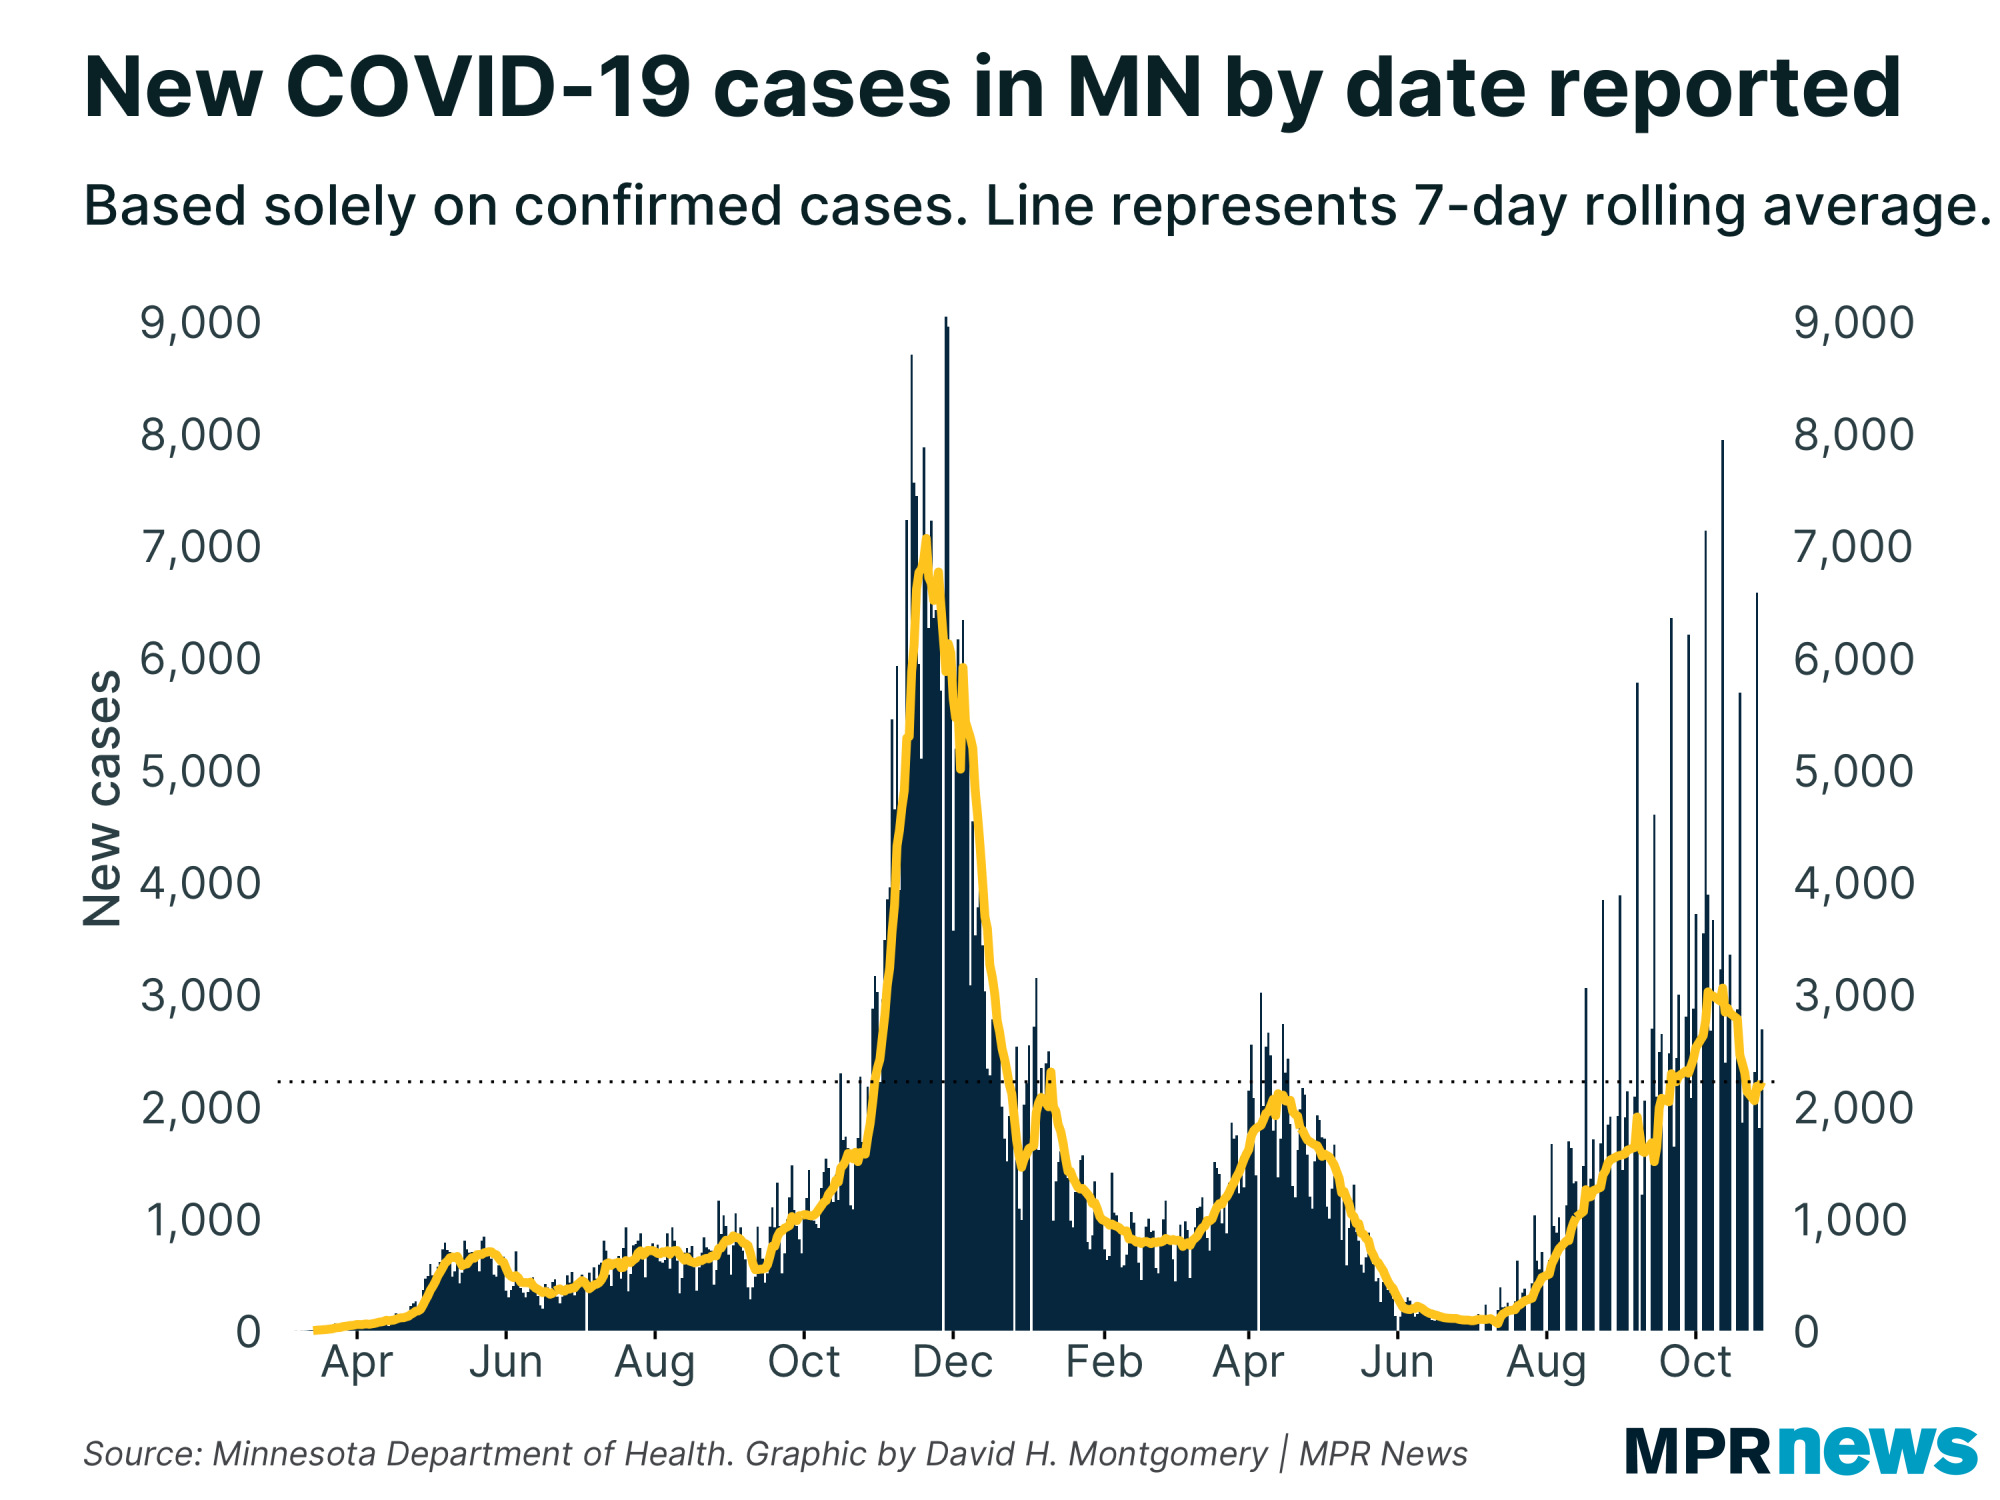
| Over the past week, Minnesota has averaged just over 2,200 newly confirmed COVID-19 cases per day. That's much less than the 3,000 or so per day we were averaging a few weeks ago, and comparable to where we were in late September. But it's a little higher than where we were at the end of last week. | |
|
|
|
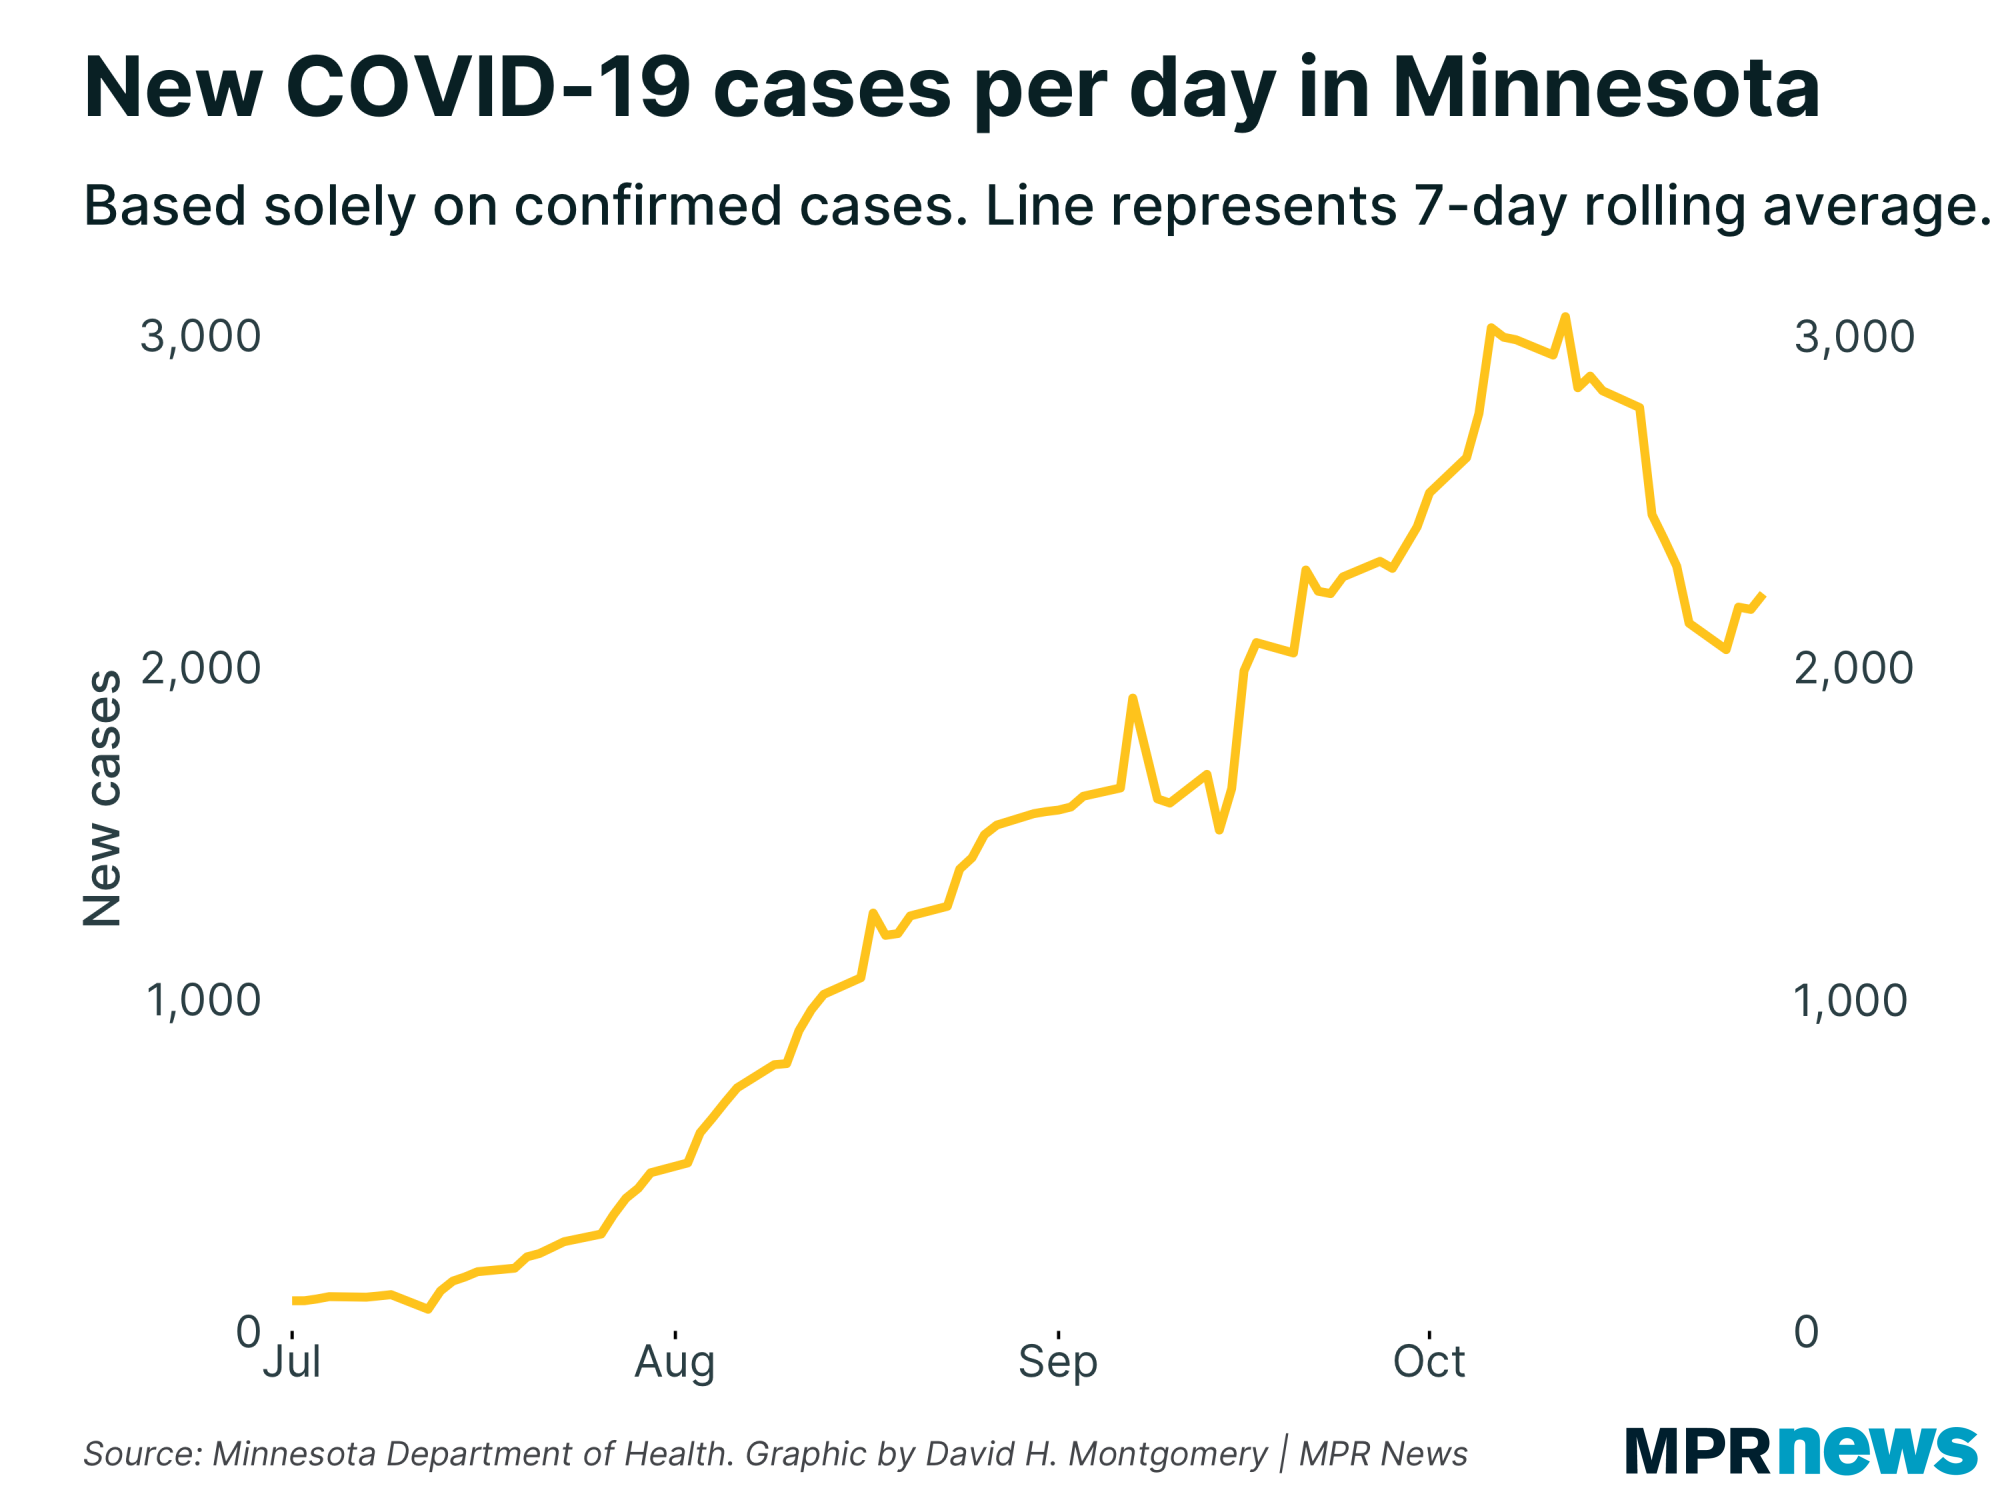
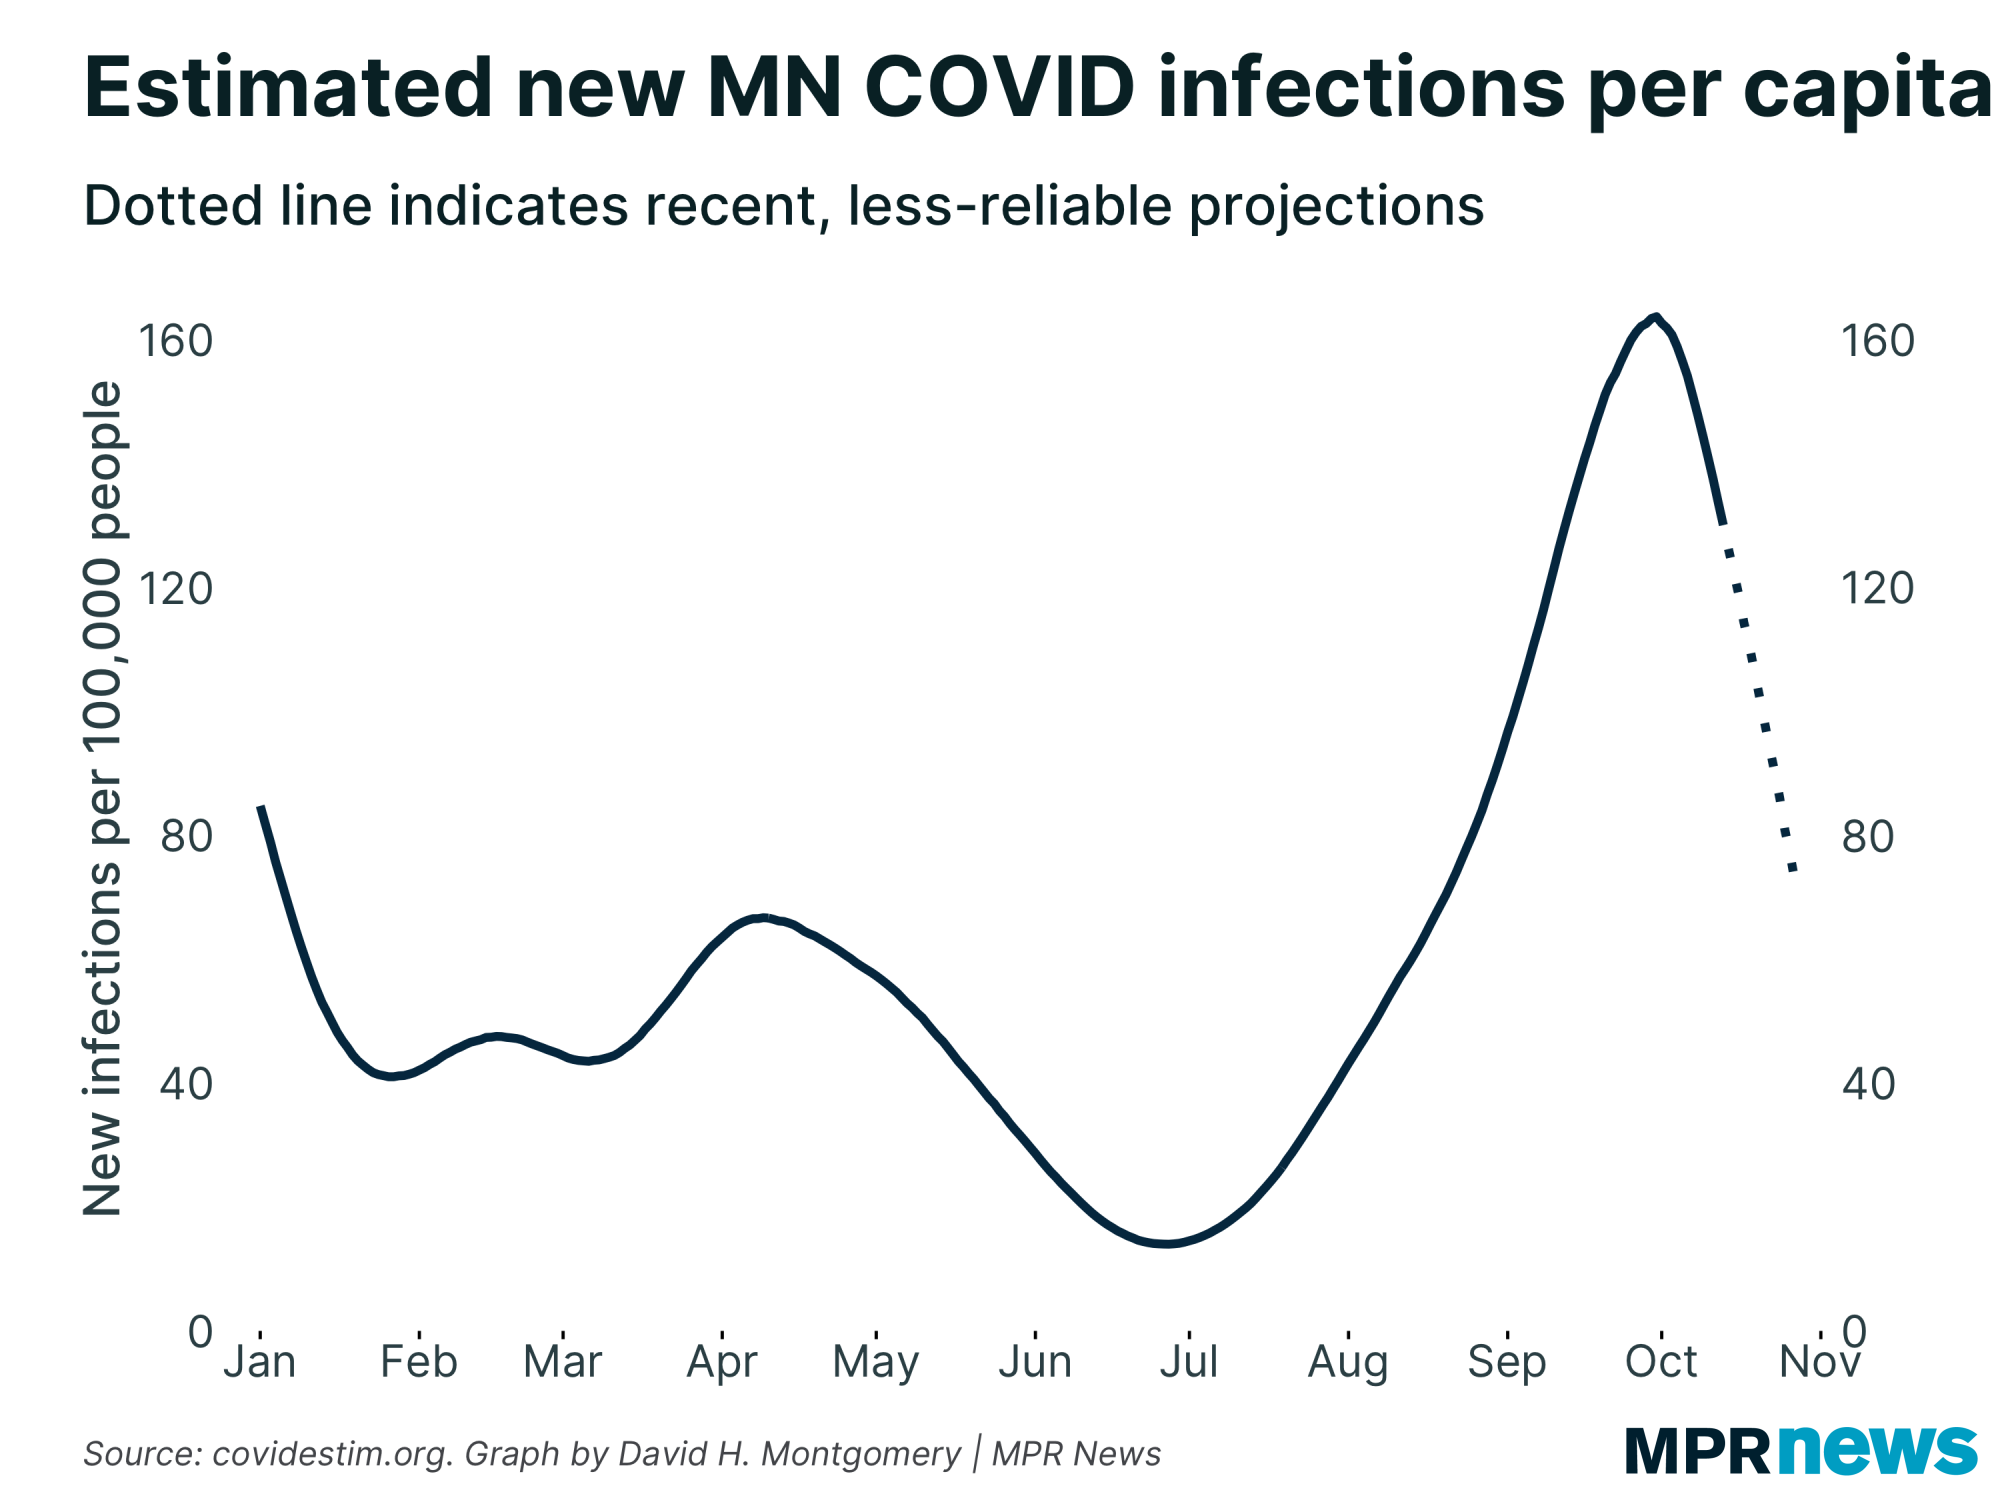
Here's a little bit of a clearer look, zooming in and getting rid of the messy daily data. The descent from the peak we experienced last week was truly thrilling, and had us on a pace to get back down to this summer's minuscule case levels by Thanksgiving — if everything had continued.
Unfortunately, this week things did not continue. | |
|
|
|
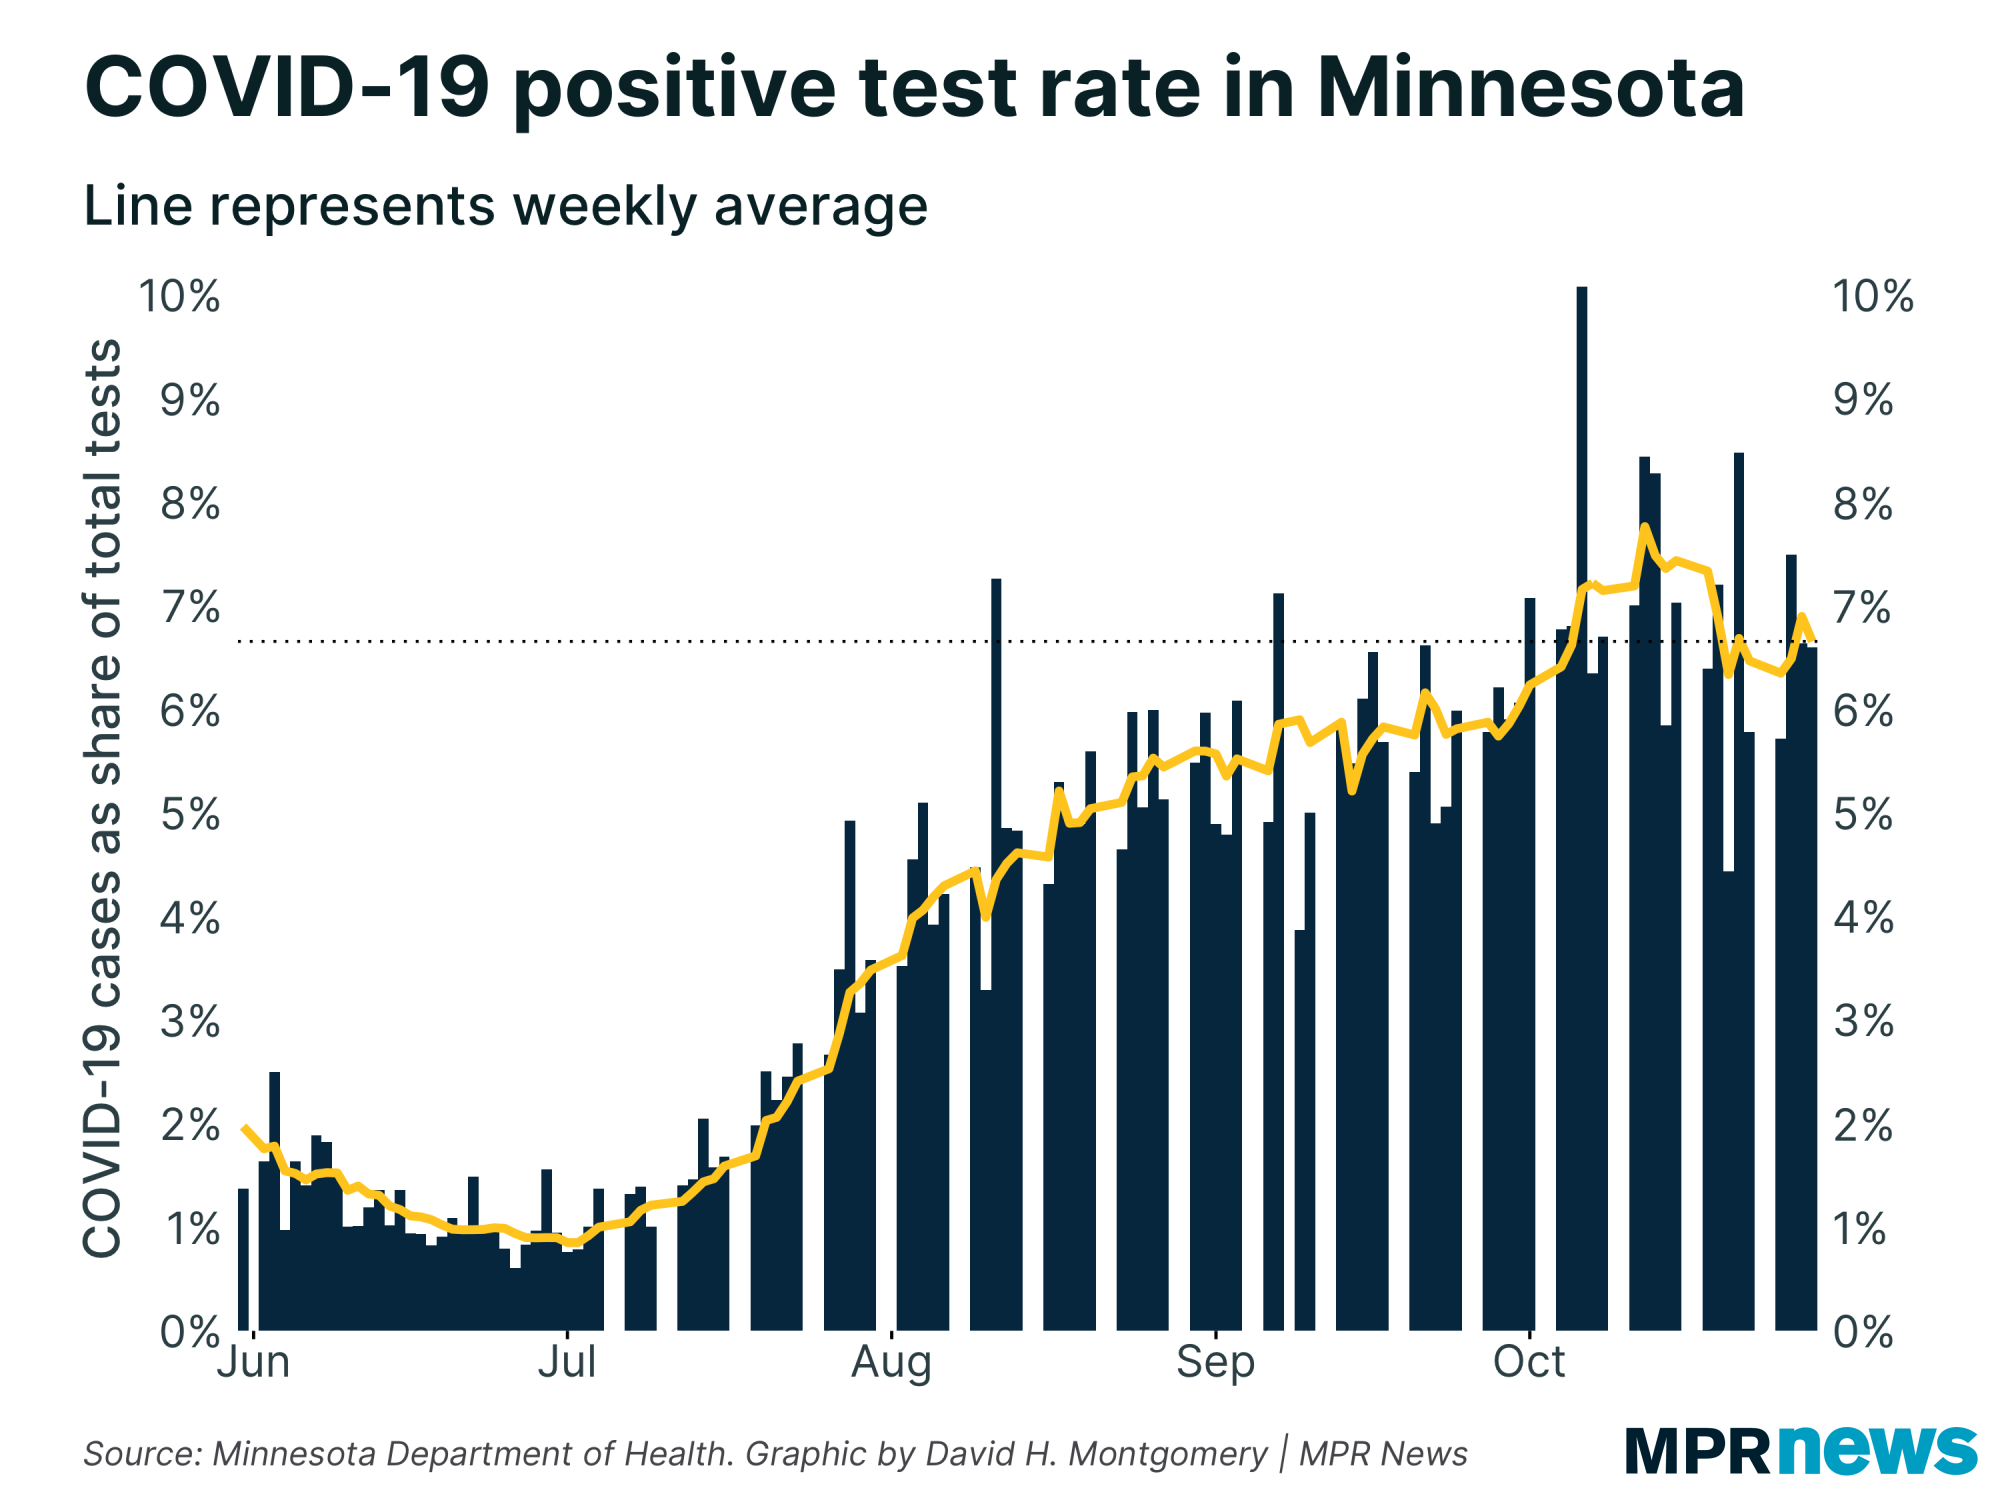
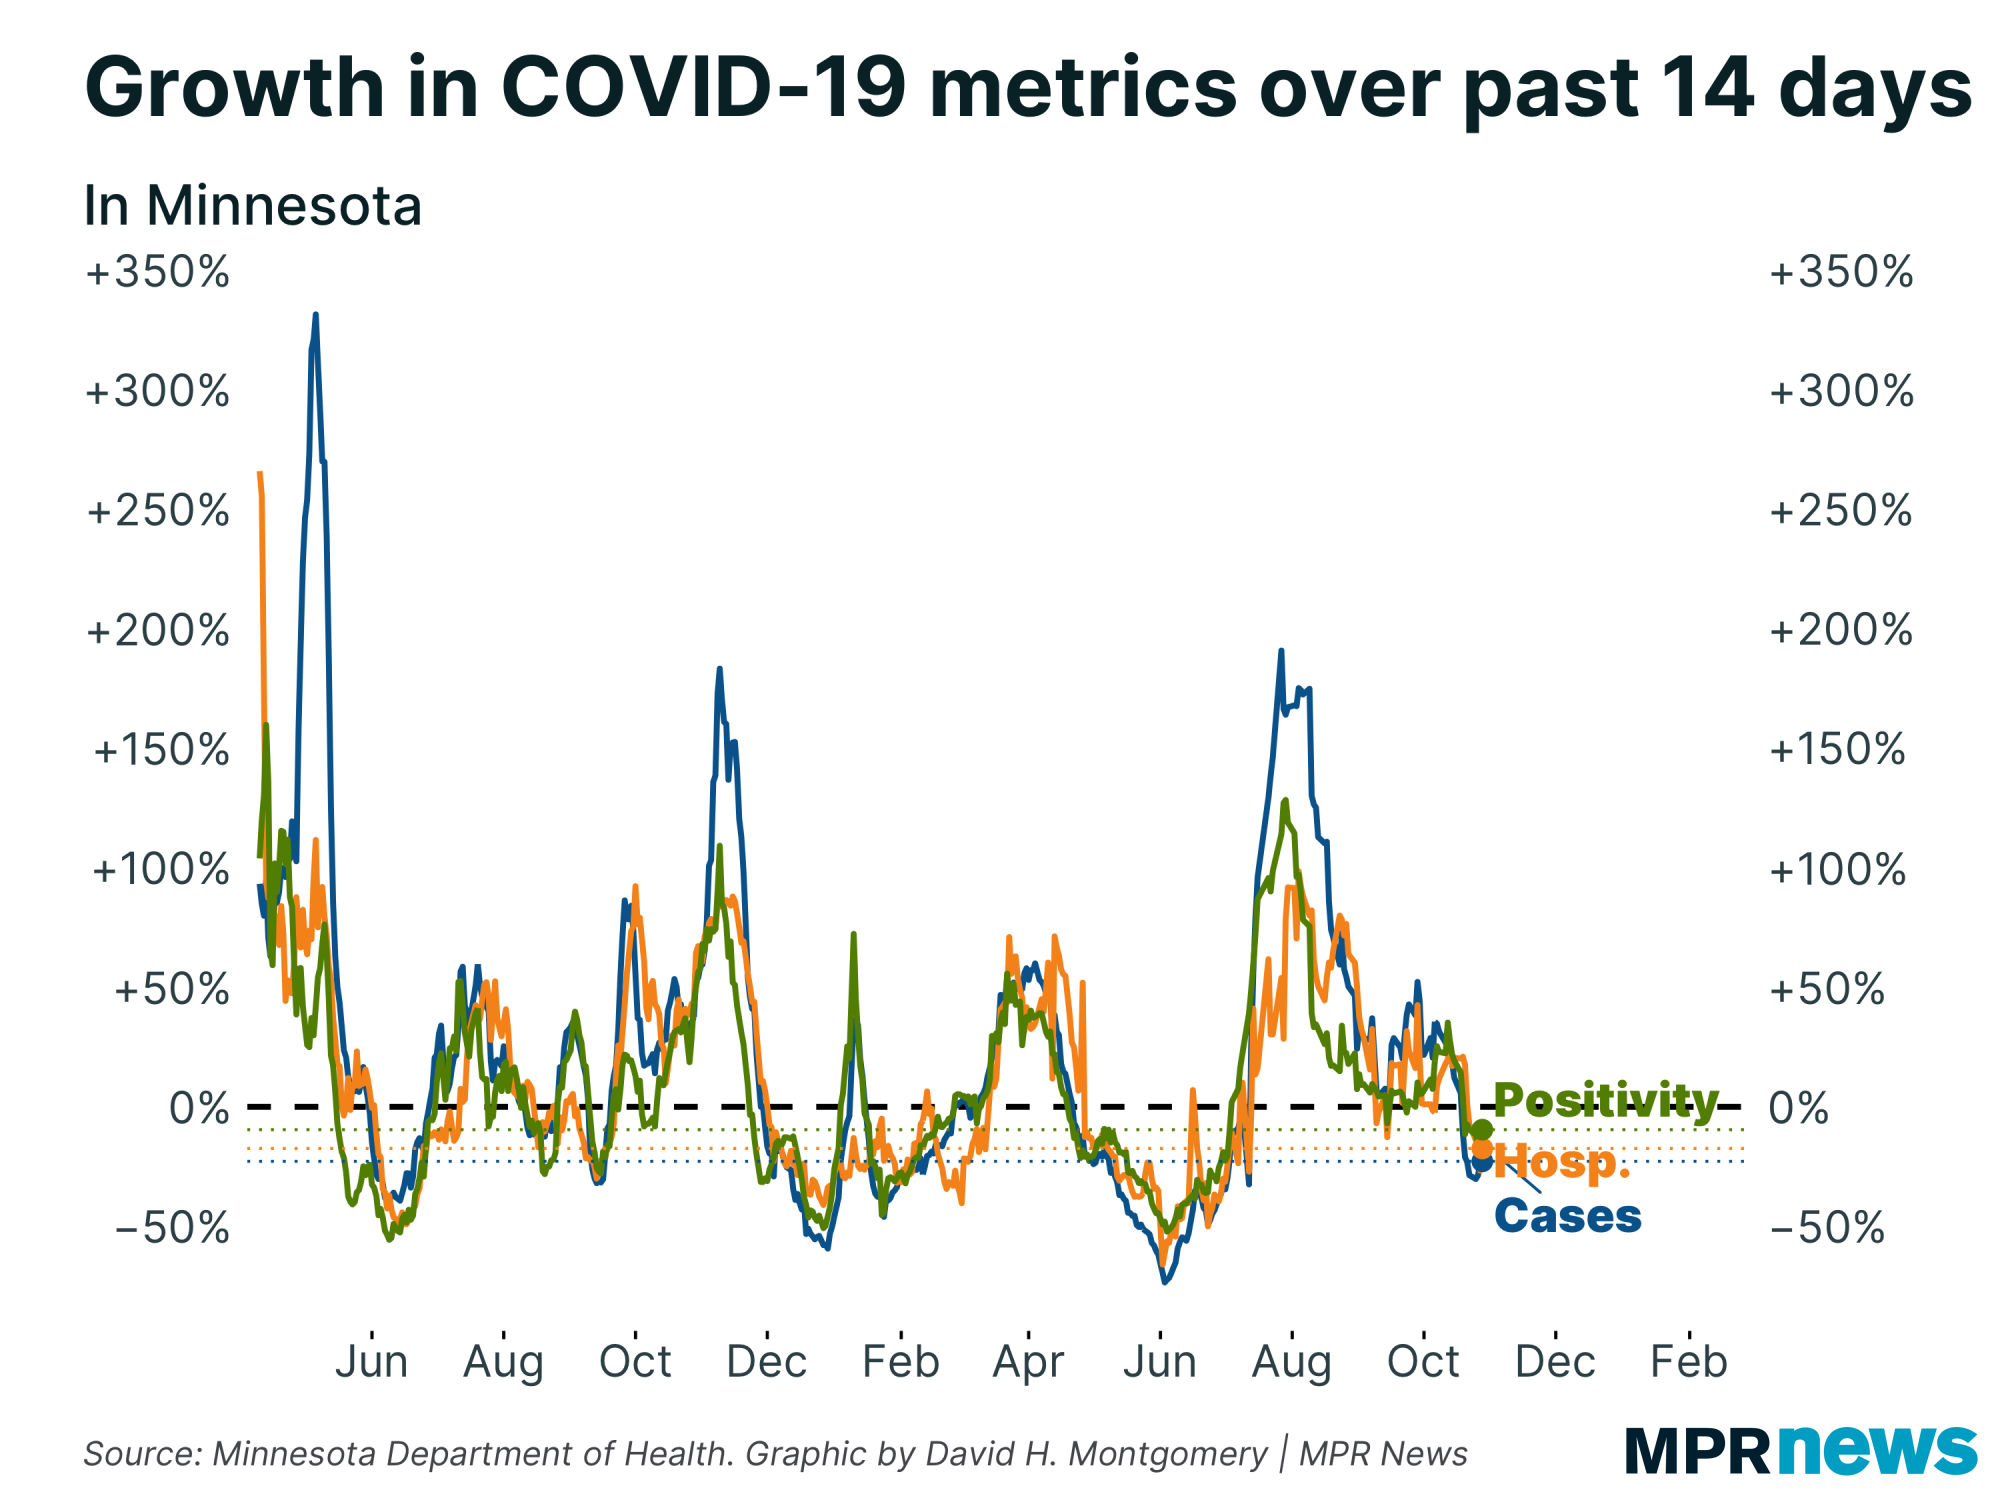
| This is not, I should add, an artifact of testing volume. Positivity rate has also hit the brakes after falling last week. | | |
|
|
You might note that the magnitude of the drop here is less drastic than we saw in raw reported cases. That's because at least some of the fall in cases coincided with a fall in testing volume.
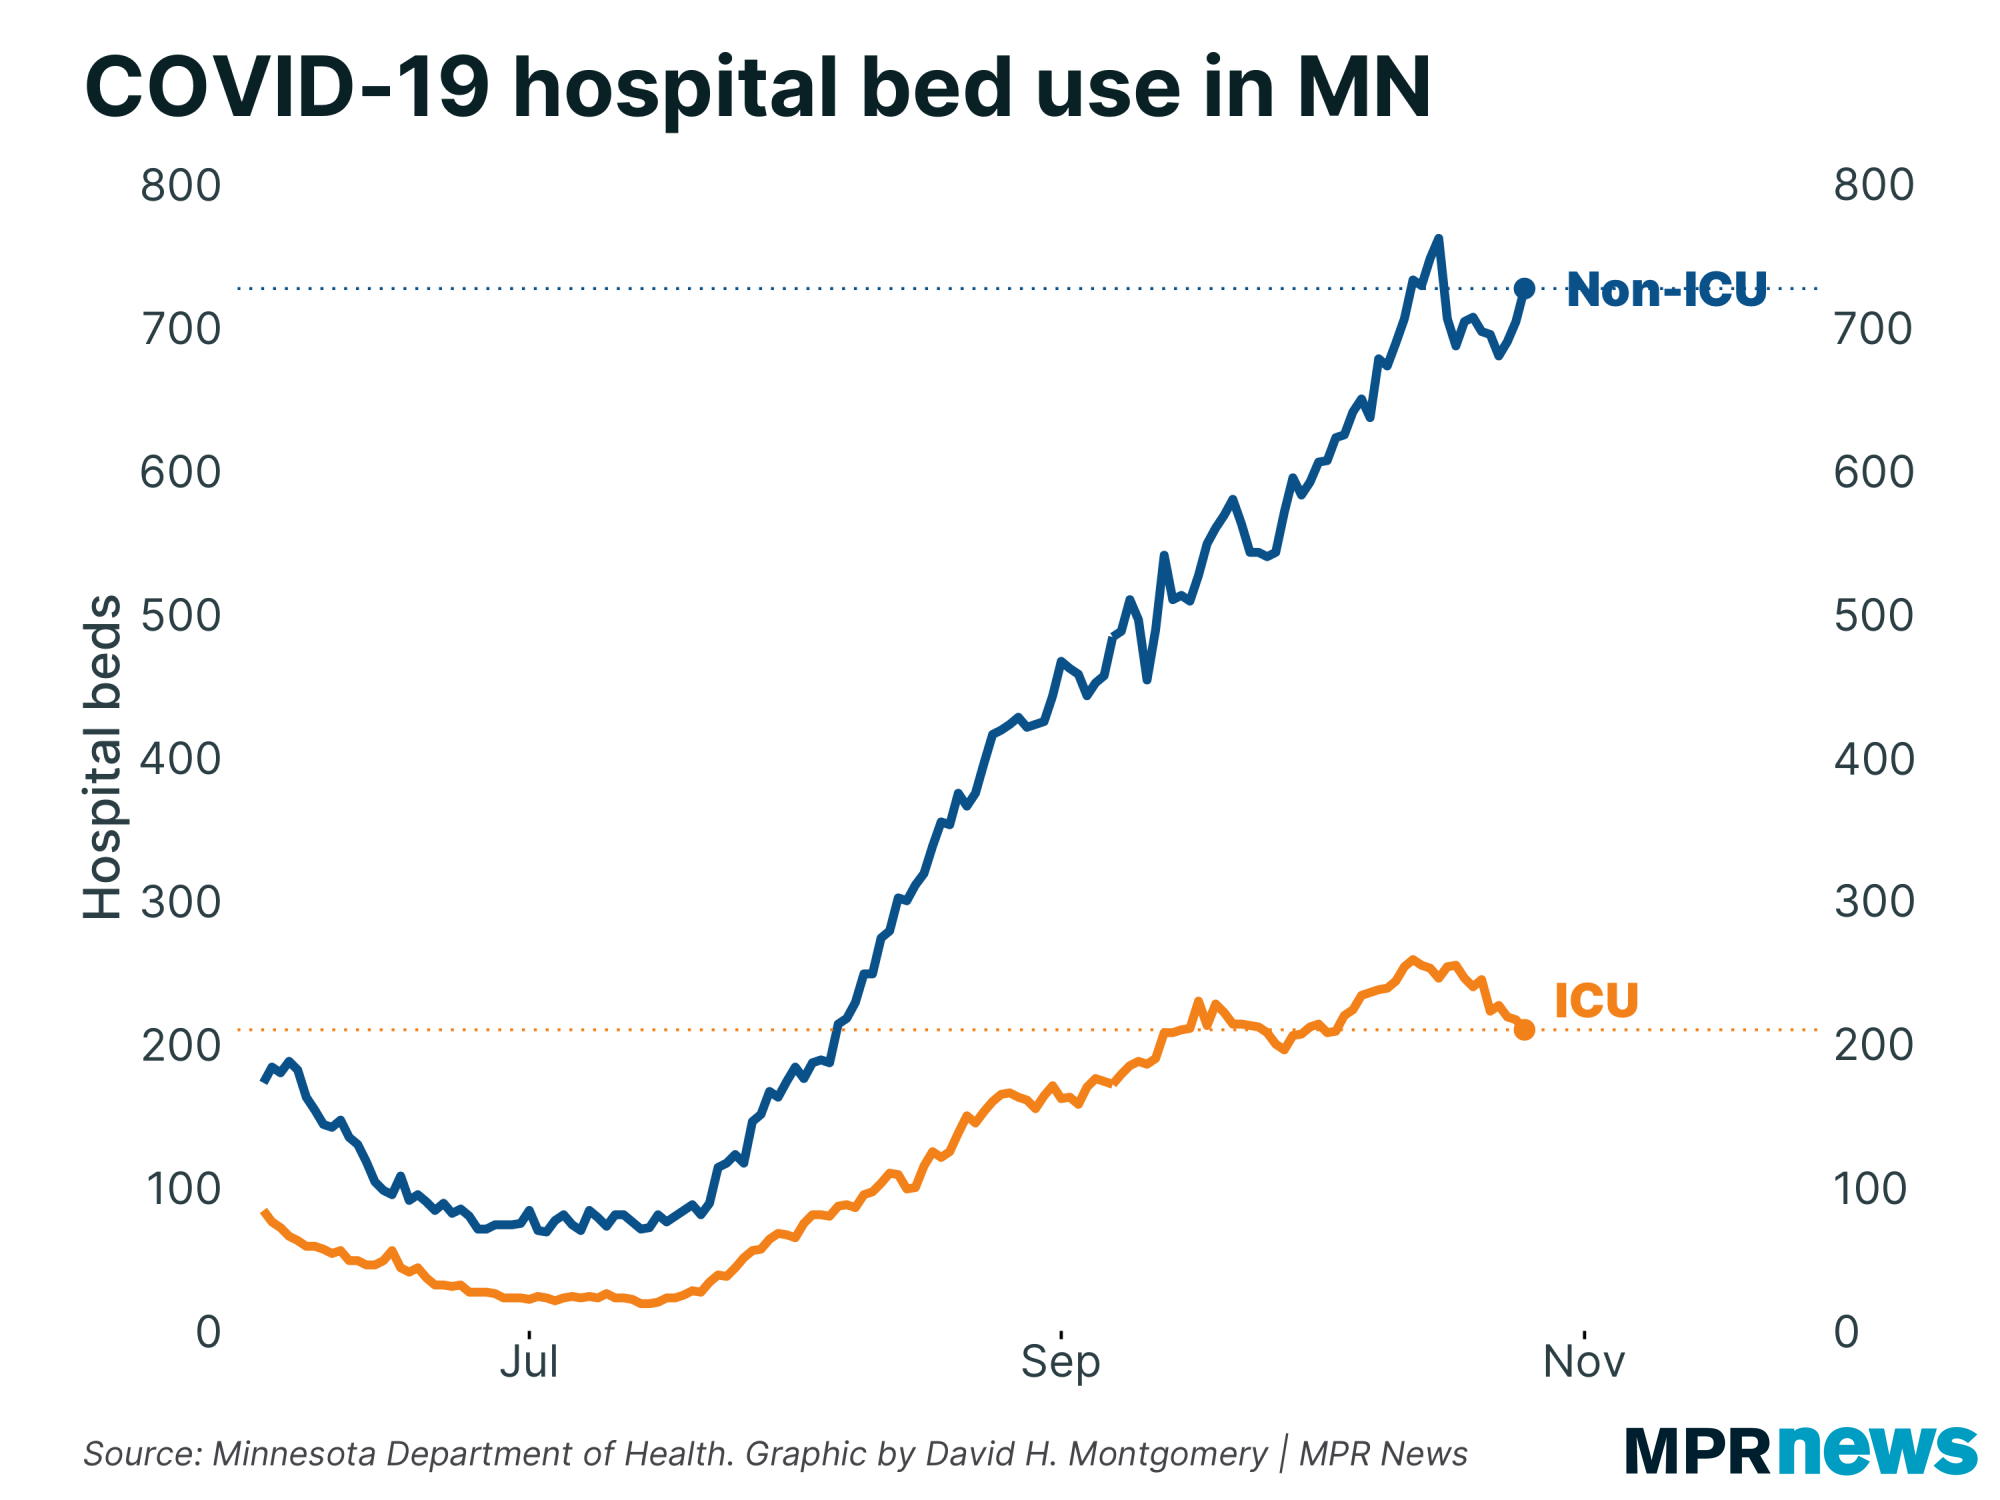
Even hospitalizations are following the same pattern — a drop last week followed by a minor uptick. | |
|
|
|
Forming a concrete judgment about all this is tricky.
It was good when we were sharply falling last week, and bad that we are no longer doing that.
We're better off than we were two weeks ago, but (slightly) worse than we were one week ago. | |
|
|
|
It's possible that we'll look back on this period in a few weeks and recognize that this was just a minor speed bump in the midst of a sustained, weeks-long downturn in cases.
Or we could look back and see it as the beginning of a new plateau, or even a brand new surge. We're just banking around a curve with no idea what's going to happen next.
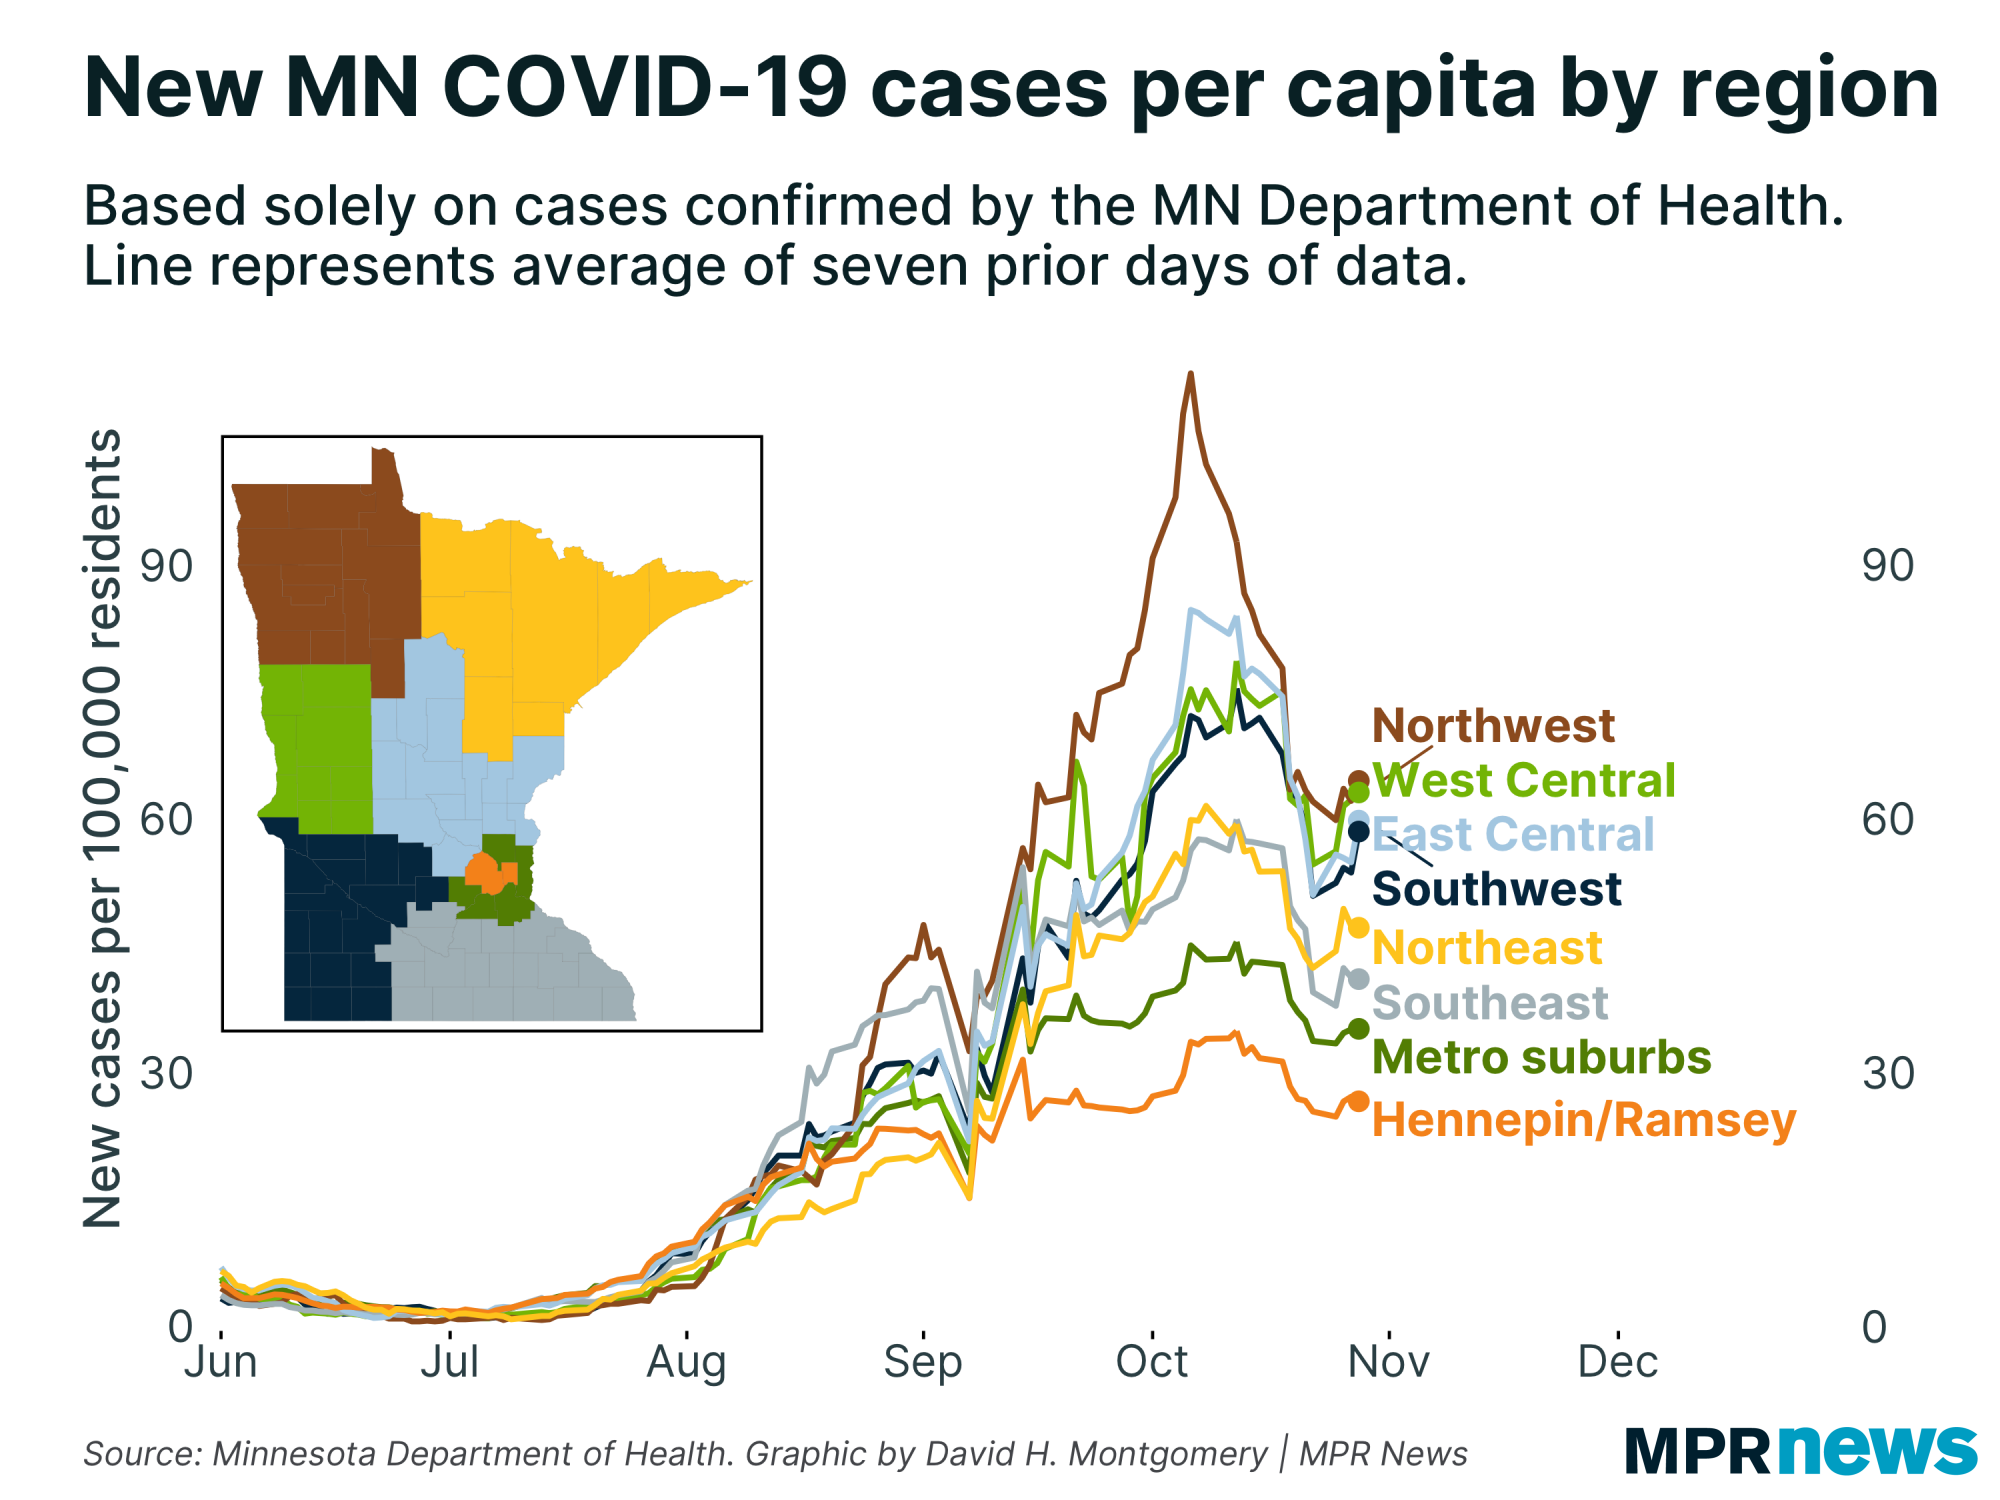
Looking under the hood, Minnesota's recent plunge in cases was most pronounced in the state's hardest-hit region, the northwest. But cases fell everywhere, until this week, when they bounced up everywhere. (But note that some of the uptick we see here this week is artificial, the result of some backlogged cases released on Monday. When these filter out of the seven-day averages this coming Monday, we'll see a similar artificial drop.) |
| |
|
|
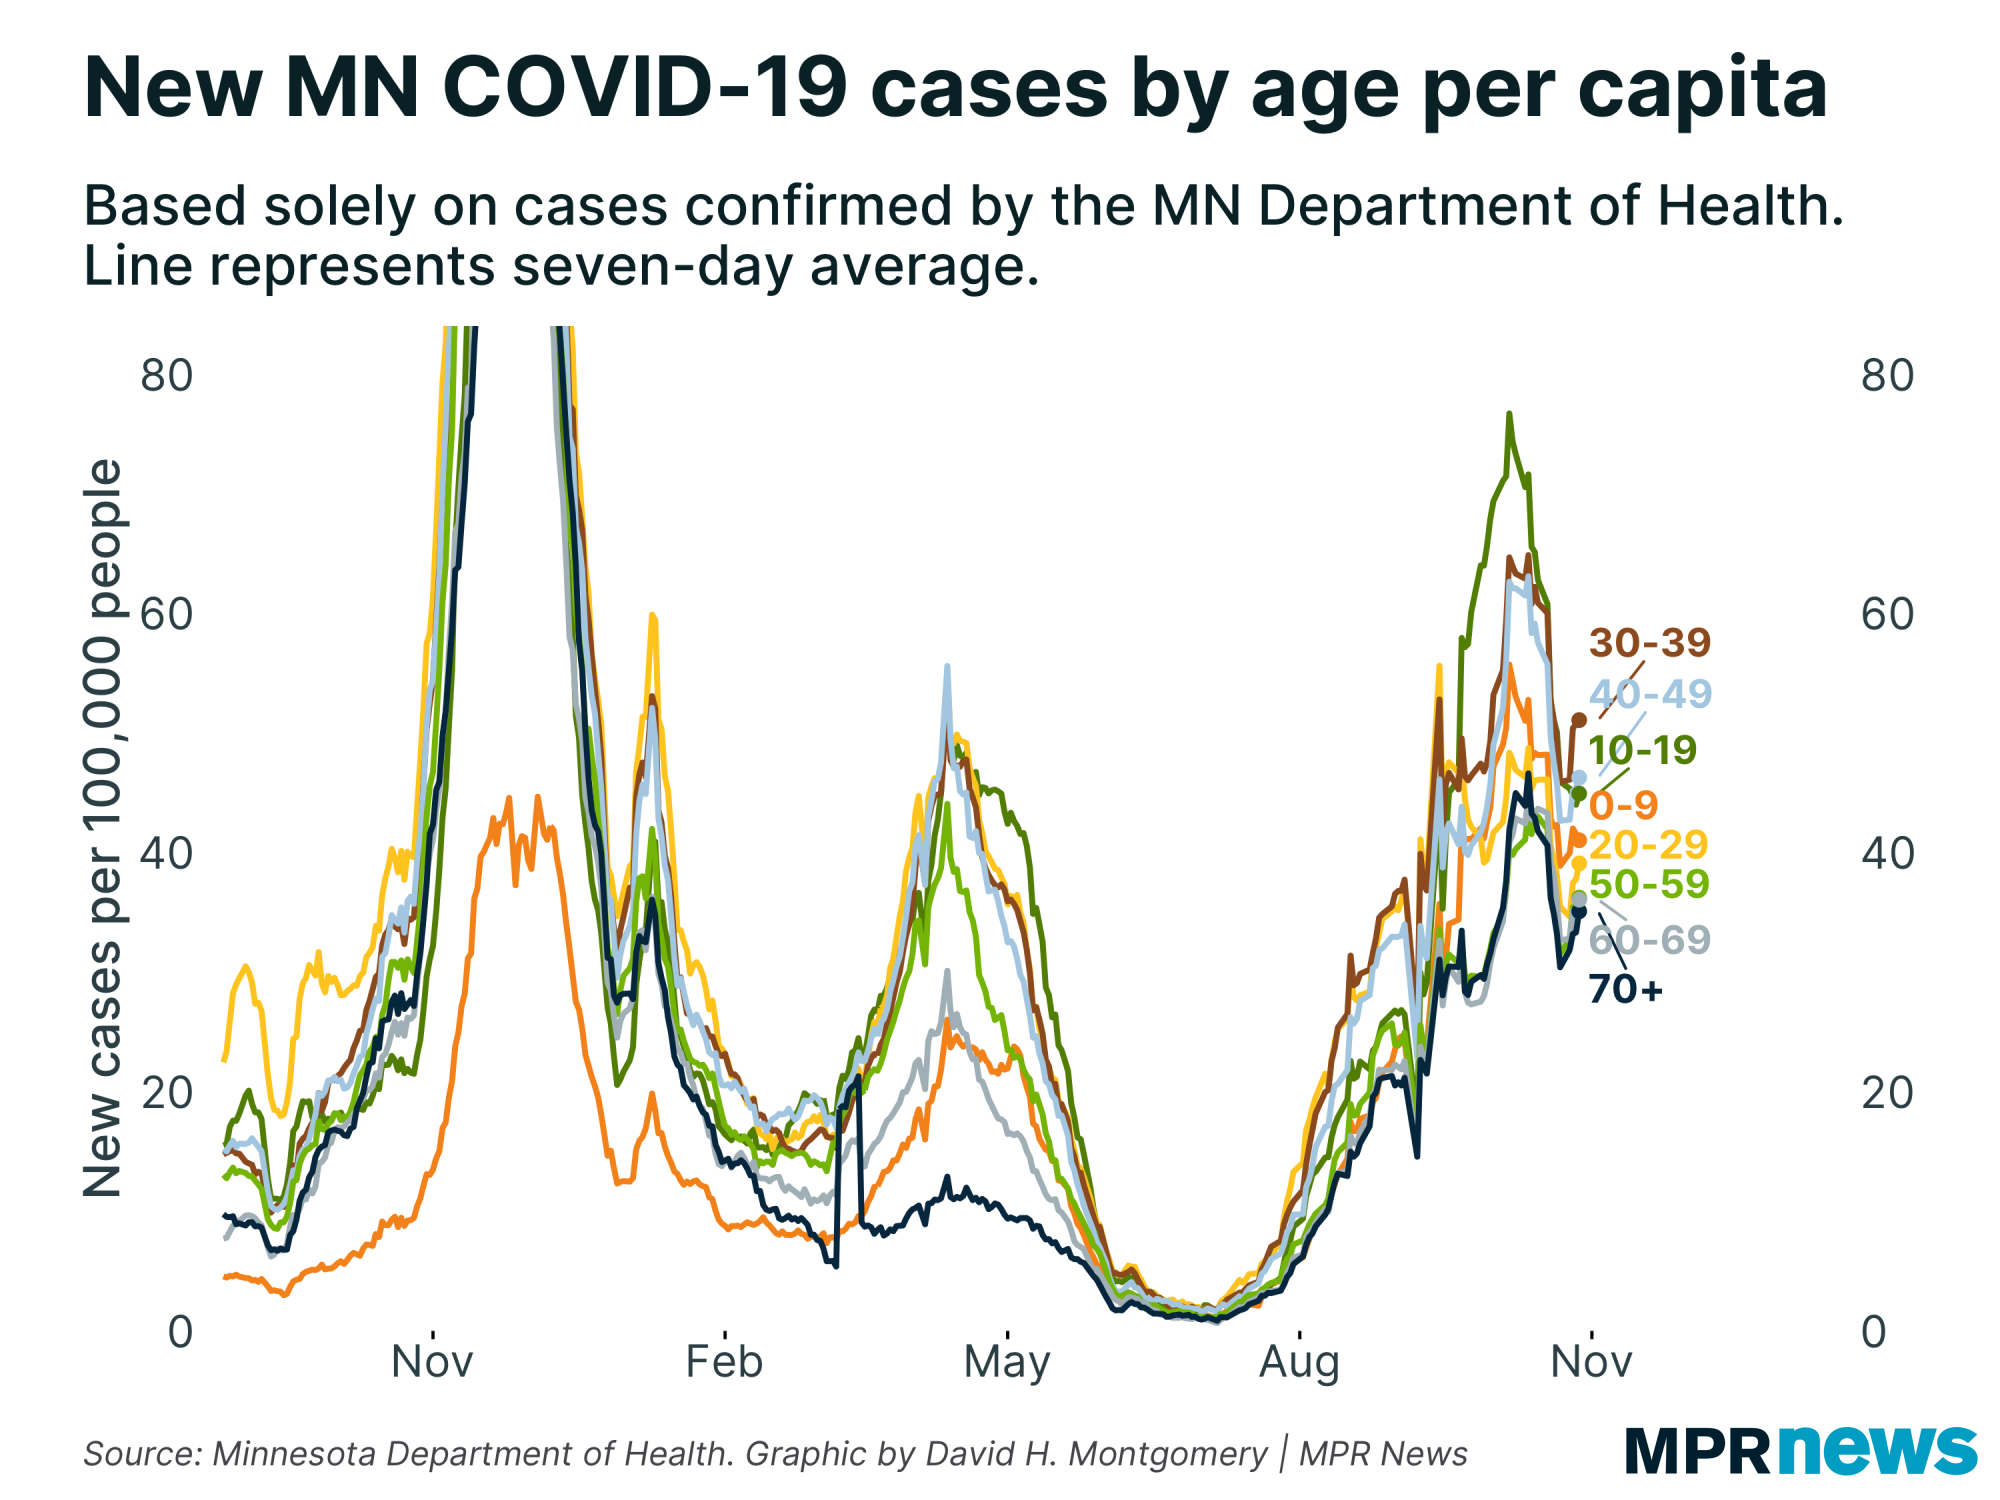
| It was a similar story for age. The steepest declines last week came in the 10- to 19-year-old age group that had driven the most recent surge. But now most groups are ticking back upwards again. | | |
|
|
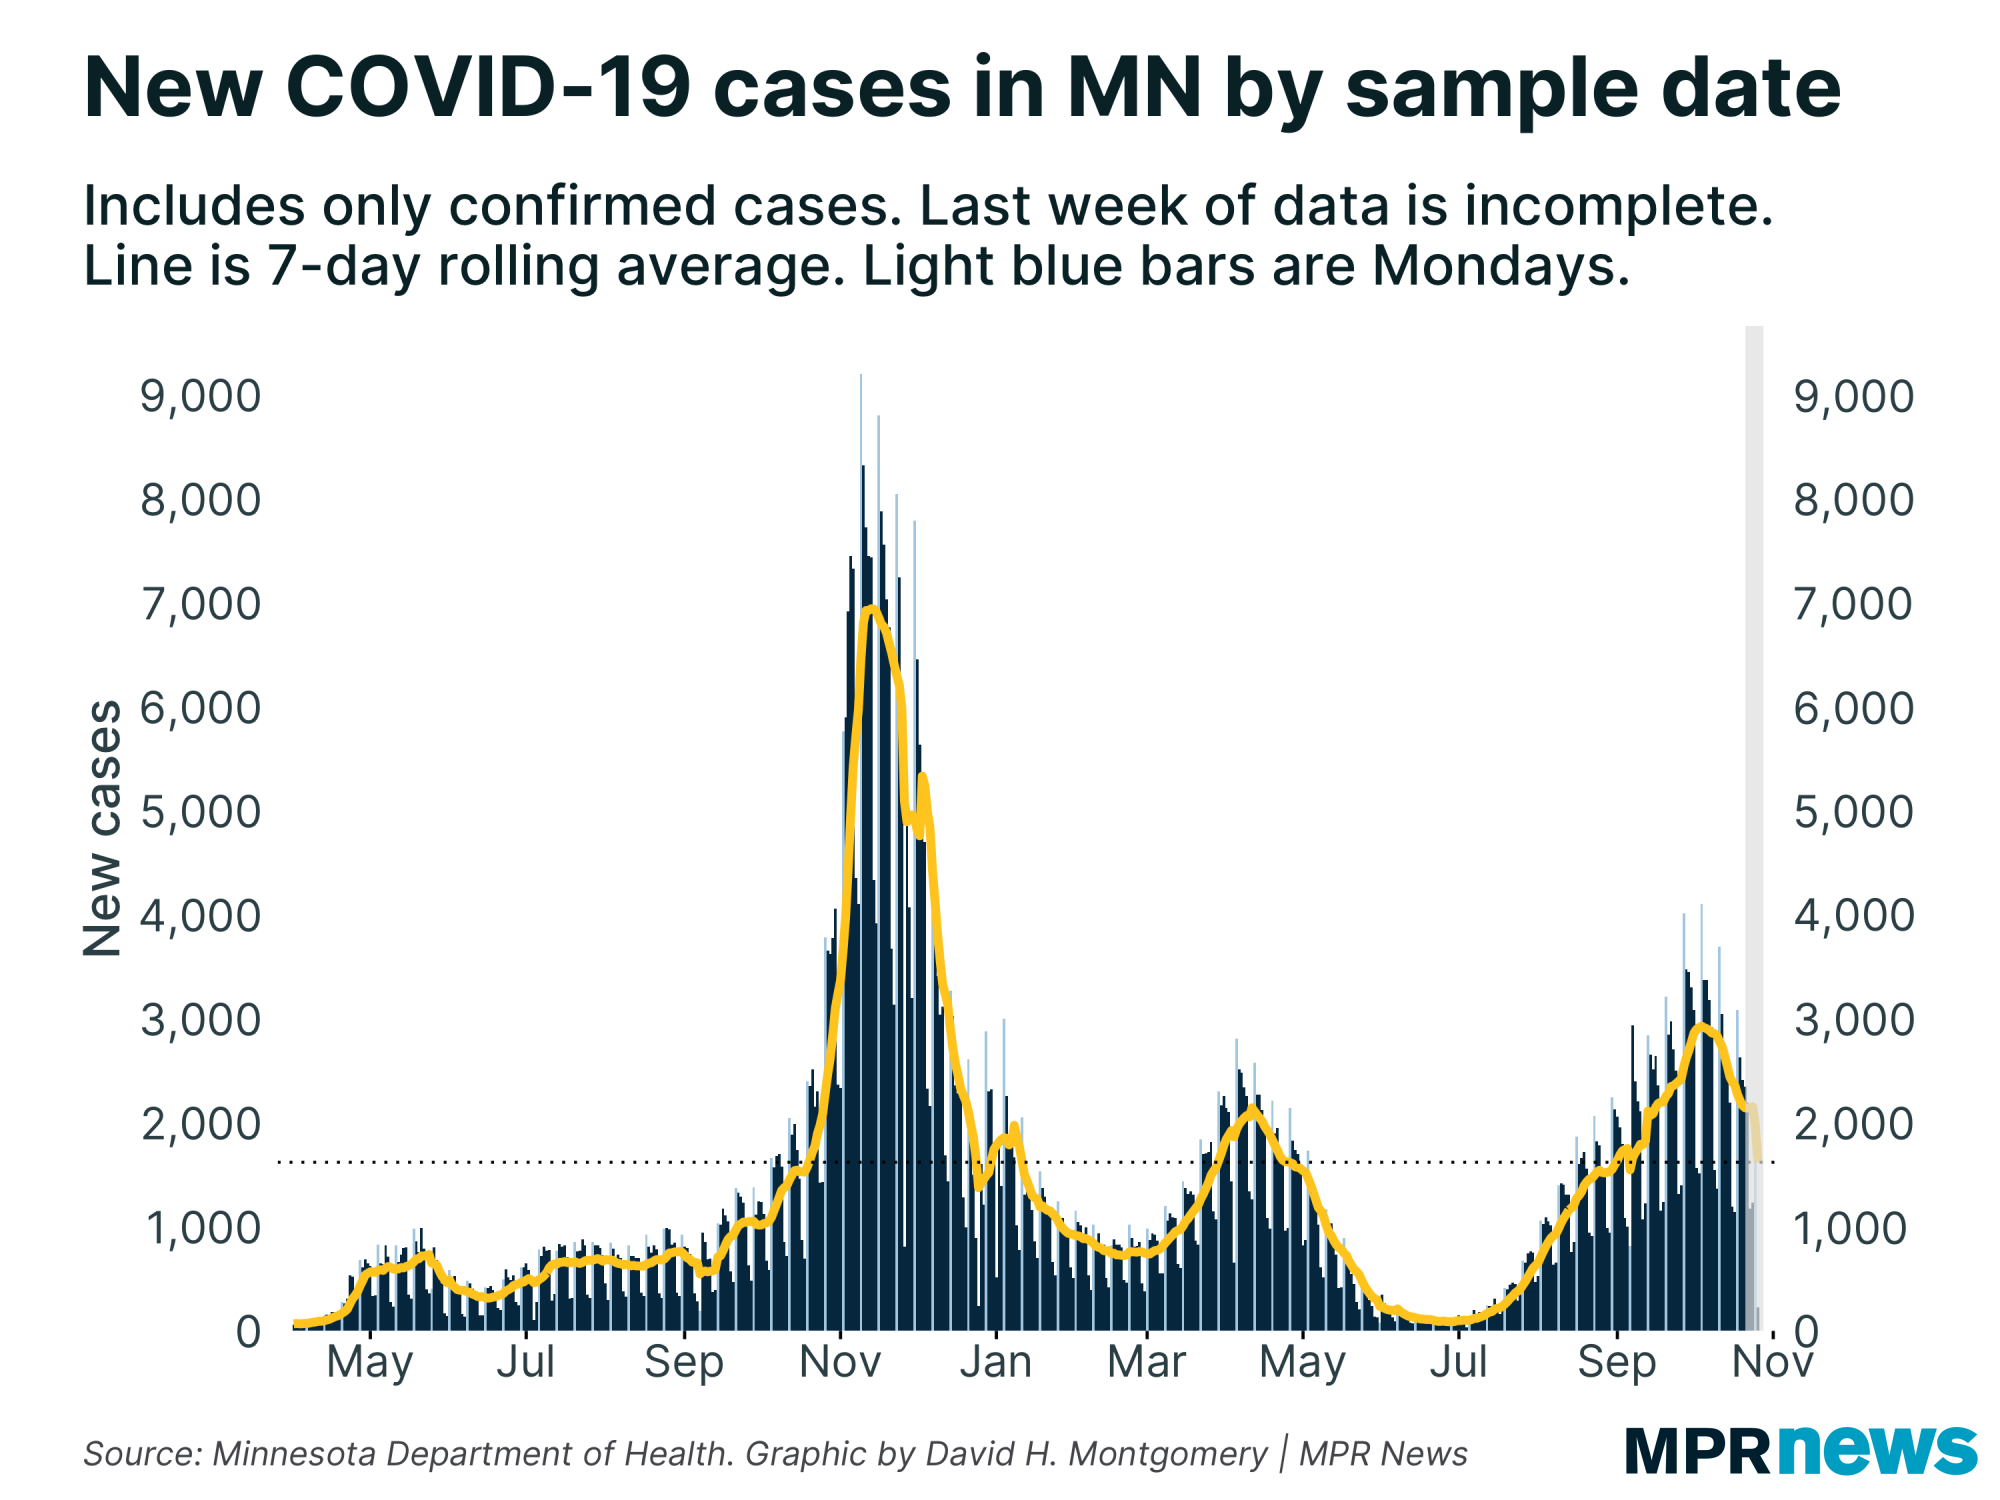
One thing that's worth noting is that this roller coaster we've seen with the data may be partially artificial. I previously mentioned that Monday saw some backlogged cases and tests dumped into the report. On top of that, we have the usual uneven reporting schedule and skipped weekends.
If you look at cases by the date the sample was taken, you don't see that same miniature spike that our date-reported data shows us.
However, this sample-date data is incomplete for recent days — most of the tests taken on Monday and Tuesday of this week have yet to make it into the state's reports. So it's possible this spike is coming, just on a bit of a lag. (Even the incomplete data for the end of last week shows at least a leveling off, which could become a minor spike as cases trickle in.) |
| |
|
|
Basically, messiness in the data is making it harder for us to tell what's really going on.
I will note as an outside gut-check that the model produced by covidestim.org currently shows Minnesota continuing a steady decline, without a significant bump. By their model, the number of new infections here continues to fall, and the average person with COVID is infecting less than one additional person (the value called Rt ). Their model is also unreliable in recent days, so don't take too much away from this. |
| |
|
|
Below, I'll explore a few more stats about Minnesota's COVID-19 outbreak. If you want to learn more, I also recommend these other articles:
| | |
|
|
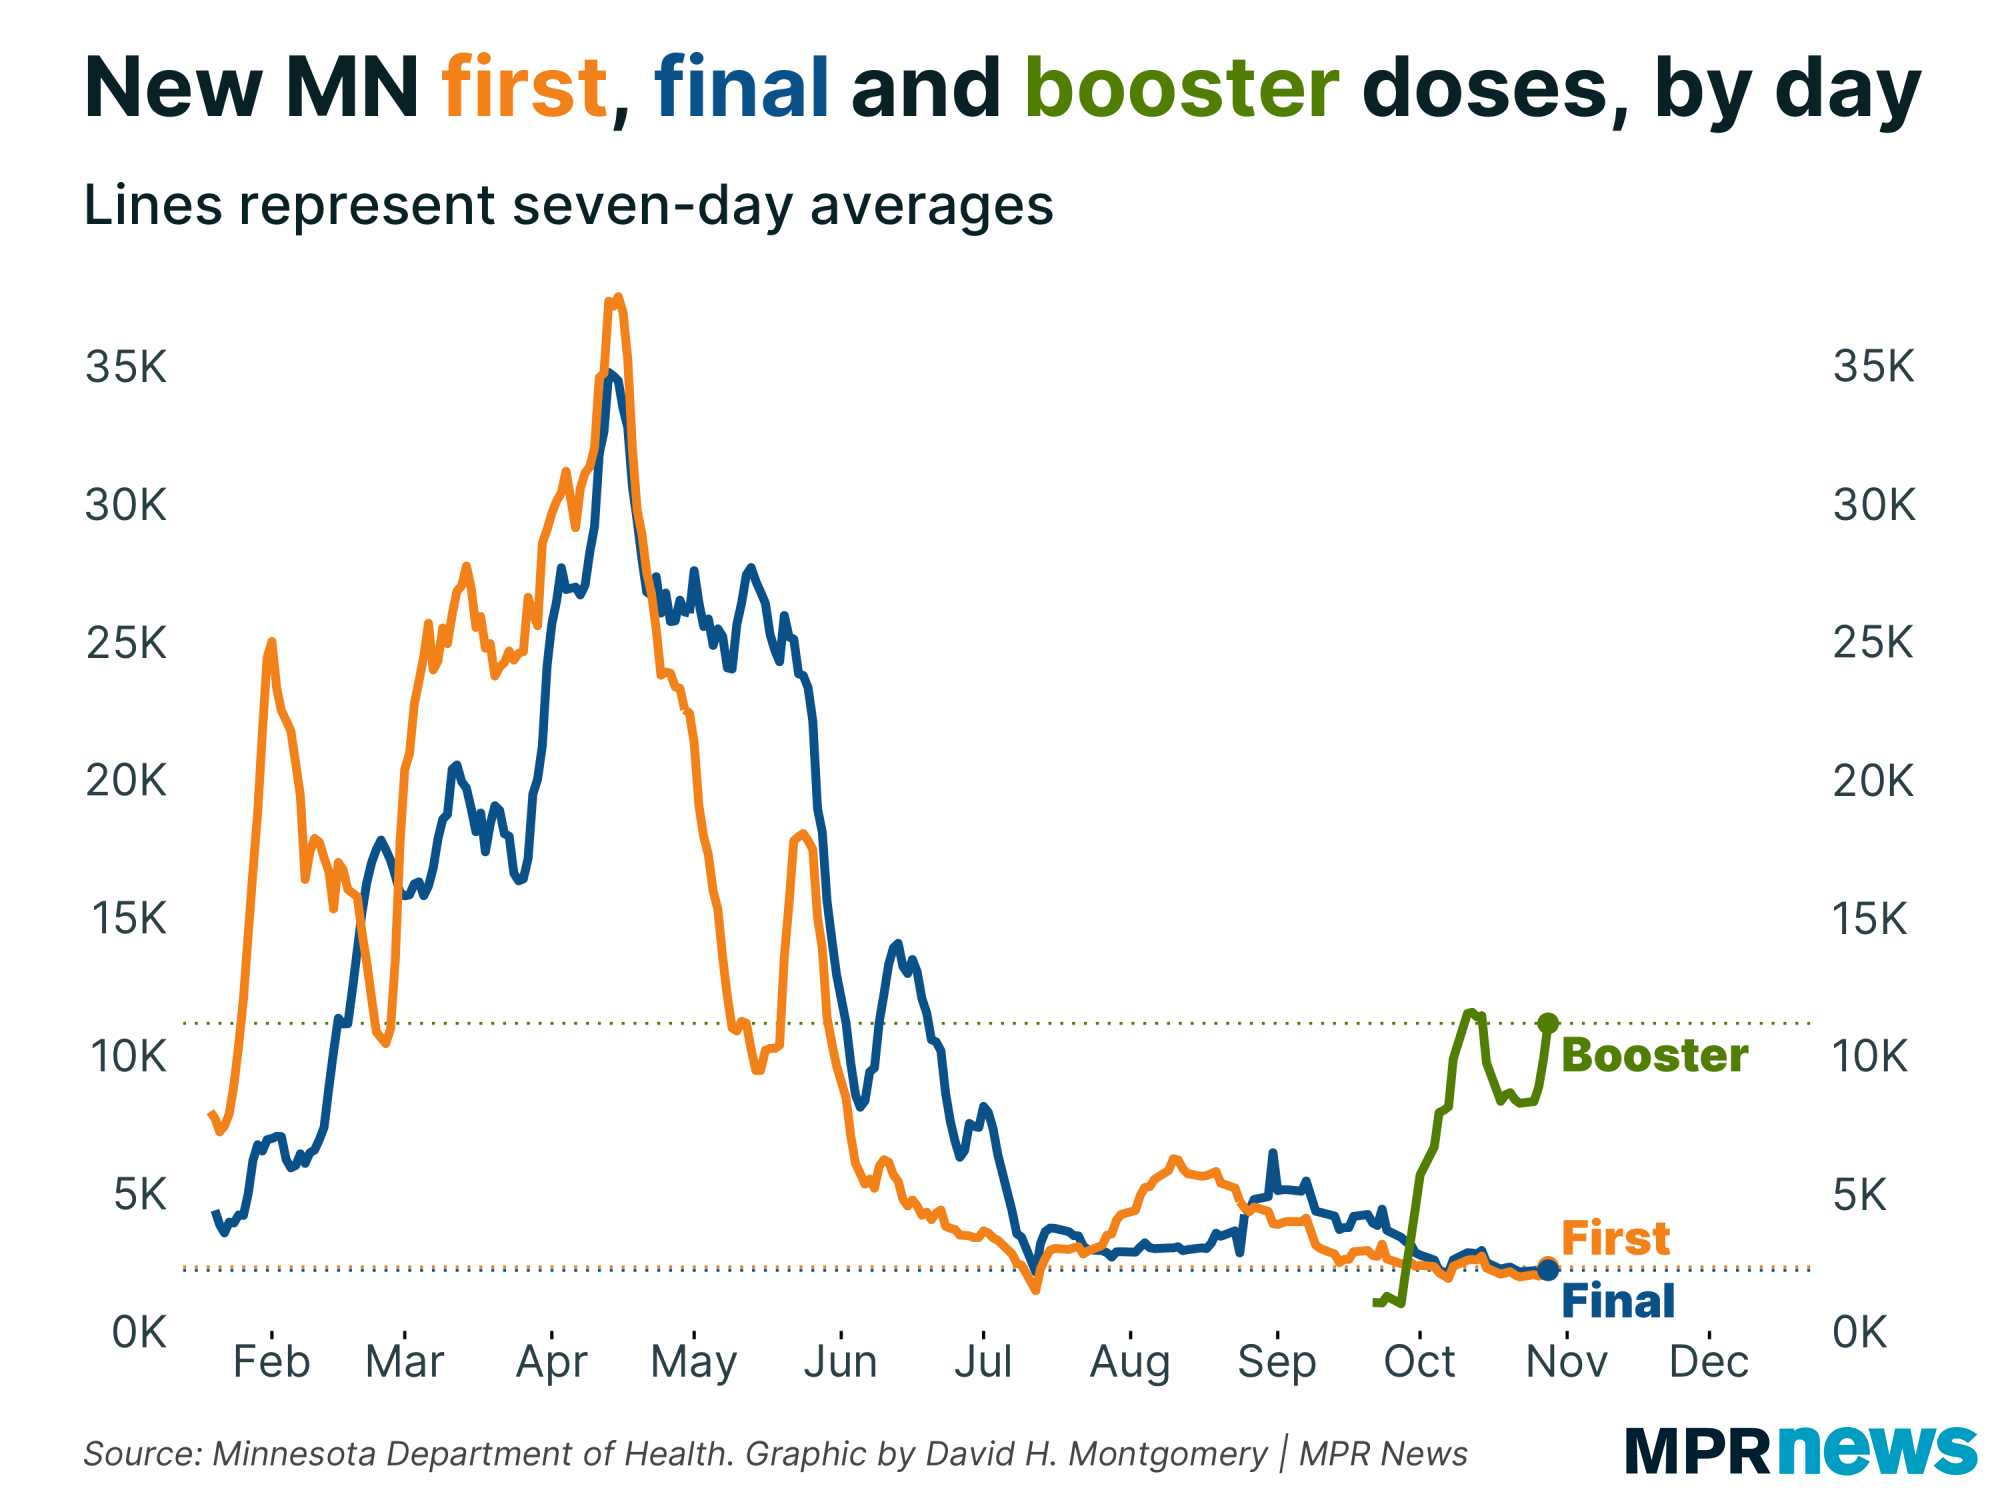
| Boosters rising, first doses flat | | Somewhere in the vicinity of 2,000 Minnesotans are getting their initial COVID-19 vaccination each day, on average. But around 10,000 people per day are getting booster shots, a number that's been rising this week. |
| |
|
|
That roughly 2,000 people per day getting newly vaccinated is a very small number on its own terms — more than an order of magnitude below the vaccination rates we saw earlier in the pandemic. It's also small in relative terms — some two million Minnesotans remain unvaccinated, which means that 0.1 percent of that unvaccinated population is becoming vaccinated per day.
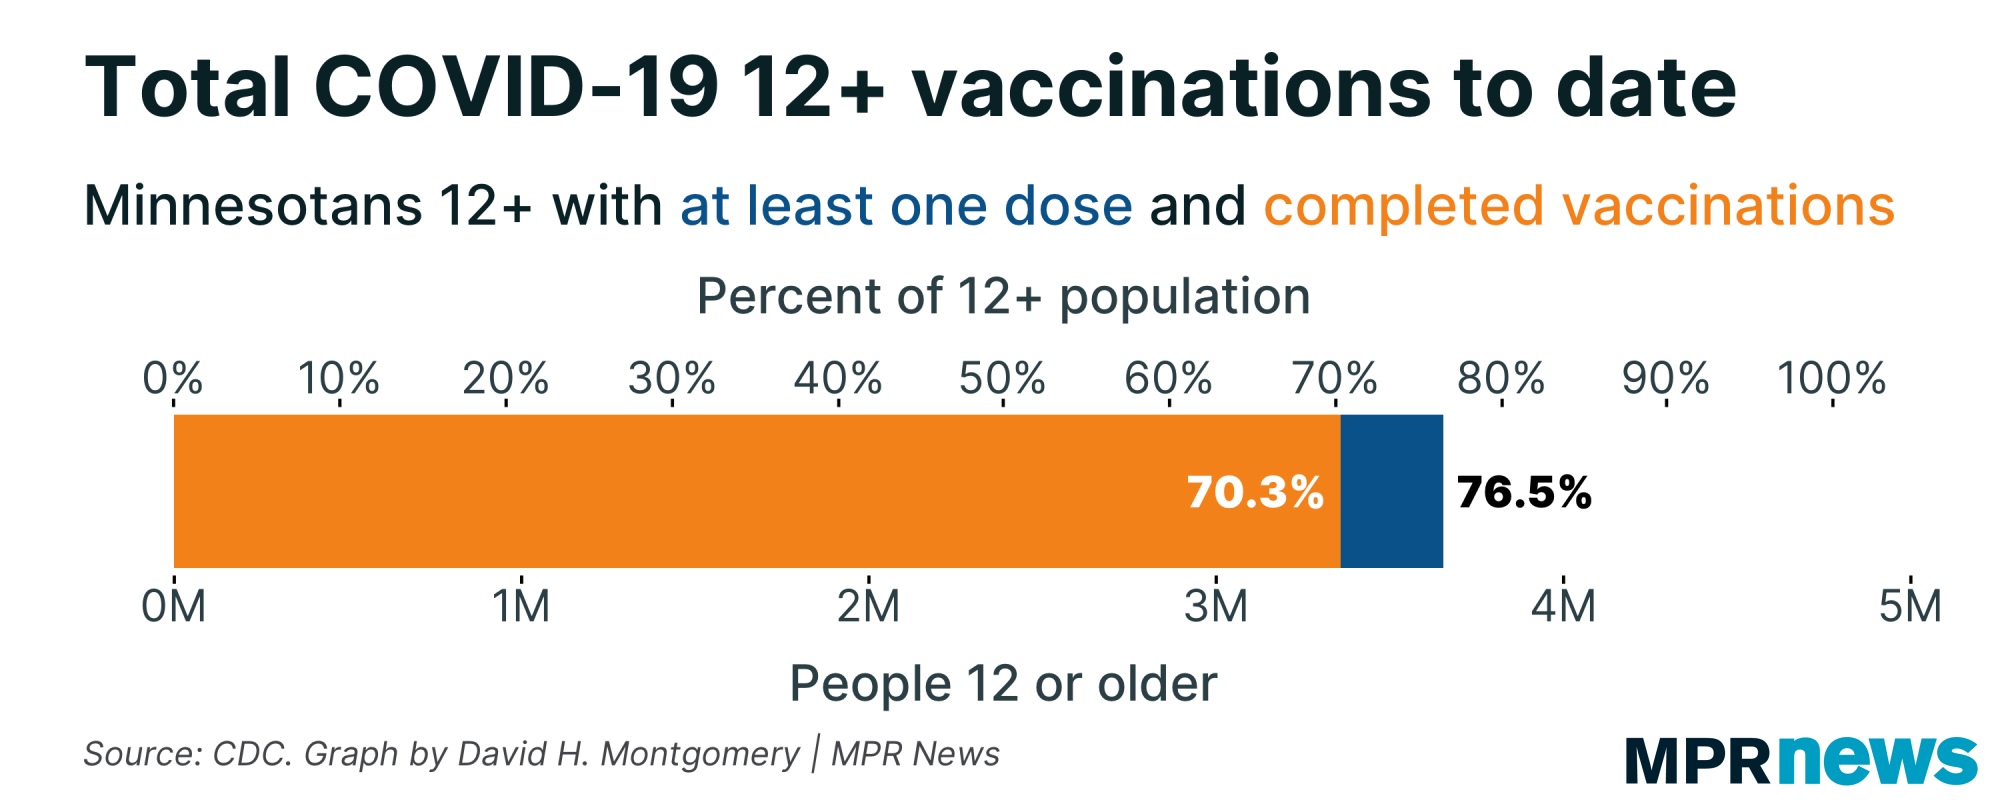
Overall, 76.4 percent of Minnesotans 12 or older have received at least one dose of the COVID-19 vaccine. |
| |
|
|
| To get just those few percentage points up to 80 percent, at the current rate, would take about 70 days — into 2023. We could get there in a couple of weeks at just 10,000 per day. | | |
|
|
What impact will child vaccinations have?
| The COVID-19 vaccine, currently authorized for people 12 or older, is expected to be approved imminently for children aged 5 to 11. What impact will that have on Minnesota's vaccination rate?
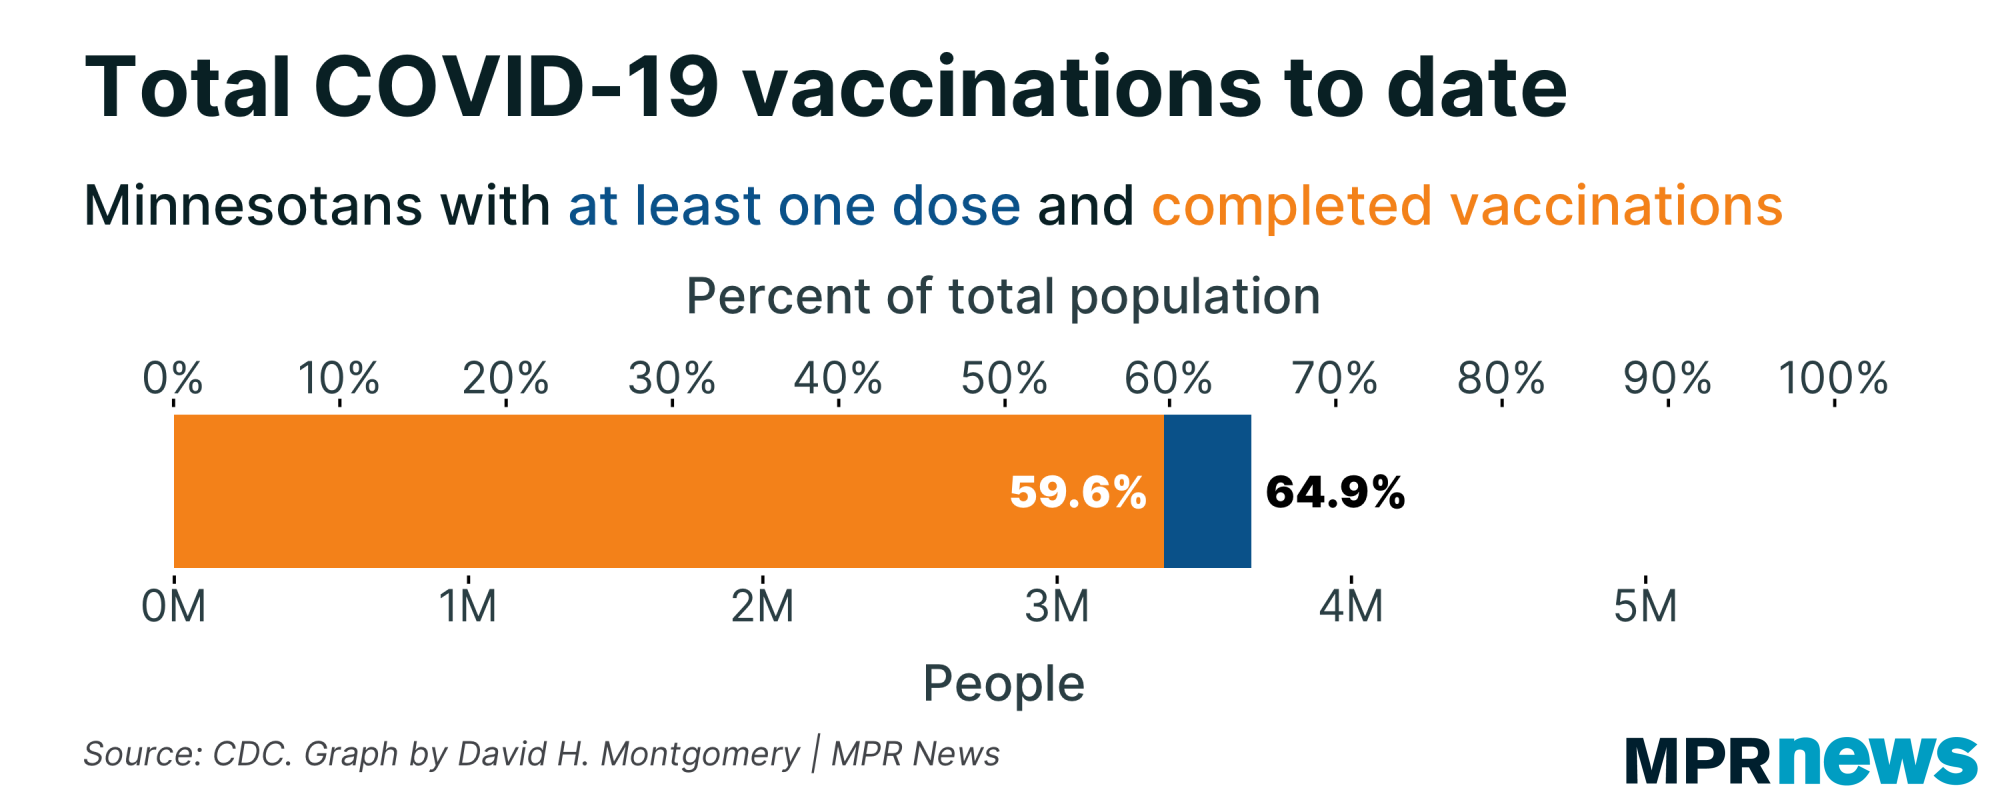
To start: overall, about 65 percent of all Minnesotans have received at least one dose. (Contrast that to 76.5 percent of those currently eligible, above.) |
| |
|
|
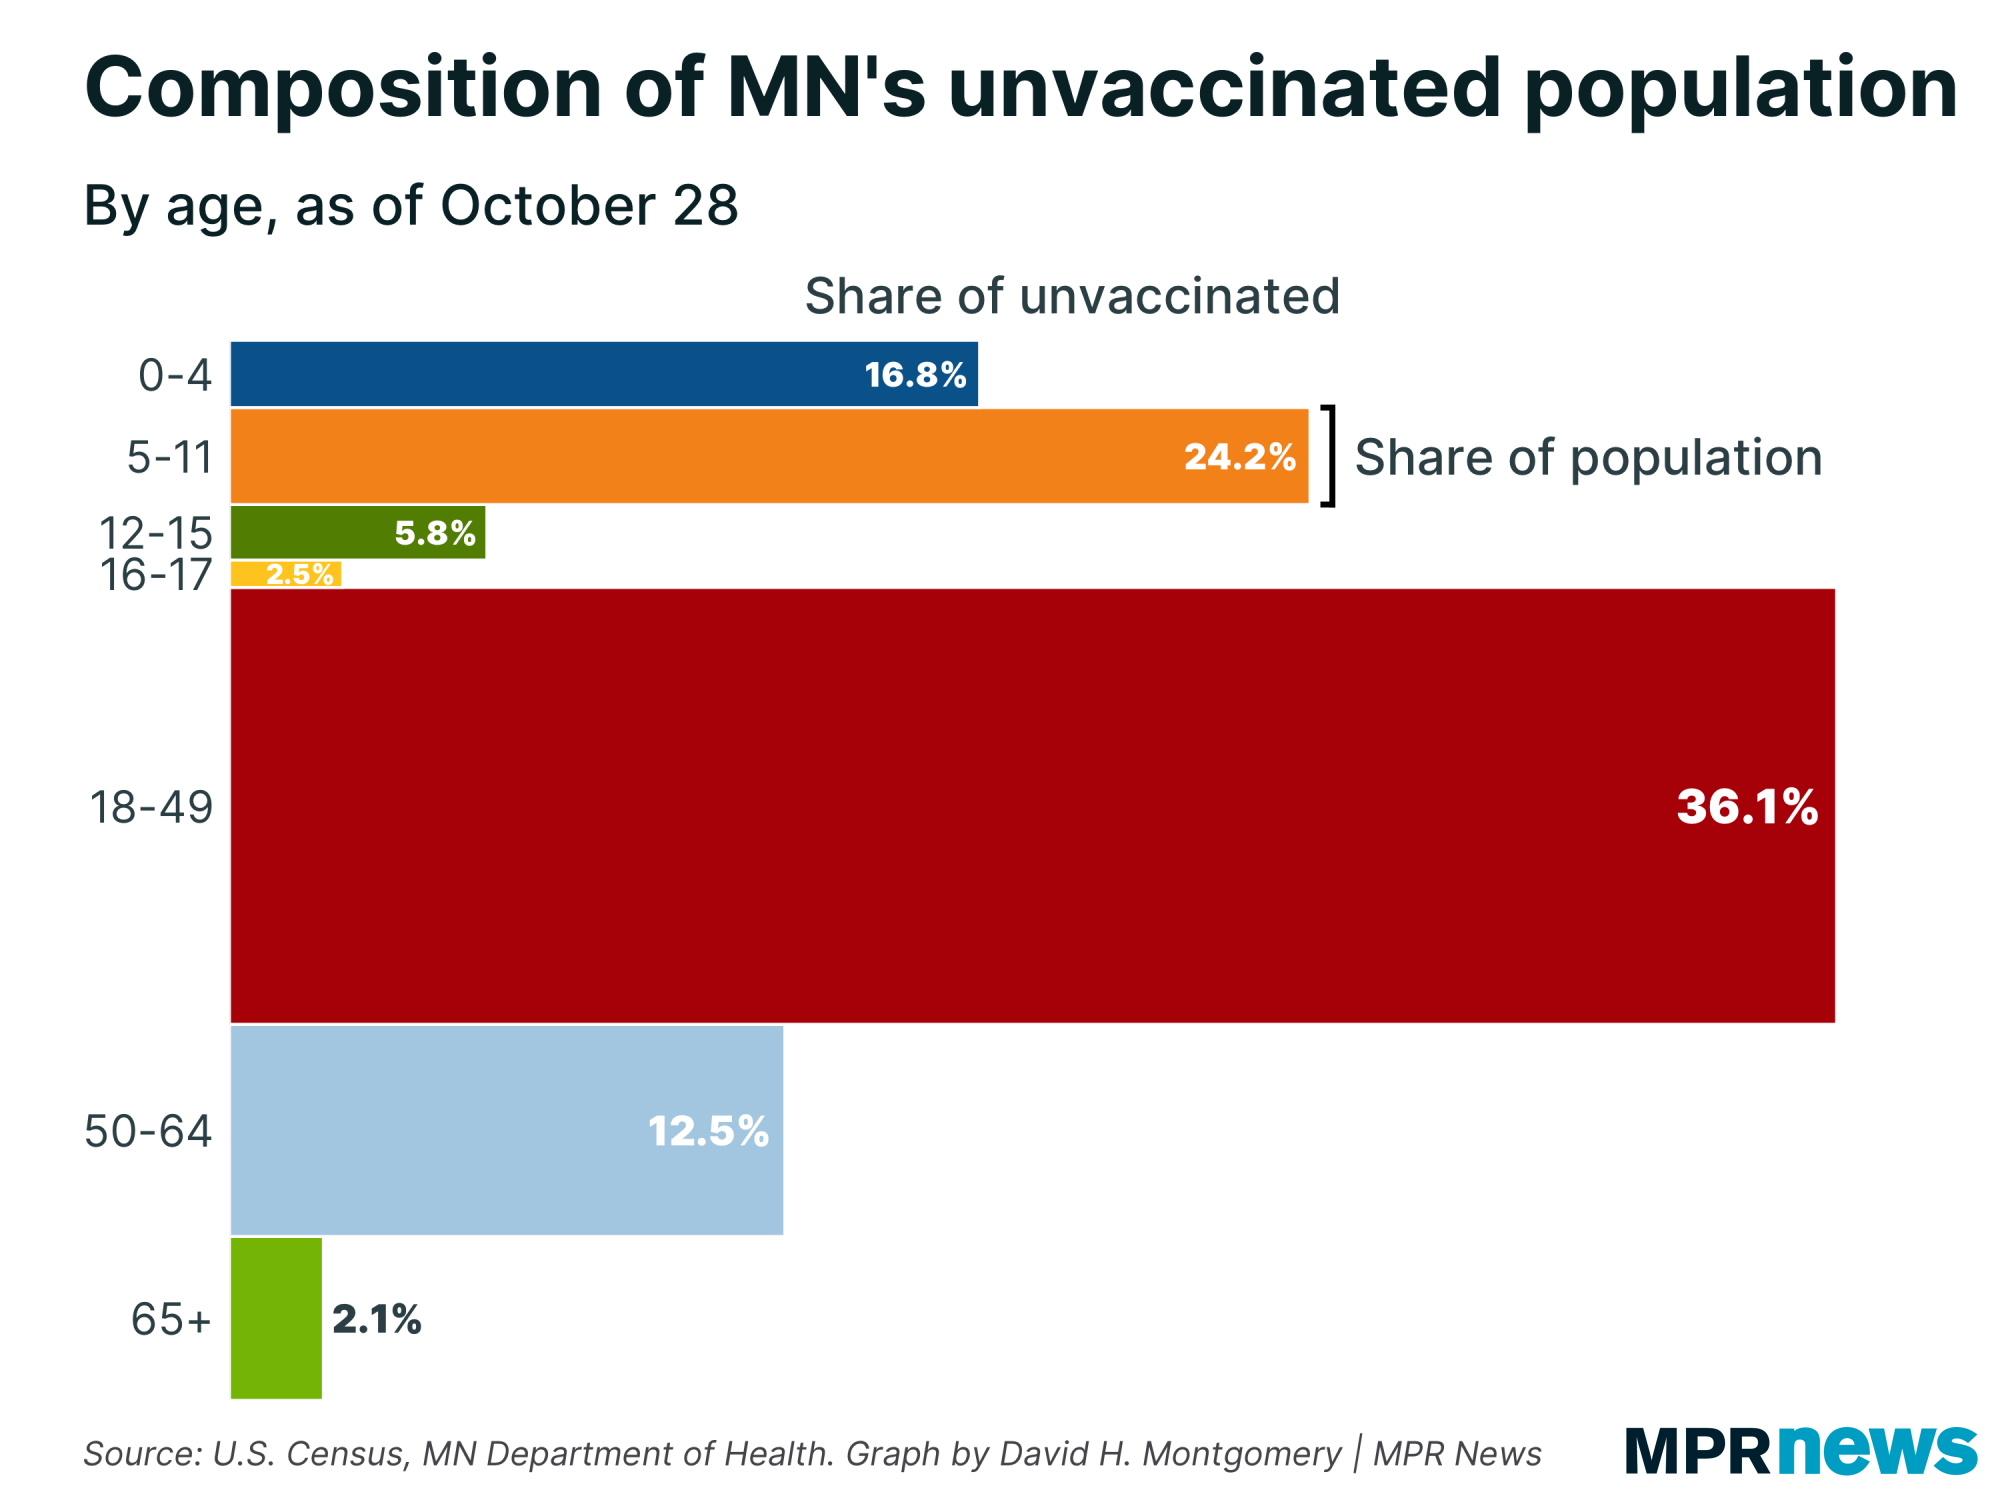
| Of that 35.1 percent of the state — or some 2 million people — around one-quarter are children aged 5 to 11, or just over 500,000. Another one-sixth are children under 5 (who won't get approved any time soon). Nearly half are working-age adults. | |
|
|
|
So you've got 500,000 kids who are about to become eligible for the vaccine. That's 9 percent of the state population. If all of them got vaccinated, Minnesota would jump up to about 74 percent of its population with at least one dose.
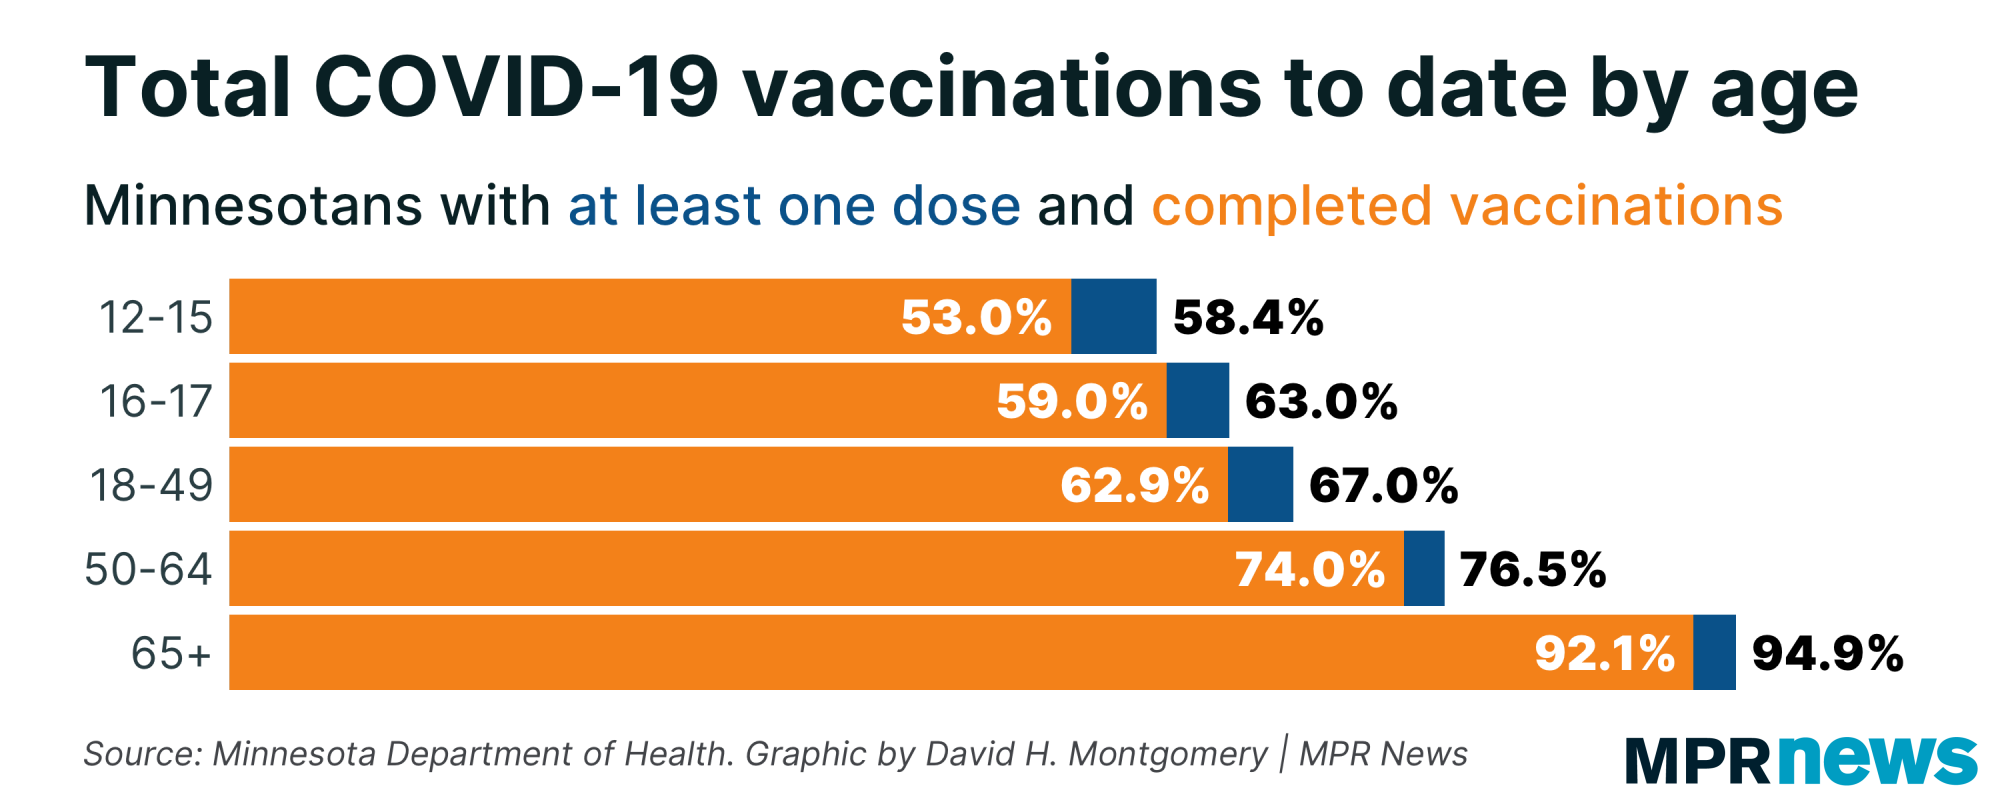
But right now there's no reason to expect anywhere close to 100 percent vaccination among this newly eligible group. Just under 60 percent of kids 12 to 15 are currently vaccinated, the lowest rate of any age group. |
| |
|
|
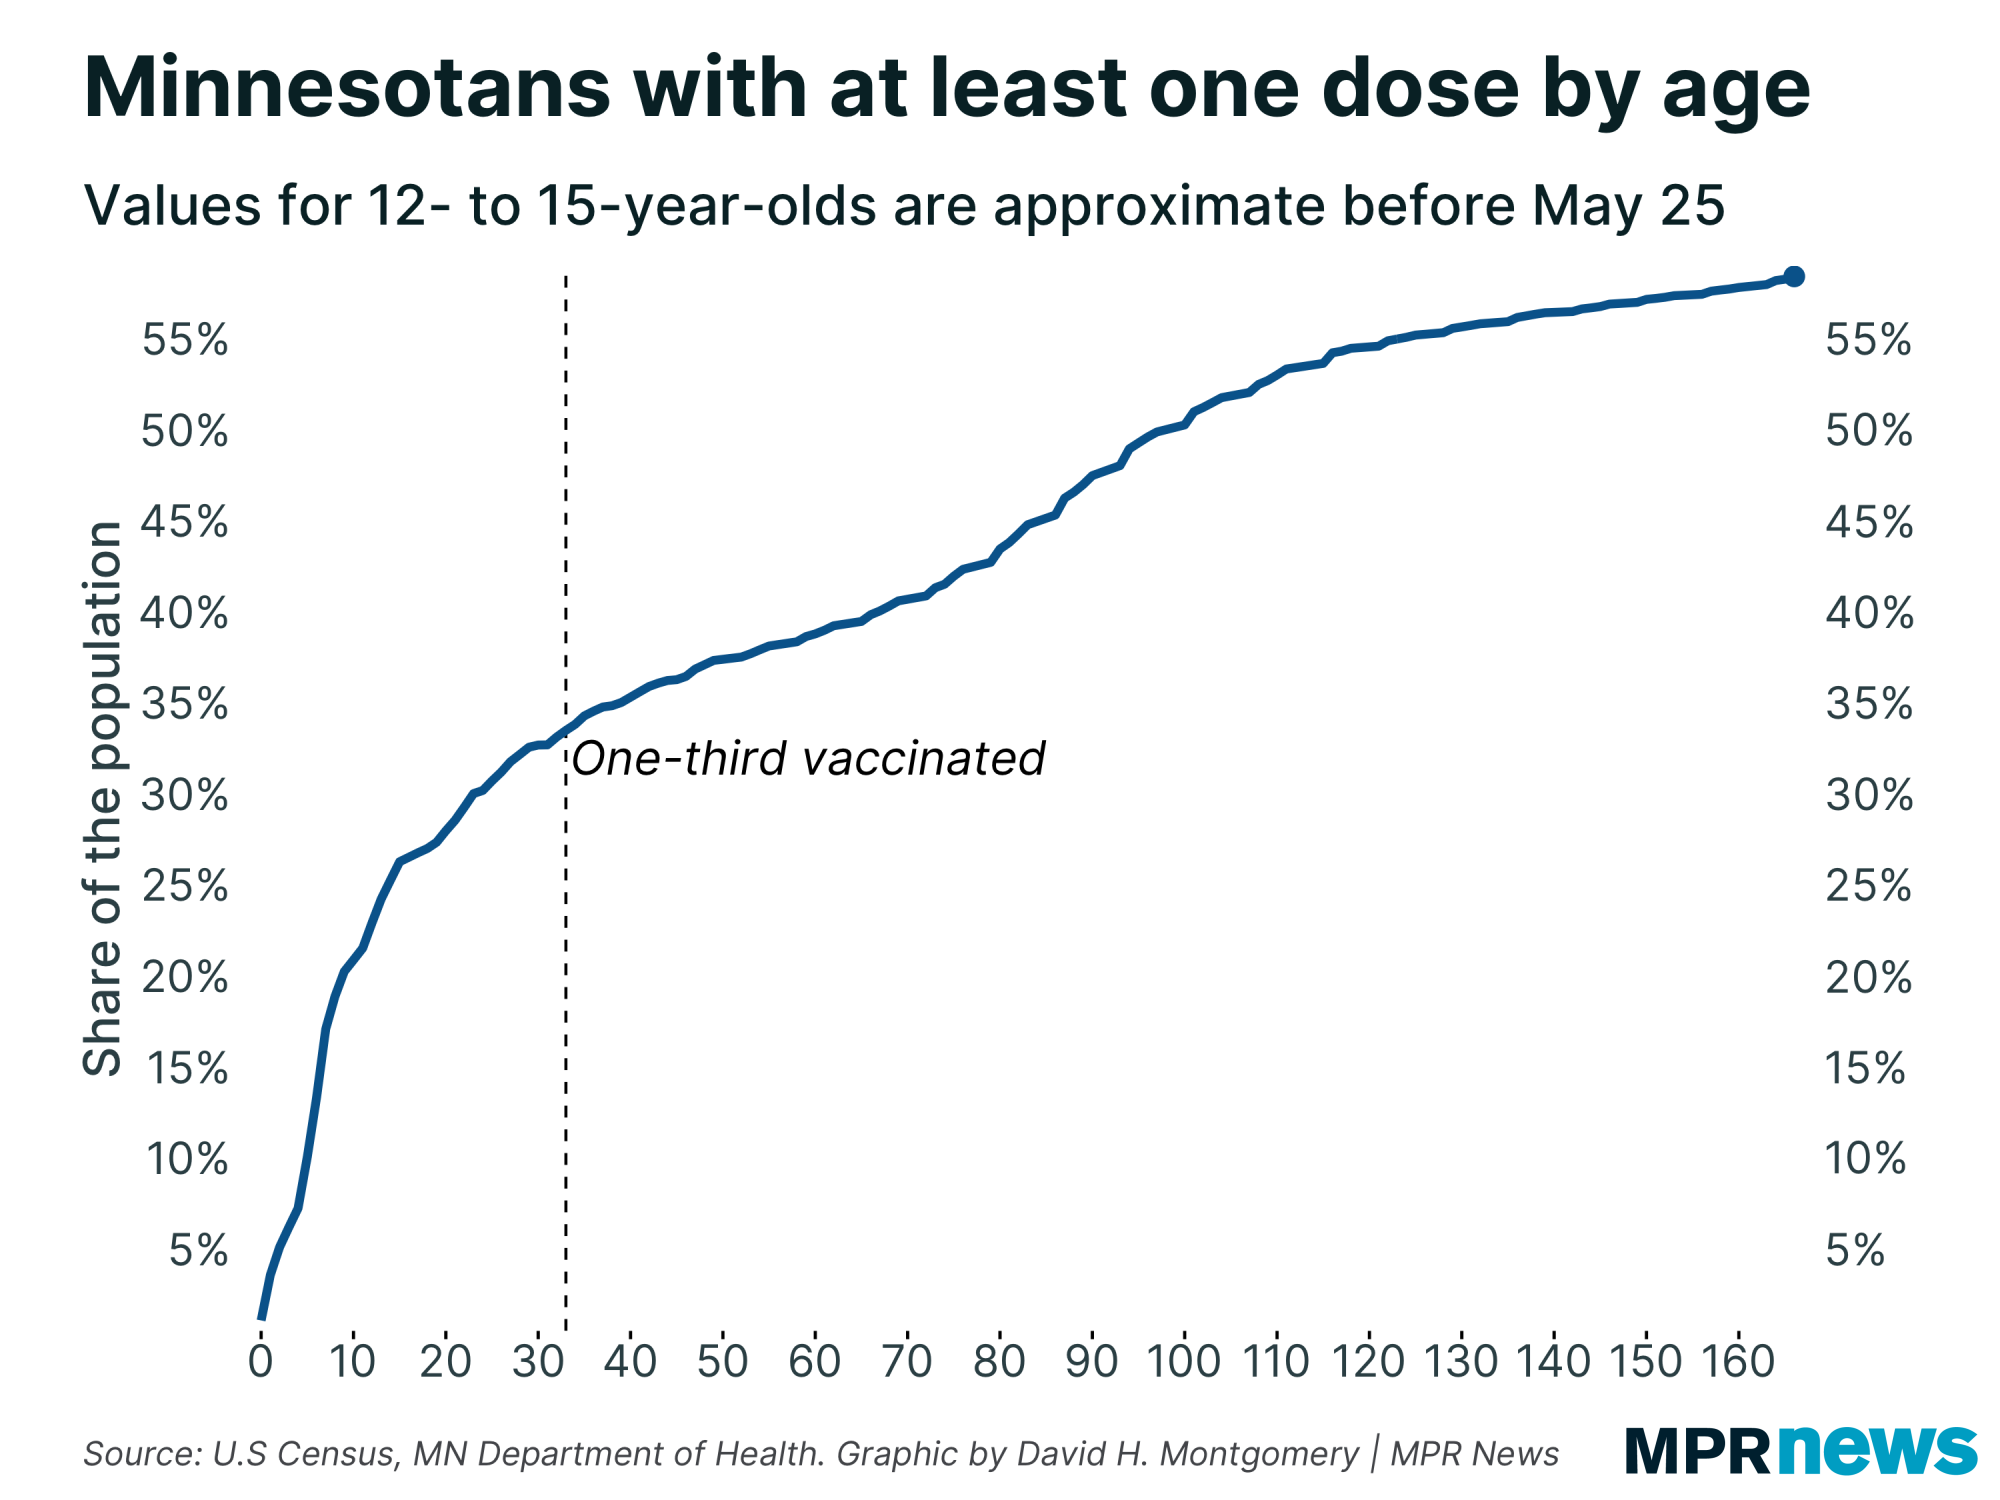
| When kids 12 to 15 became eligible for the vaccine back in May, it took almost exactly one month to get one-third of them vaccinated. (It took about 100 days to get them over 50 percent.) | | |
|
|
So let's assume the group 5 to 11 is somewhat similar. We'll see a huge rush right away as a certain subset of parents get their kids vaccinated as soon as possible, then a slowing pace.
What would it mean for one-third of kids 5 to 11 to get vaccinated? Well, that's about 3 percent of Minnesota's population, which would take us from about 65 percent to 68 percent fully vaccinated.
As you can see, this would help, but it's not going to completely change the game for Minnesota's vaccination rate. There just aren't enough kids out there, especially at the rate they're likely to get vaccinated.
Currently around 27 percent of Minnesota kids 5 to 17 are vaccinated (0 percent under 5 to 11, and then just over half of the rest). If that went from 27 percent to 80 percent (perhaps through a school mandate) that would be an extra 550,000 new vaccinated people, or just under 10 percent of the state.
By contrast, getting adults 18-49 from 67 percent vaccinated to 80 percent would amount to about 300,000 newly vaccinated people, or a bit over 5 percent of the state.
Both those thresholds at once would get Minnesota overall over 80 percent of the total population vaccinated. |
| |
|
|
What's happening next?
| Next week we'll see whether this week or last week was the fluke!
Thanks for subscribing to this newsletter and for all of you who've sent me your feedback. As always, if you like this newsletter, please share it and the sign-up link with others who you think might enjoy it.
— David |
| |
|
|
Preference Center ❘ Unsubscribe You received this email because you subscribed or it was sent to you by a friend. This email was sent by: %%Member_Busname%%
%%Member_Addr%% %%Member_City%%, %%Member_State%%, %%Member_PostalCode%%
  |
|
|
| | |