| Welcome back to COVID in Minnesota TODAY, an email newsletter from MPR News about understanding the latest developments in Minnesota's COVID-19 outbreak. | | |
|
|
It's been a wild up-and-down few weeks for Minnesota's COVID-19 outbreak. At the moment I write this, the news is a little bit encouraging, but I'm certainly not taking anything for granted any more.
So far almost all the new cases Minnesota is experiencing are from the delta variant that's been hitting us since summer. That's not to say the new omicron variant won't become dominant here — it surely will, eventually — only that this isn't happening now, and is probably a minimum of a few weeks away if not more.
The looming omicron variant right now is a factor for considering what will happen in the medium-term for Minnesota — what'll happen next month, not tomorrow.
More on all this below. |
| |
|
|
Three things to know
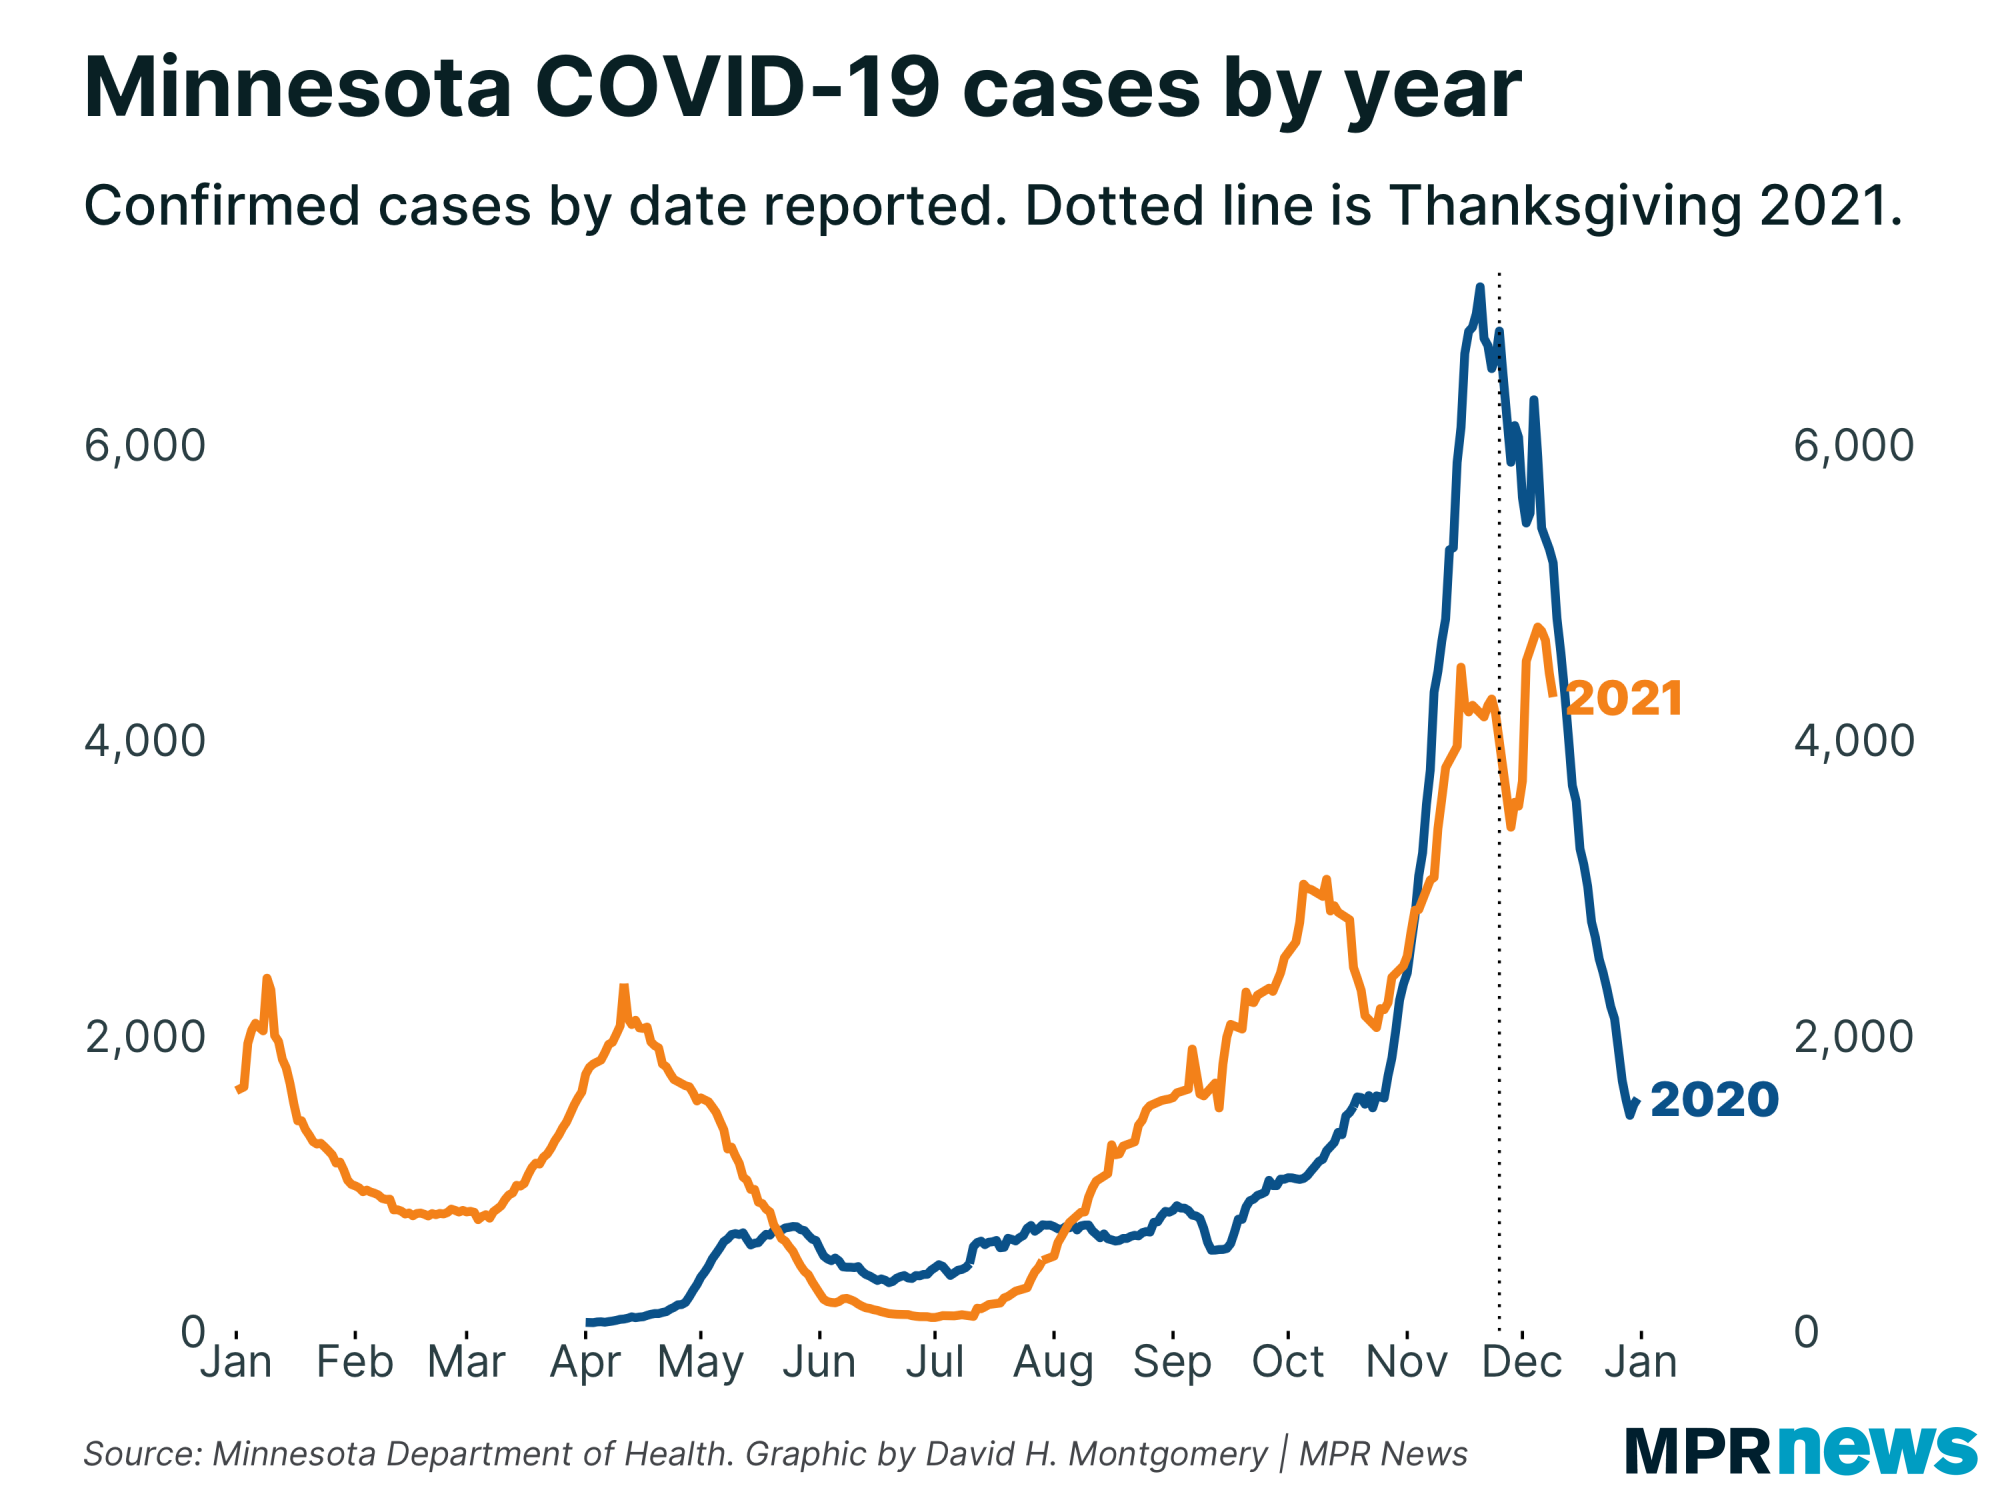
| - Thanksgiving gatherings appear to have prompted a minor surge in COVID-19 cases, but this might be fading
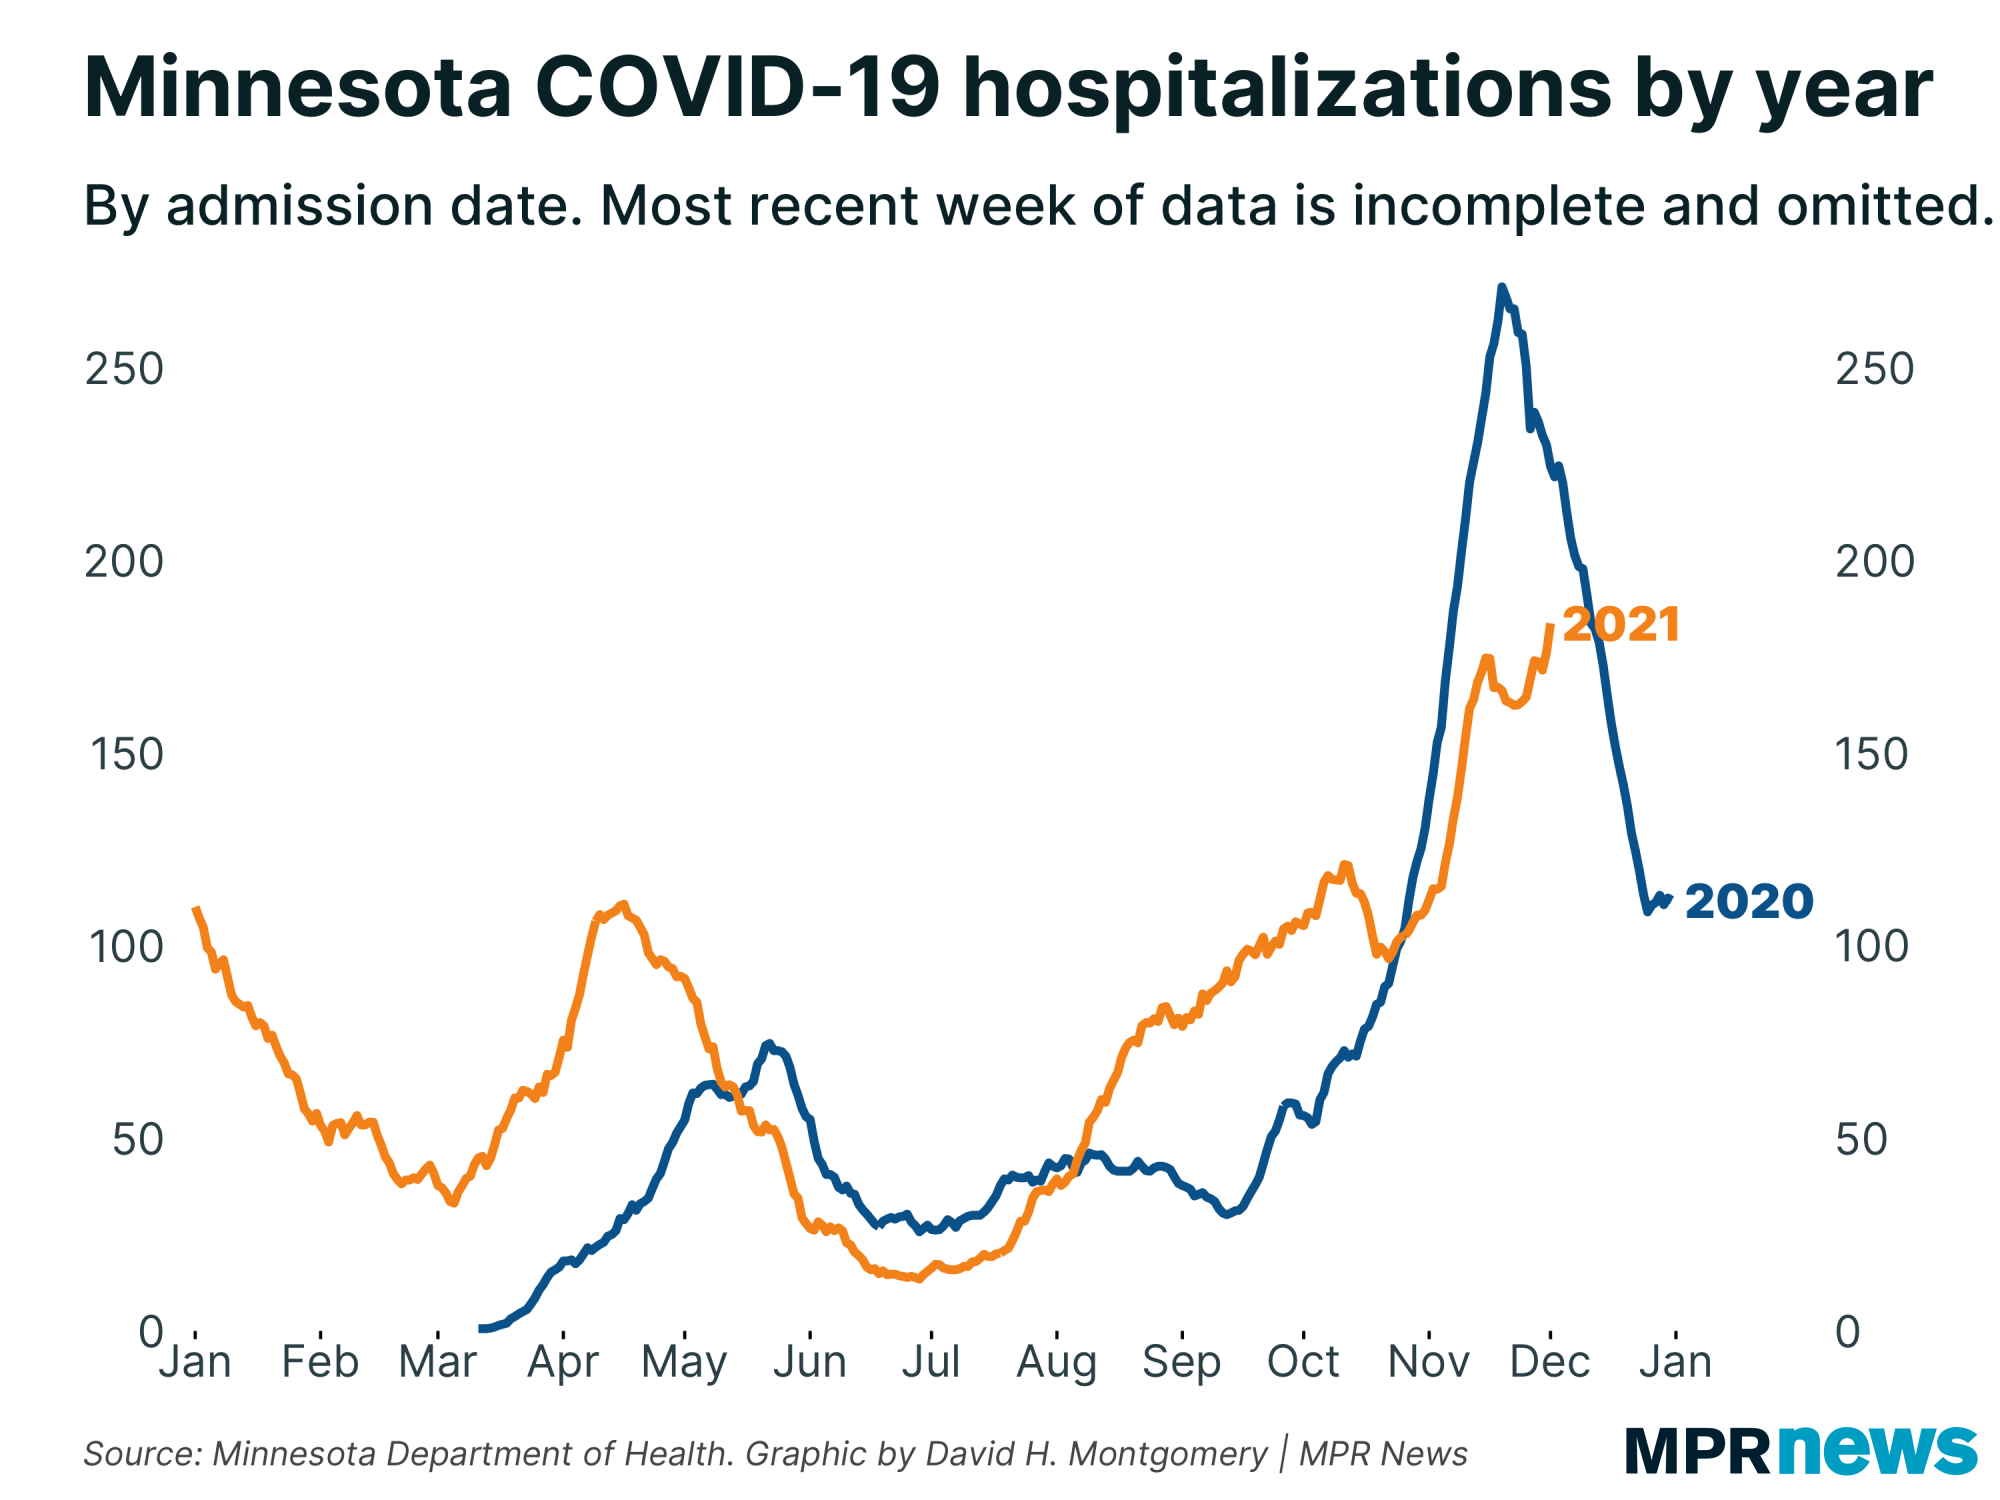
- Hospital admissions are lower than the peak last year, but hospital bed use is near record highs, probably reflecting longer stays
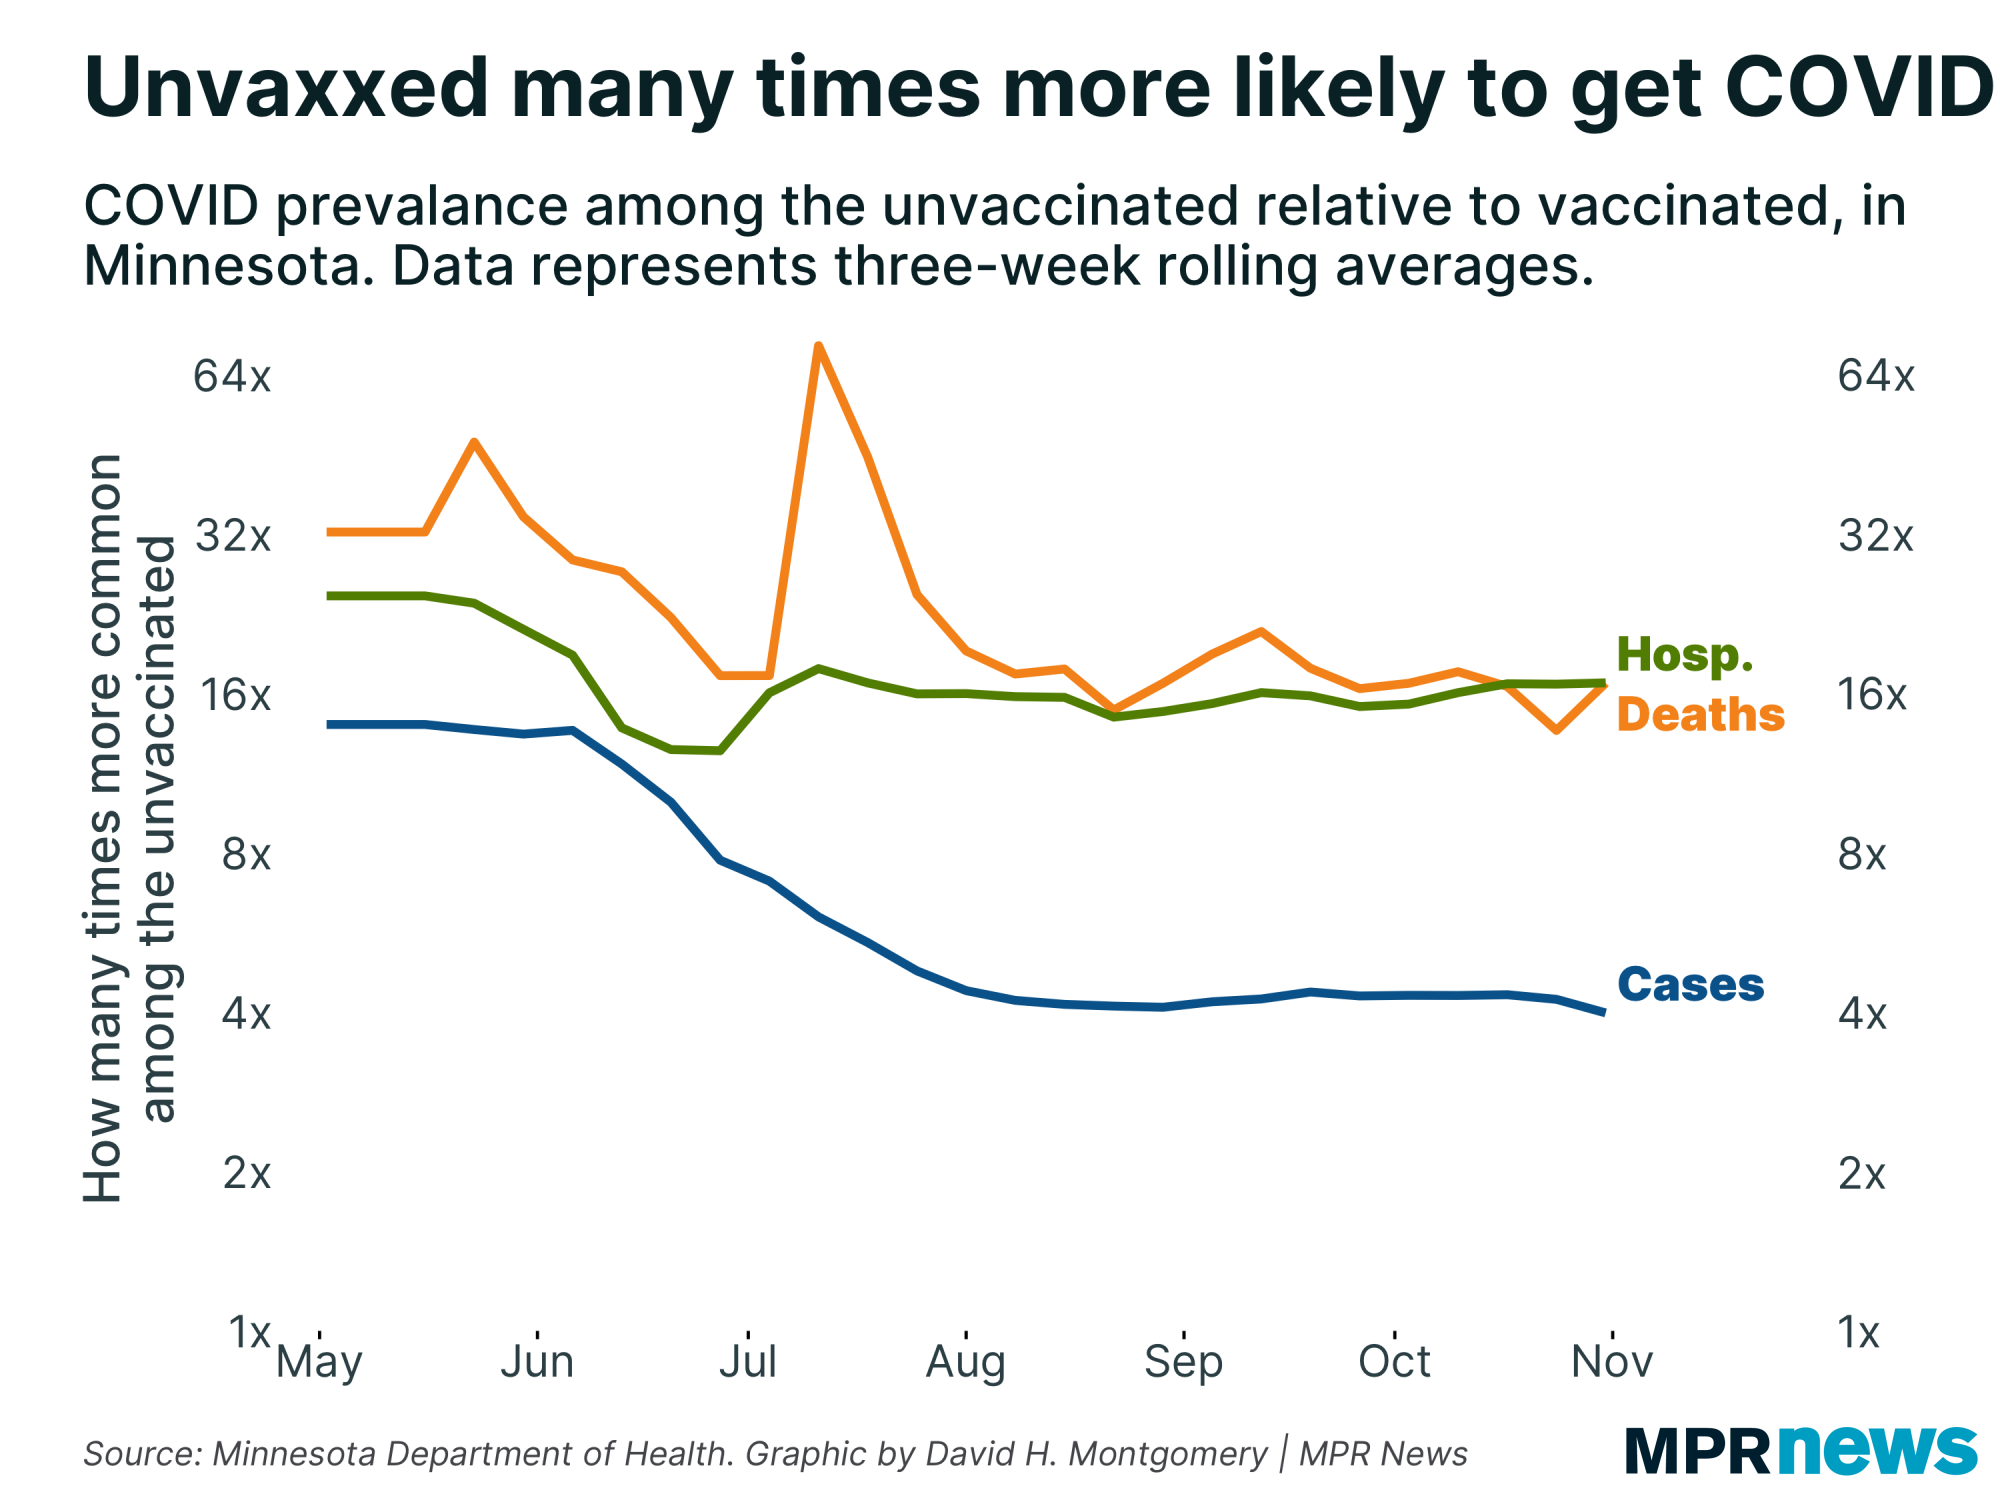
- COVID-19 continues to disproportionately affect unvaccinated Minnesotans
|
| |
|
|
All our data has been messy in multiple ways since Thanksgiving, which has made interpreting what's going on much more difficult. The holiday meant we skipped certain reporting days and then had multiple days of data reporting at once. Even data by sample date was thrown off — for the past month Minnesota has tended to have somewhere north of 50,000 tests conducted each Thursday, but that plunged to 8,109 on Nov. 25, with concomitantly fewer cases. A lazy analysis of week-over-week data might make it look like we were experiencing a big decline (followed a week later by a big jump), when all that was happening was a federal holiday cycling through our seven-day averages.
On top of the artificial data reporting issues caused by the holiday, we had a second wrench: the impact on COVID-19 infections caused by Thanksgiving.
Now, in the absence of thorough contact-tracing (which Minnesota has drastically scaled back), it's hard to know how many people actually got infected at Thanksgiving gatherings. But the data is strongly suggestive. Of people who went and got COVID-19 tests the weekend after Thanksgiving, some 13 percent were positive each day. Those days are two of just 27 days all pandemic with a daily positivity rate above 13 percent (by sample date):
- Nine of those were in late April and early May 2020, the peak of the spring 2020 wave
- 13 of them were in late October and early November 2020, the peak of the Fall 2020 wave
- Two were the Saturday and Sunday after Thanksgiving 2020
- One was Jan. 2, 2021, two days after New Year's Eve
- Two were the Saturday and Sunday after Thanksgiving 2021
The next day was Monday, Nov. 29; tens of thousands of people headed out to get tests, of which more than 10 percent were positive, for 6,908 cases so far — the most found on any single day of testing in 2021 to date.
So it certainly looks like lots of people got infected at Thanksgiving gatherings who would not ordinarily have been.
What this all means for the medium term is more complex, though. We certainly saw all these extra infections lead to a bump in Minnesota's case counts and positivity rate — reversing a pre-Thanksgiving decline. But the last few days of data have seen case counts and positivity fall again, suggesting that our Thanksgiving surge might be mercifully brief. |
| |
|
|
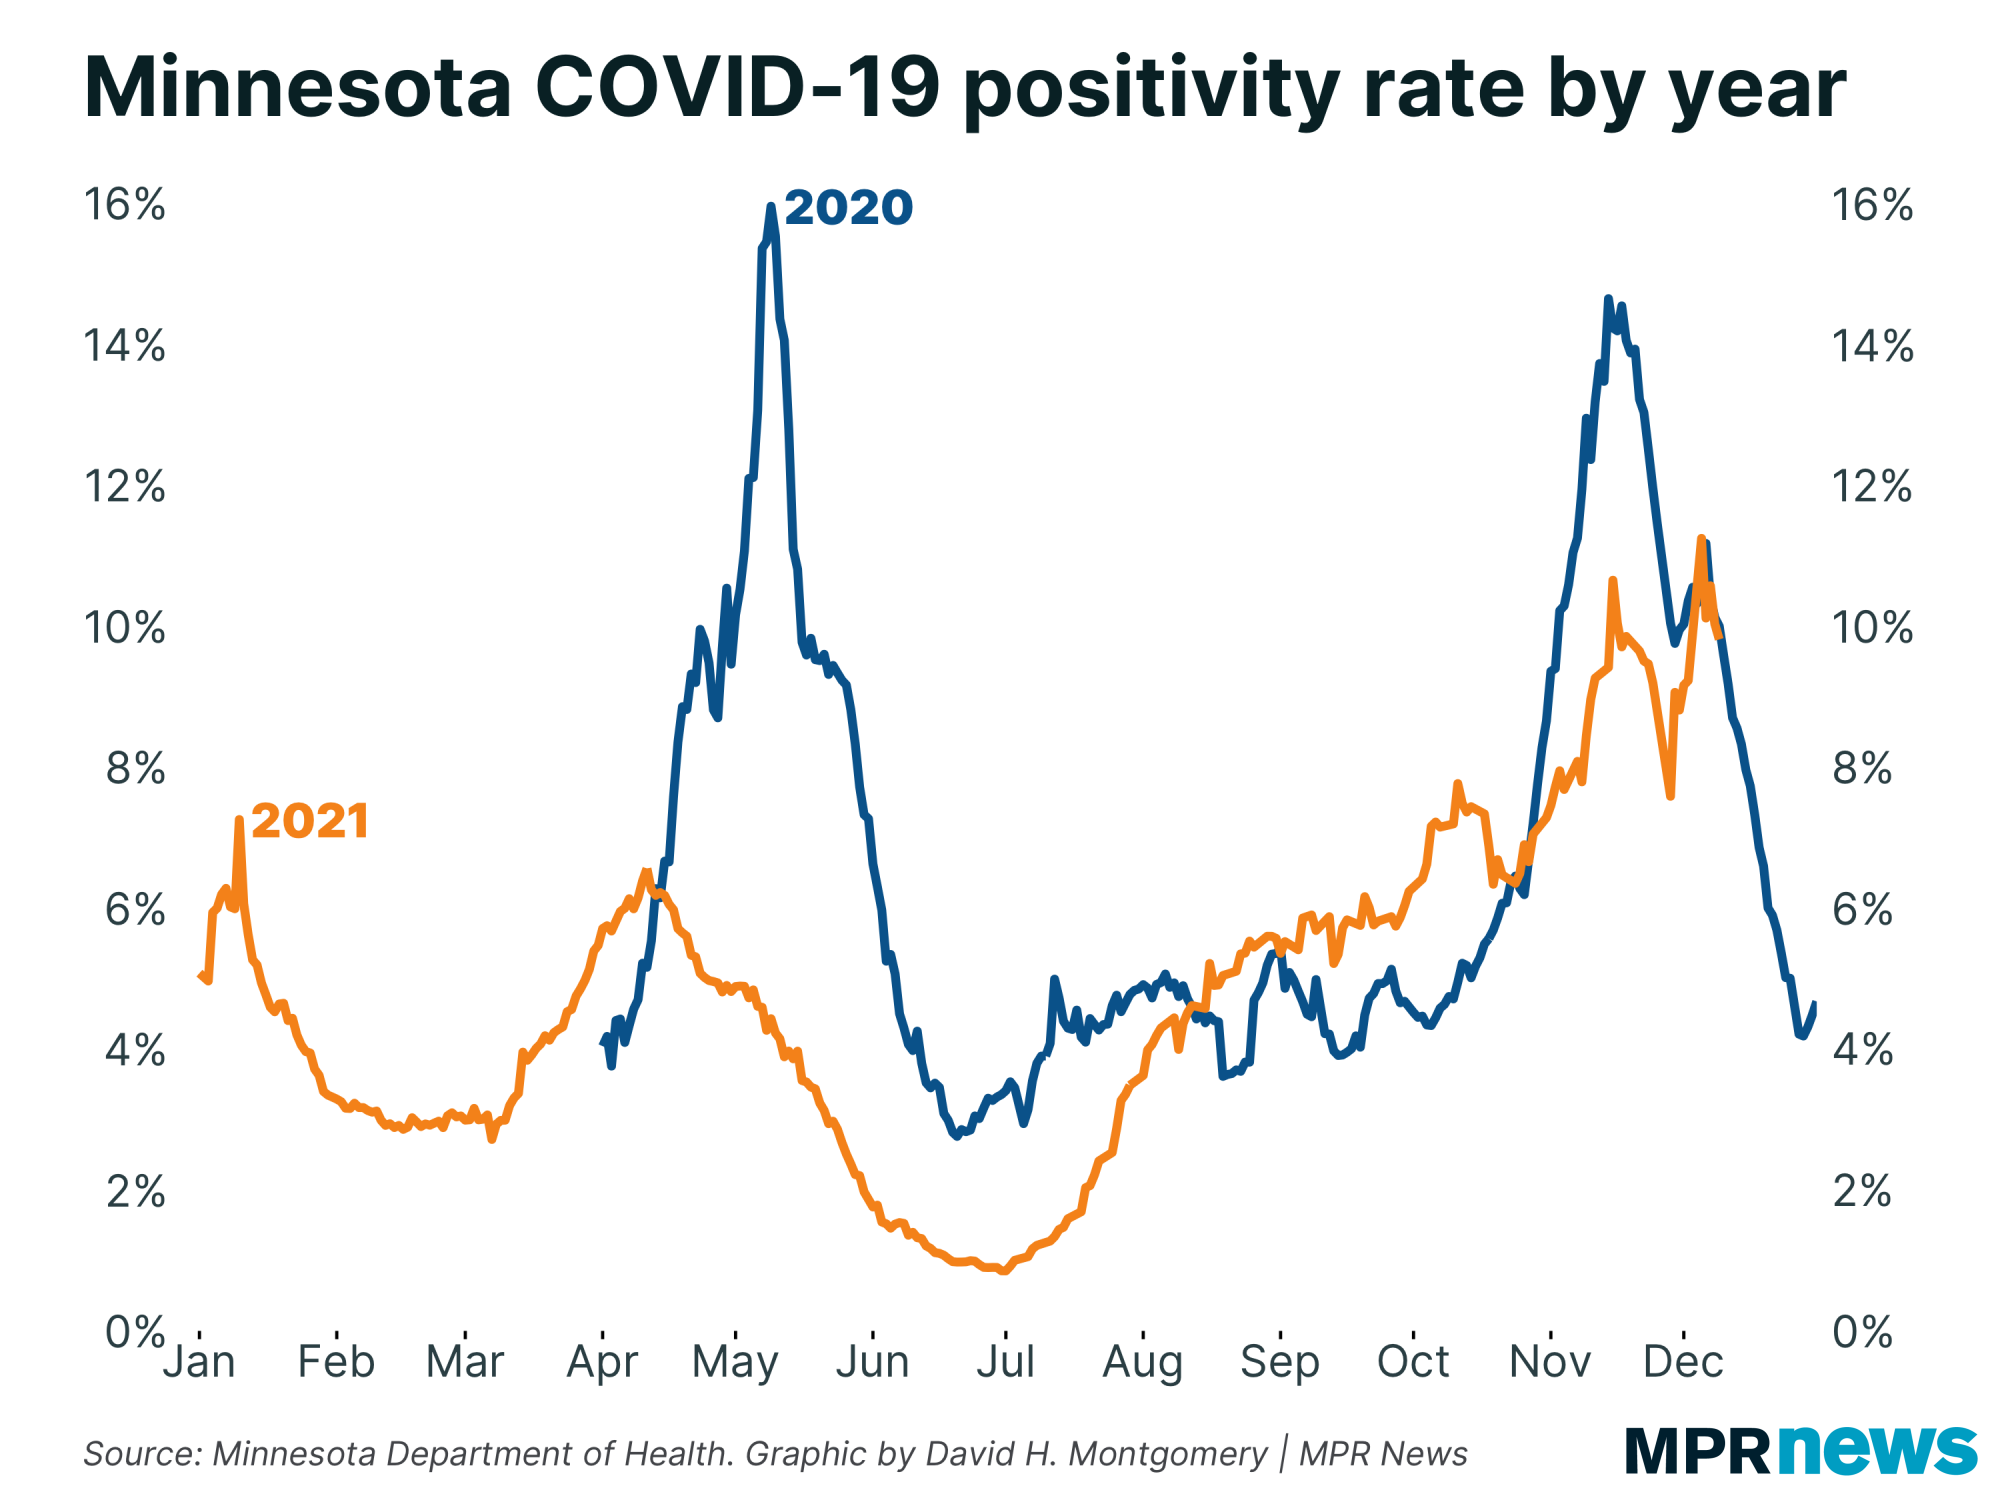
| The reflection of last fall's wave is even more uncanny with positivity rate. | | |
|
|
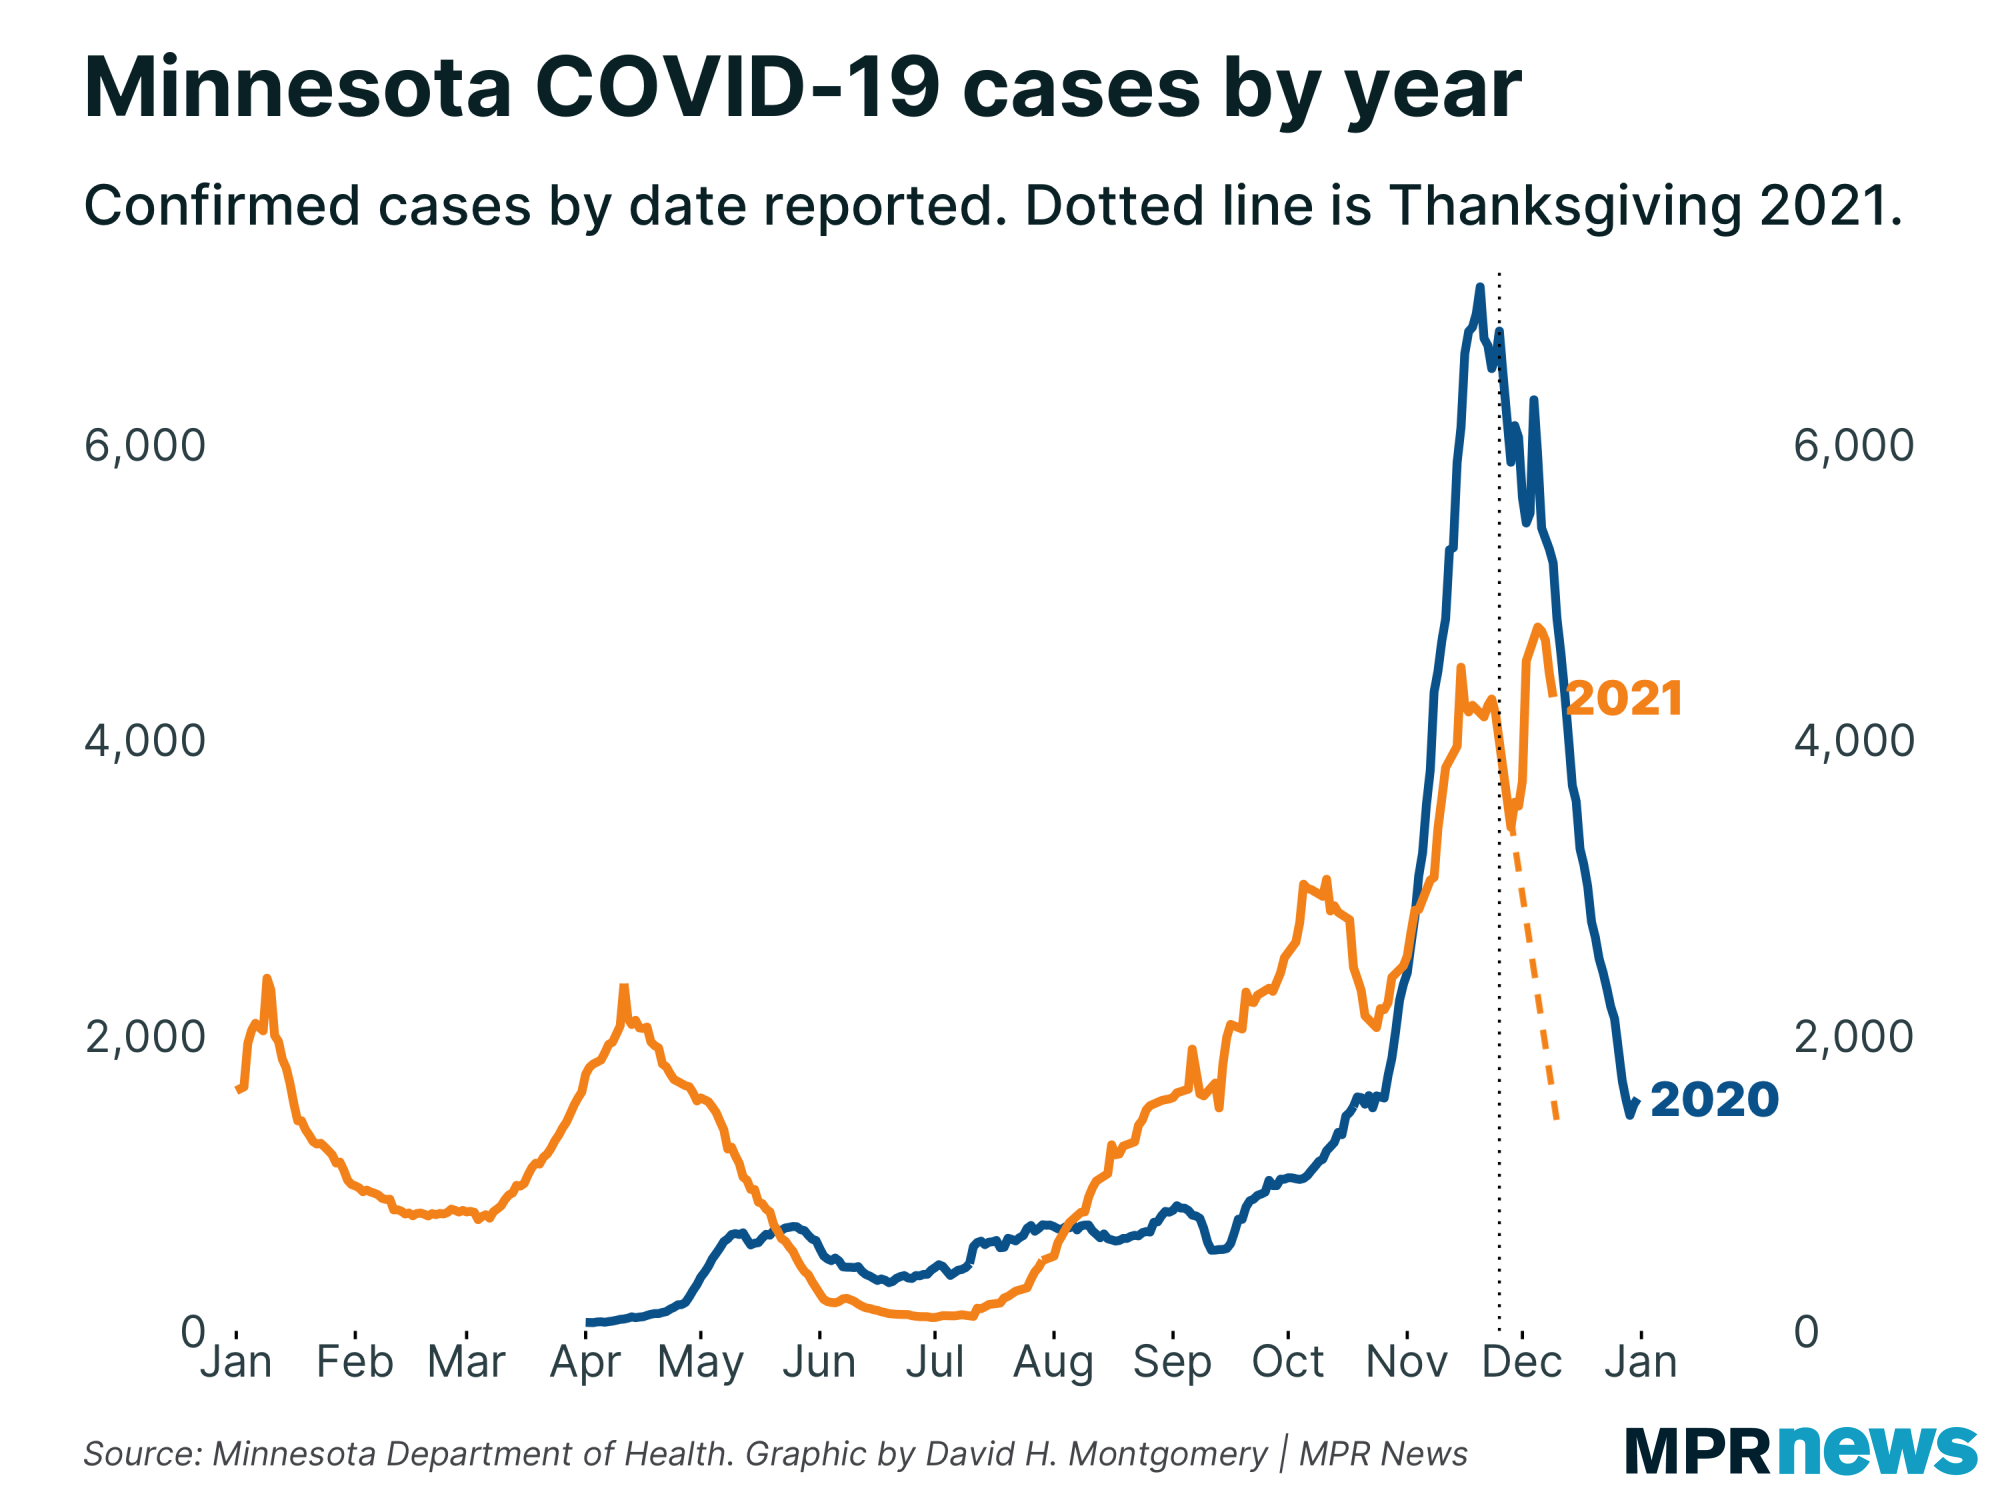
It's important to be careful interpreting this. First, the fact that last fall saw a brief, temporary Thanksgiving spike that we appear to be repeating is not a guarantee that we'll continue to repeat last year's trend.
Second, consider counterfactuals. If cases fall after holiday gatherings, that doesn't mean they wouldn't have fallen even faster without those holiday gatherings! So even if this Thanksgiving spike proves to be a temporary blip, a brief interruption to a long-term recovery from this endless wave — as we all hope it is — that could mean delaying an end to this wave by a week or two, with thousands more people infected than otherwise would have been. Witness this crude, unscientific markup extending the pre-Thanksgiving trend downward. |
| |
|
|
Don't make too much of this. My point is not to say whether you should or shouldn't meet people for holidays, only to urge against simplistic interpretations of the data. Whether COVID-19 stats move up or down is affected by lots of different factors, sometimes working at cross purposes.
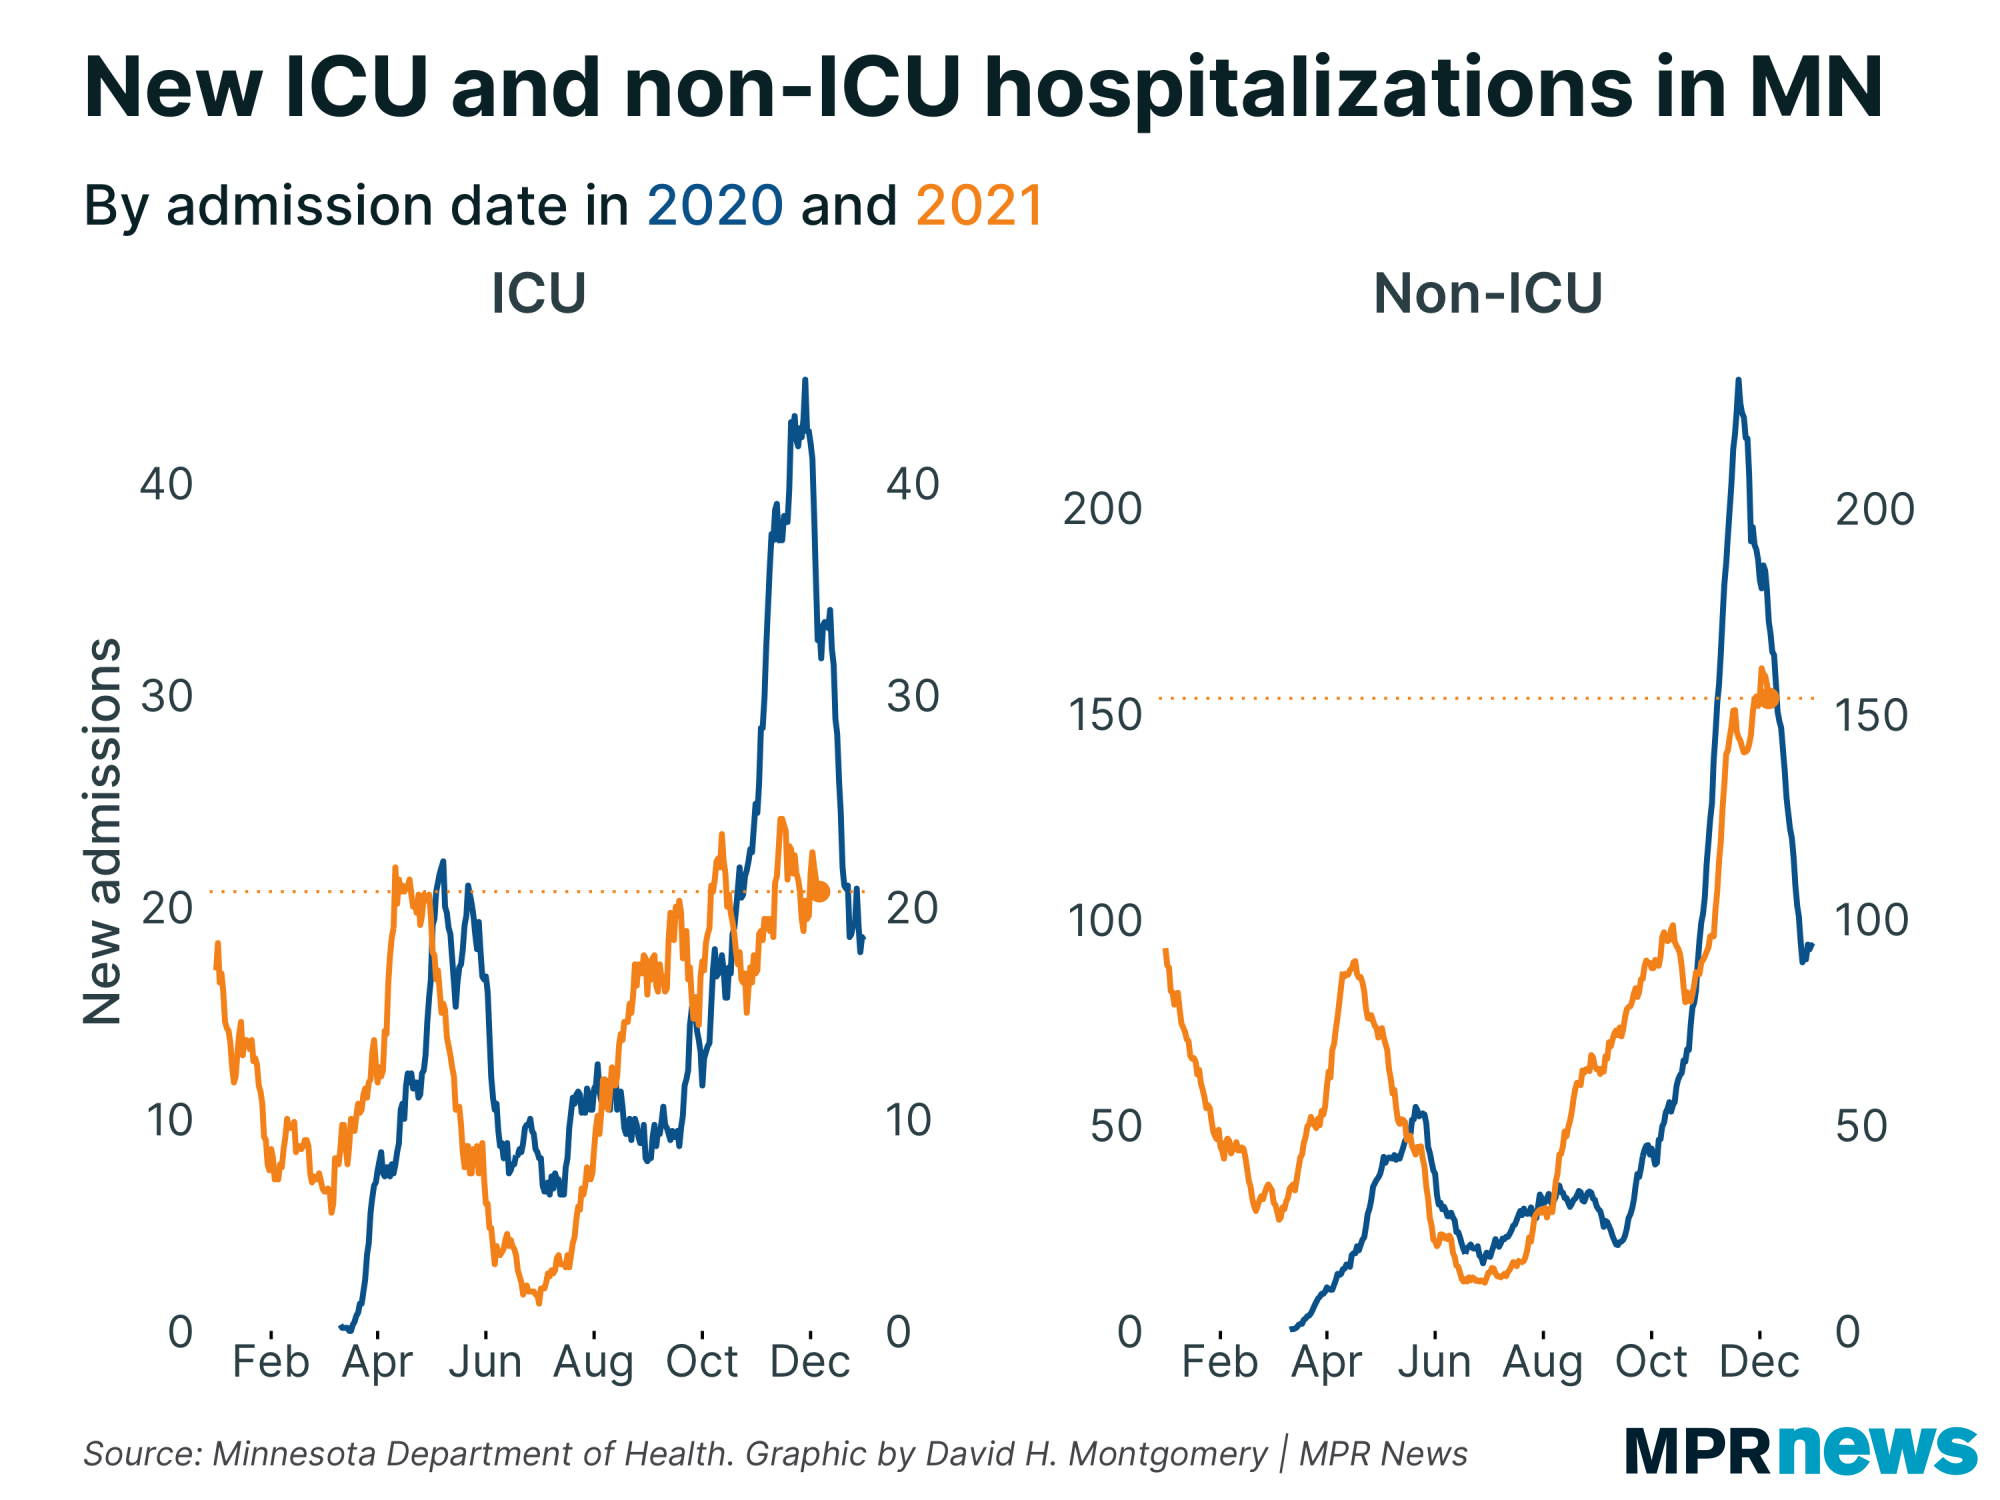
Moving on: This wave continues to include its plenty of severe, life-threatening COVID-19 cases, not merely mild infections. Hospitalizations are up dramatically since the start of November, and are still on the rise. |
| |
|
|
| Under the hood, though, there's some interesting changes from year to year. Non-ICU admissions have spiked sharply over the past month, partially mirroring the fall 2020 spike before slowing down of late. But ICU admissions have had no such jump (they surged in July and August but have been up and down since then), and are currently at just half the rate at this time last year. |
| |
|
|
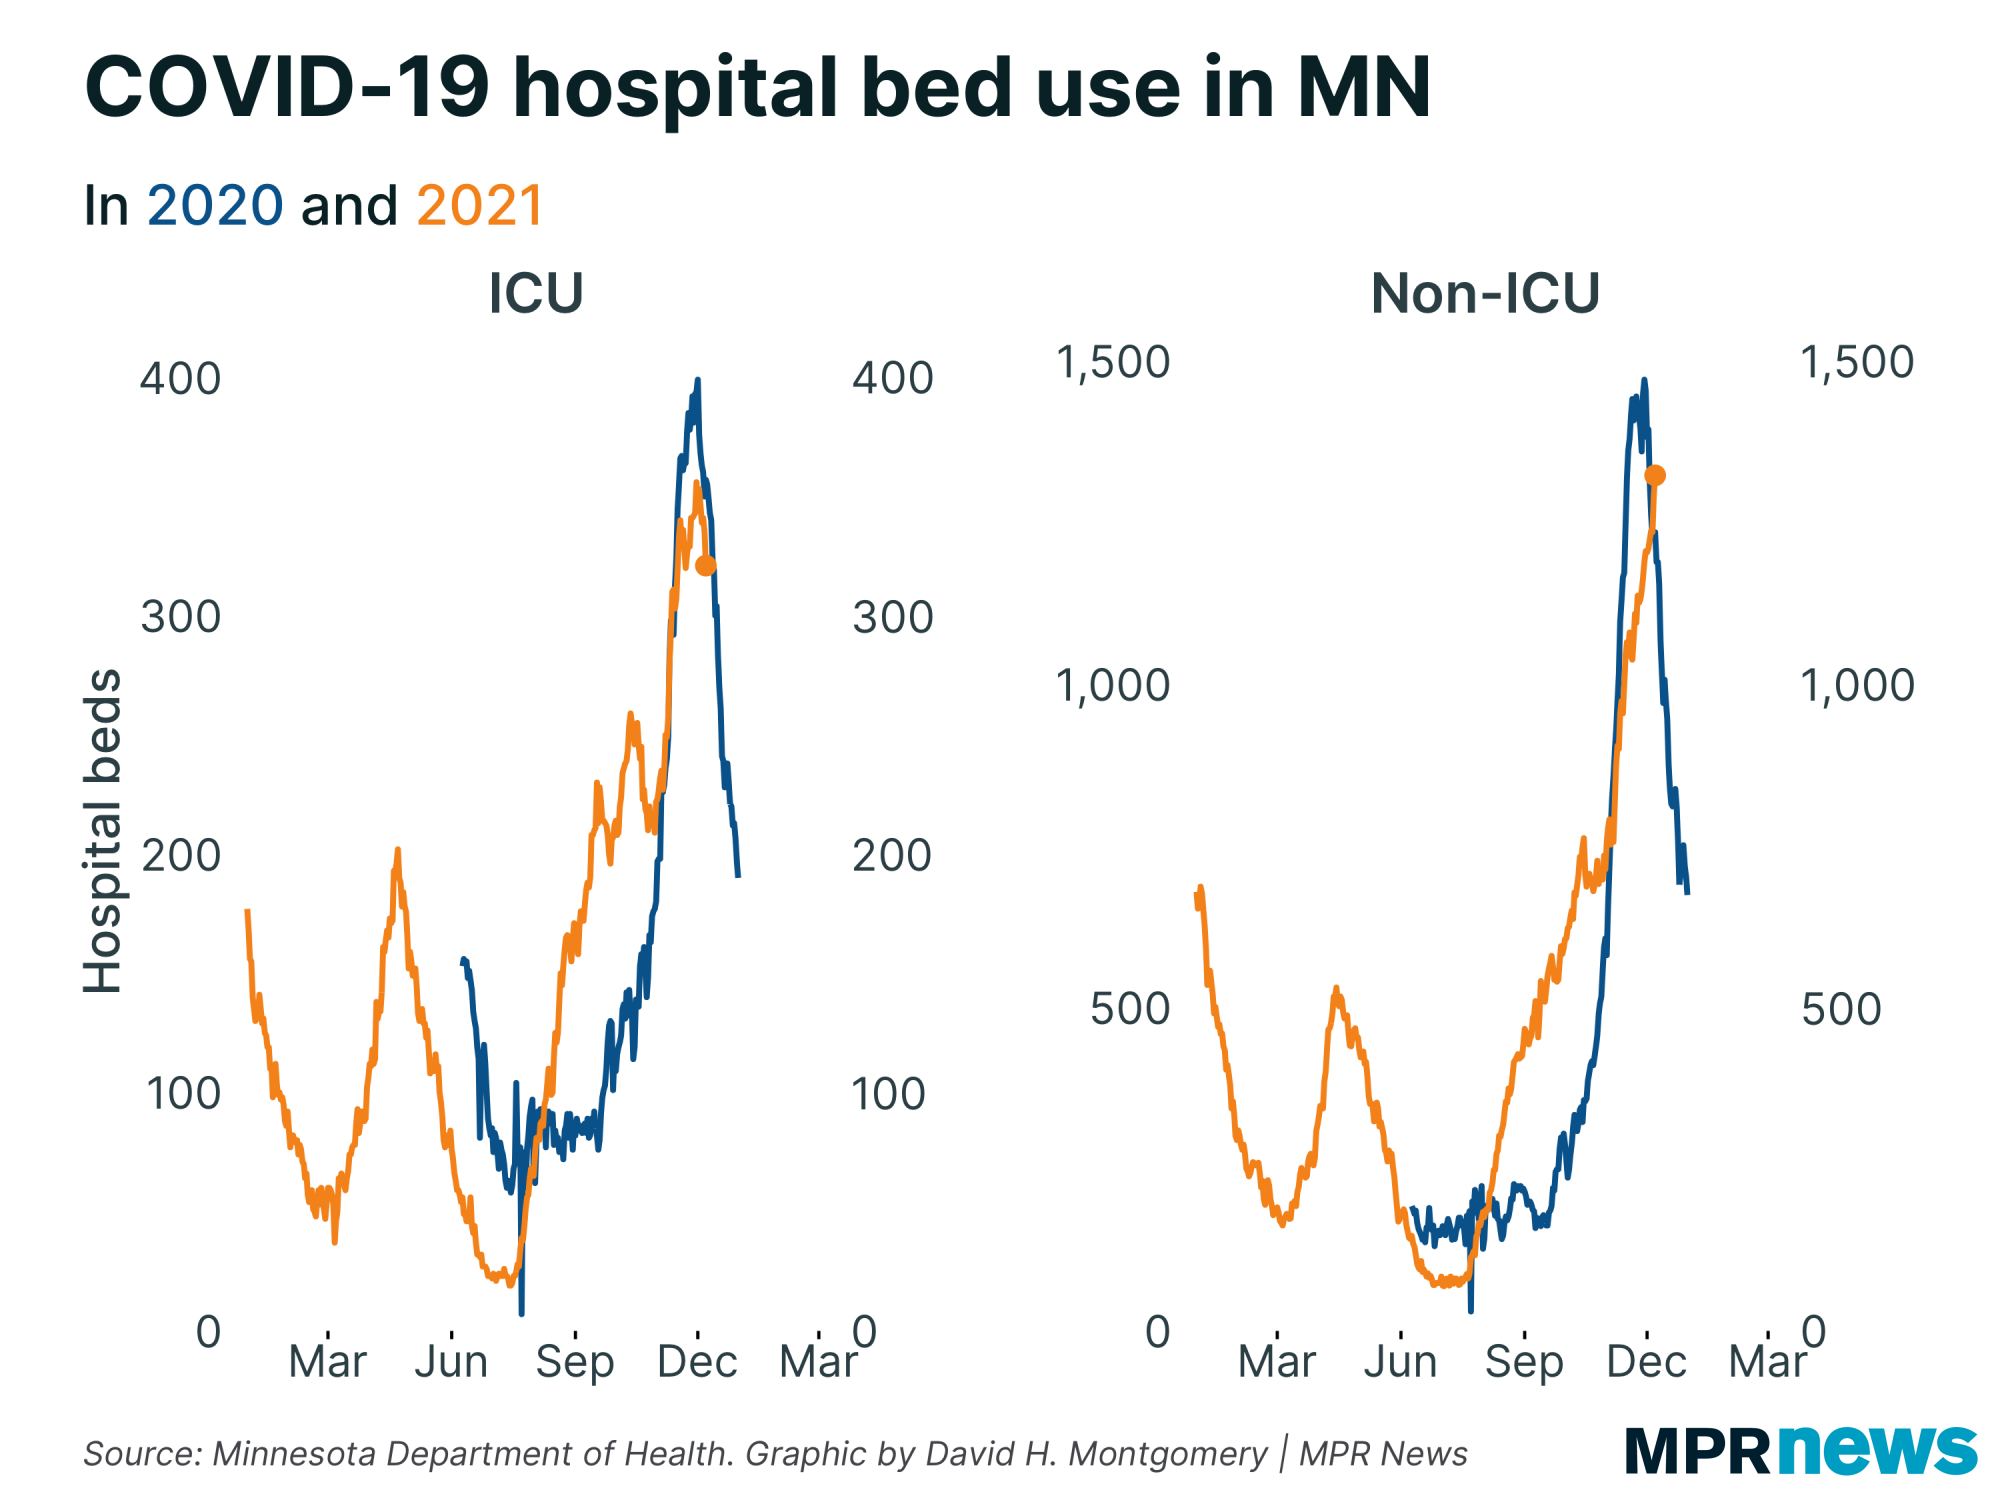
| More concerning than hospital admissions has been hospital bed use. Minnesota's hospital beds are almost entirely full, and bed-use rates are a much higher share of 2020's peak than admission rates are. | | |
|
|
In some ways, our current hospitalization surge is more concerning than last year's. In 2020, the rise in non-ICU COVID hospitalizations was much faster, and by this point was already on the downslope; in 2021 we're still rising.
What's behind these differences? When bed use is rising faster than admissions, that means hospital stay is increasing. That could be due to the virulence of the delta variant. (Another possibility: limited nursing home availability could be preventing some patients from being discharged.)
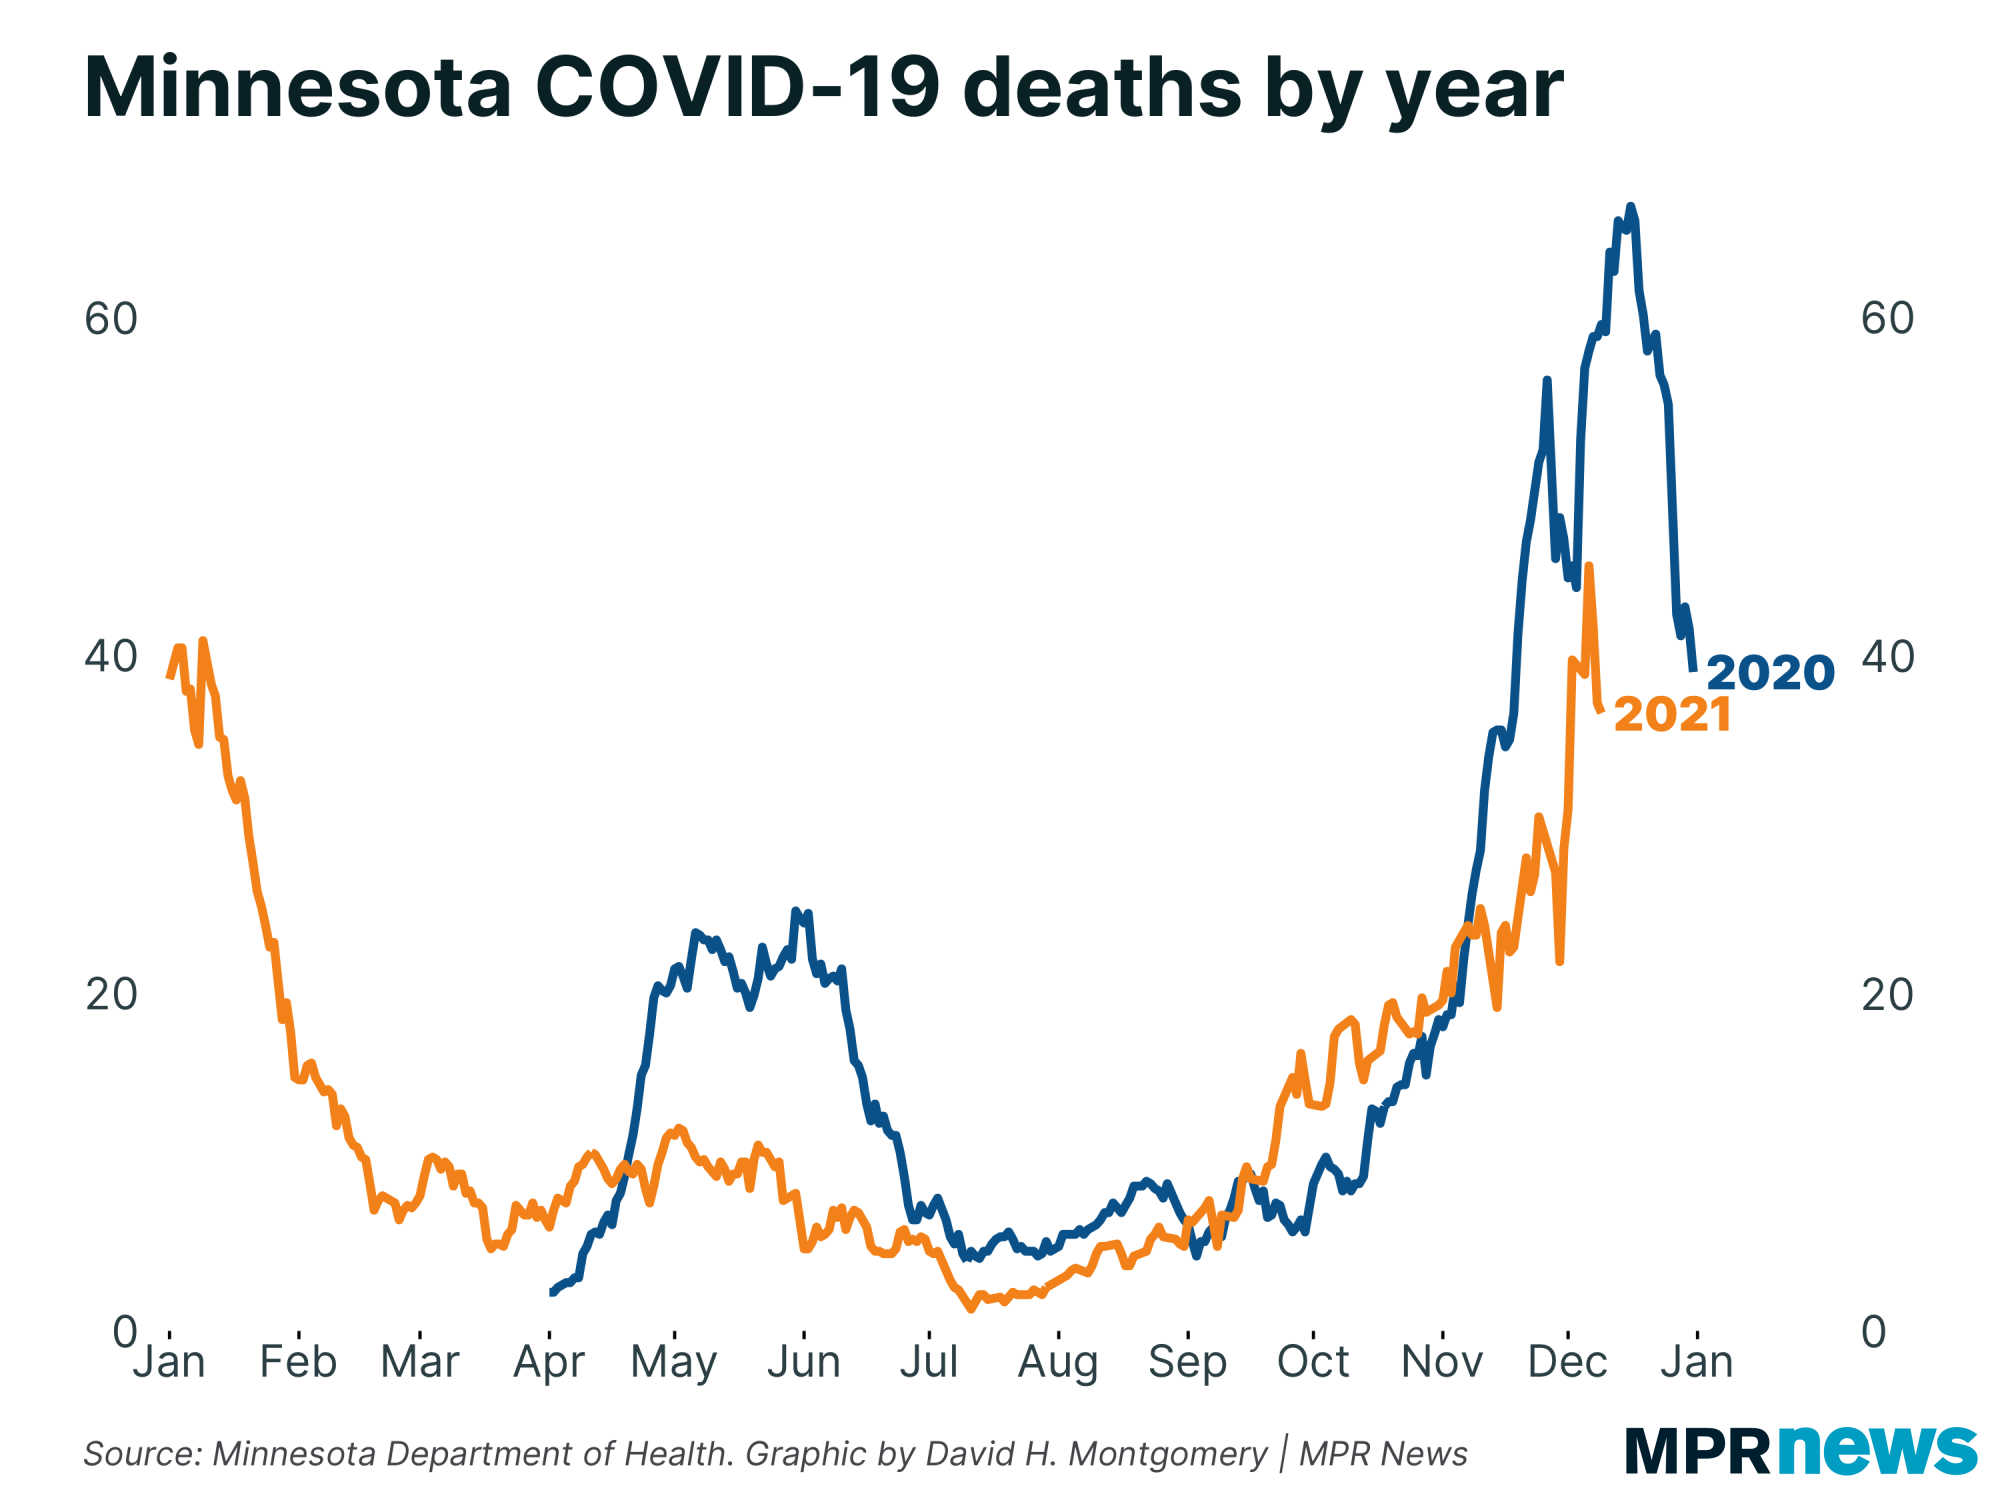
COVID-19 deaths remain extremely elevated, though not quite at last fall's levels. |
| |
|
|
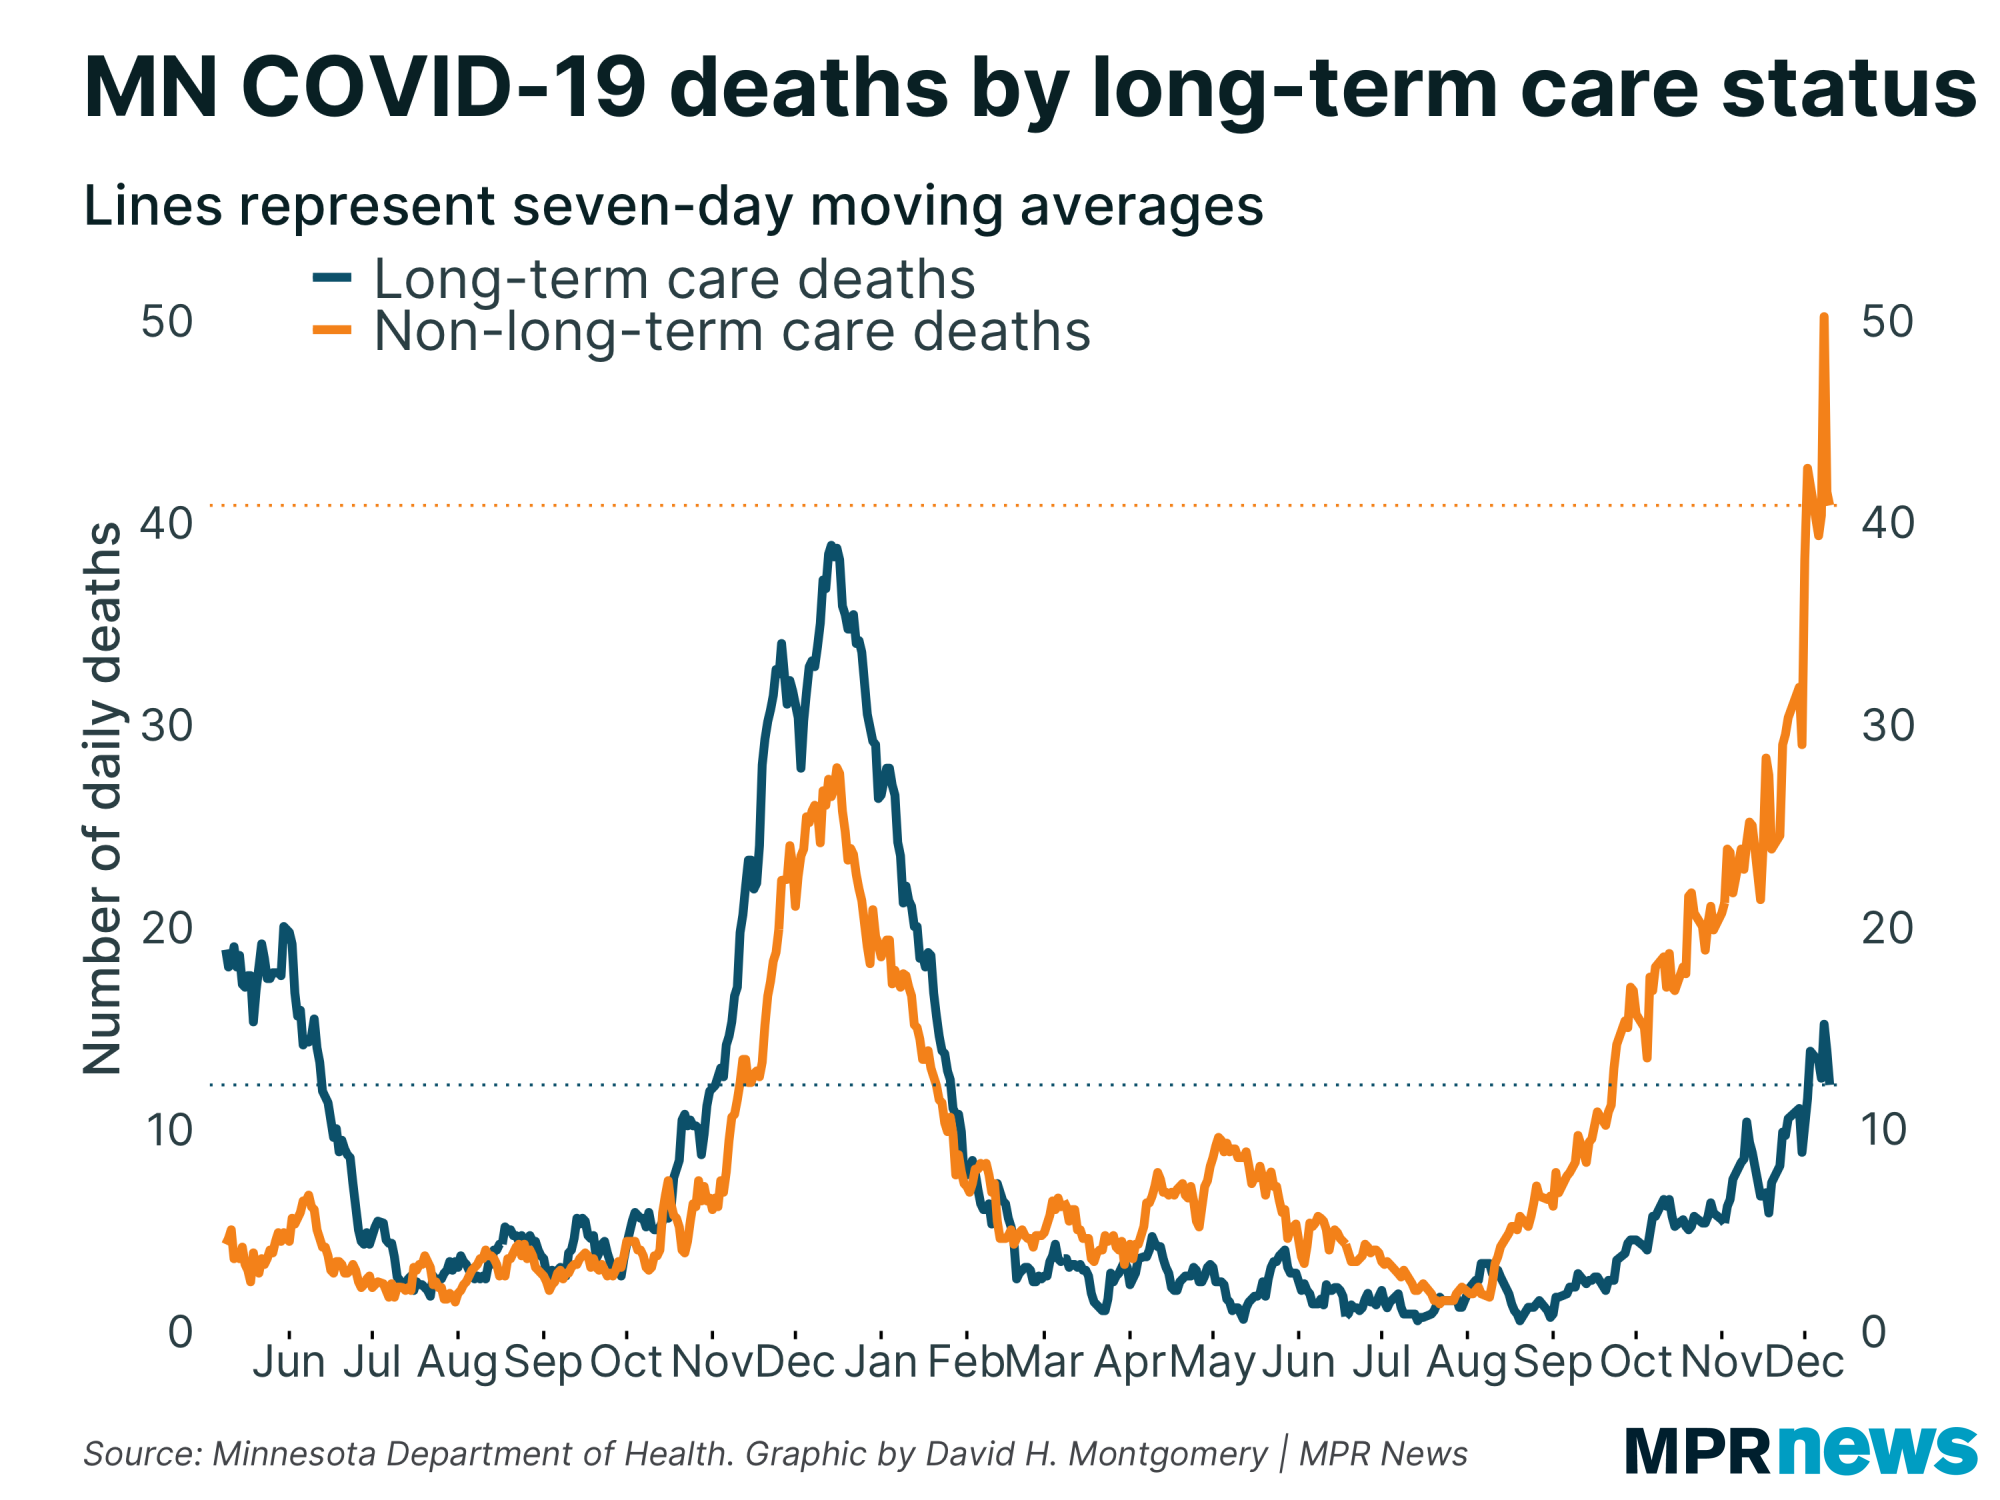
But there are some big differences beneath those top-line numbers. The death rate in 2020 was driven primarily by residents of nursing homes, many of whom were highly vulnerable.
But in 2021, the death rate among nursing home residents has been significantly reduced, probably largely due to vaccinations. Deaths among people living outside of long-term care, meanwhile, are at record highs. |
| |
|
|
Below, I'll explore a few more stats about Minnesota's COVID-19 outbreak. If you want to learn more, I also recommend these other articles:
| | |
|
|
| COVID continues to disproportionately impact the unvaccinated | A month ago, I shared data on COVID-19 breakthrough cases, showing that adjusted for age and population size, vaccinated Minnesotans have been much less likely to get COVID, be hospitalized with it or die from it.
An extra month of data shows that to still be true. The unvaccinated are about 16 times more likely to die from COVID-19 or be hospitalized with it, and about four times more likely to catch it. |
| |
|
|
Cases fall in western Minnesota
|
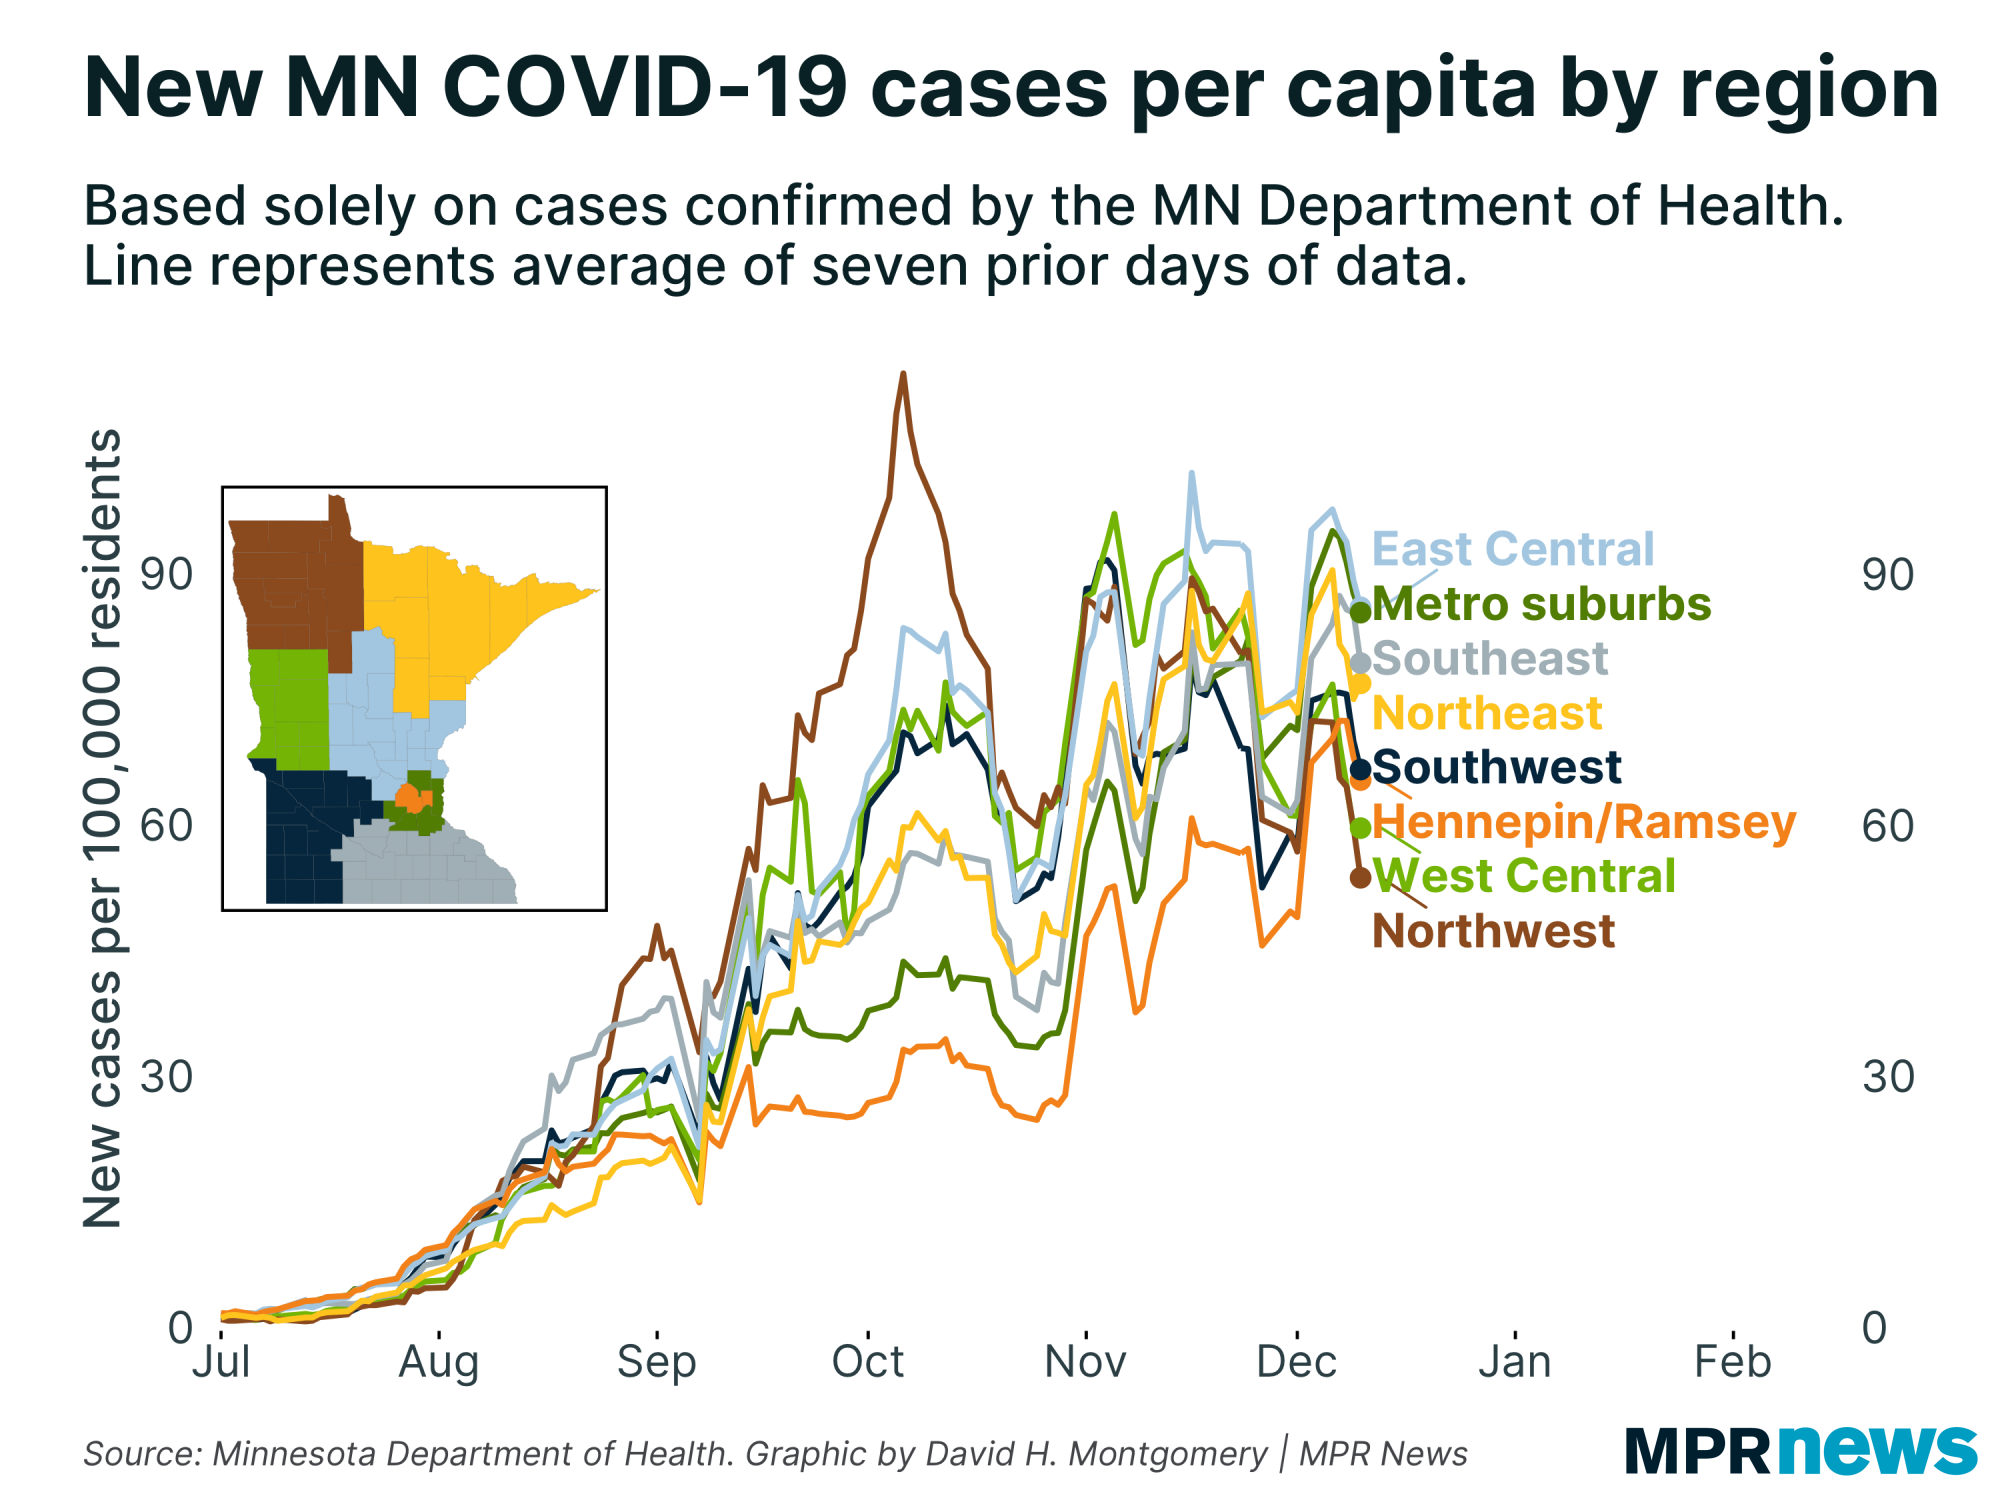
Also last time, I reported how the parts of Minnesota with the lowest vaccination rates had the most cases, and the most-vaccinated areas had the fewest cases.
That's no longer really the case. Over the past week, cases have plunged in hard-hit, less-vaccinated western Minnesota; these regions now have the lowest per capita COVID-19 rates in the state.
Meanwhile cases have risen in the Twin Cities metro, and especially in the suburban counties, which now have some of the highest rates in the state. |
| |
|
|
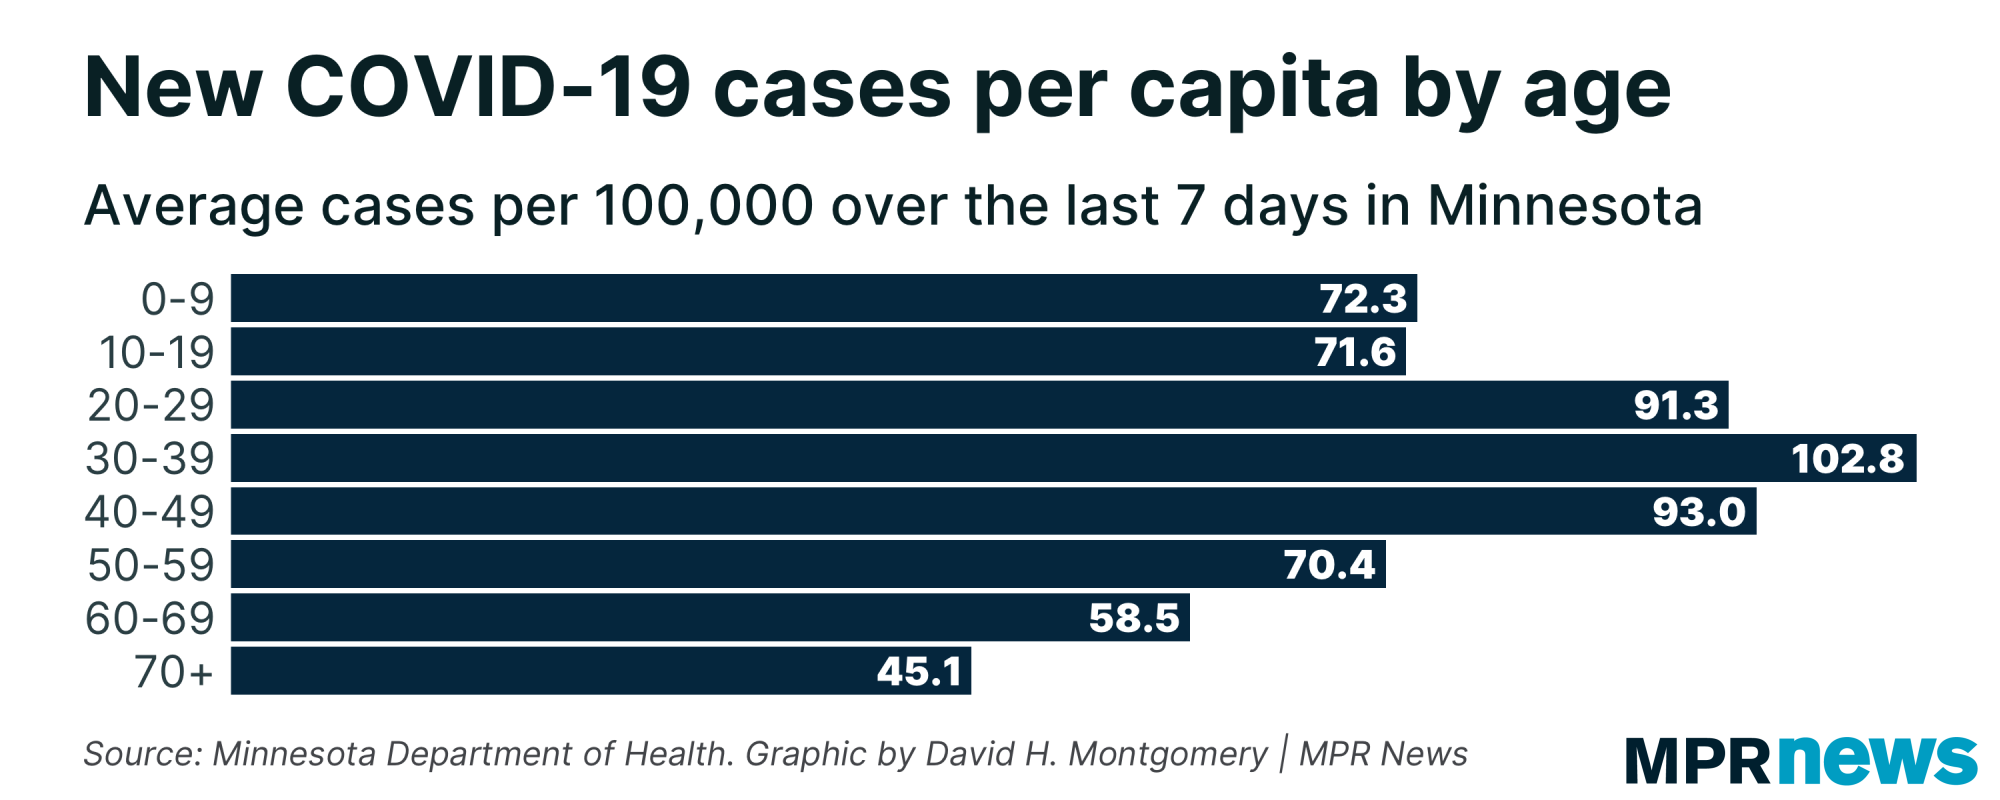
| Meanwhile, adults in their 30s are currently the hardest-hit age group for COVID-19 cases, with prevalence declining for every age bracket up from 30-39. (In general, vaccination rates rise as people get older.) | | |
|
|
What's happening next?
|
Next week we'll hopefully see cases continue to fall, and if we're really lucky hospitalizations start to decline, too.
But I'm not counting my chickens yet. We've had at least two false peaks so far this wave, one in October and one right before Thanksgiving, plus that period in August when case growth slowed dramatically like we were about to peak, but then found another gear.
Hopefully we don't get the football yanked out from under us again. I'm just holding back from any predictions.
Thanks for subscribing to this newsletter and for all of you who've sent me your feedback. As always, if you like this newsletter, please share it and the sign-up link with others who you think might enjoy it.
— David |
| |
|
|
Preference Center ❘ Unsubscribe You received this email because you subscribed or it was sent to you by a friend. This email was sent by: %%Member_Busname%%
%%Member_Addr%% %%Member_City%%, %%Member_State%%, %%Member_PostalCode%%
  |
|
|
| | |