| Welcome back to COVID in Minnesota TODAY, an email newsletter from MPR News about understanding the latest developments in Minnesota's COVID-19 outbreak. | | |
|
|
Cases, hospitalizations and deaths are all rising unabated in Minnesota. Their actual levels still aren't that bad compared to past waves and what other places have experienced. But we don't know whether our fourth wave will stay mild, or whether it will accelerate to be more like other places.
But this week I think I can do more than just throw up my hands and shrug. I've crunched the data and I've got a hypothesis: Minnesota's fourth COVID-19 wave will peak in about two weeks.
Will I be right here? No idea! My hypothesis is based on extrapolating current trends, informed by past observations. But there's no guarantee that this fourth wave, fueled by a mutated variant of the virus, will behave like past waves did. And it's possible I'm being deluded here by my hope that this wave will peak soon — I always try to be skeptical when what I think will happen lines up with what I want to happen.
Below, I'll lay out my arguments and you can judge for yourself. And then in about two weeks, I'll check back to see if I was right. |
| |
|
|
Three things to know
| - More Minnesotans are getting vaccinated as cases, incentives and mandates mount
- Cases and other metrics are still rising, but there are some signs the growth rate may be decelerating
- If current trends continue, Minnesota might see its current wave peak in mid-August
|
| |
|
|
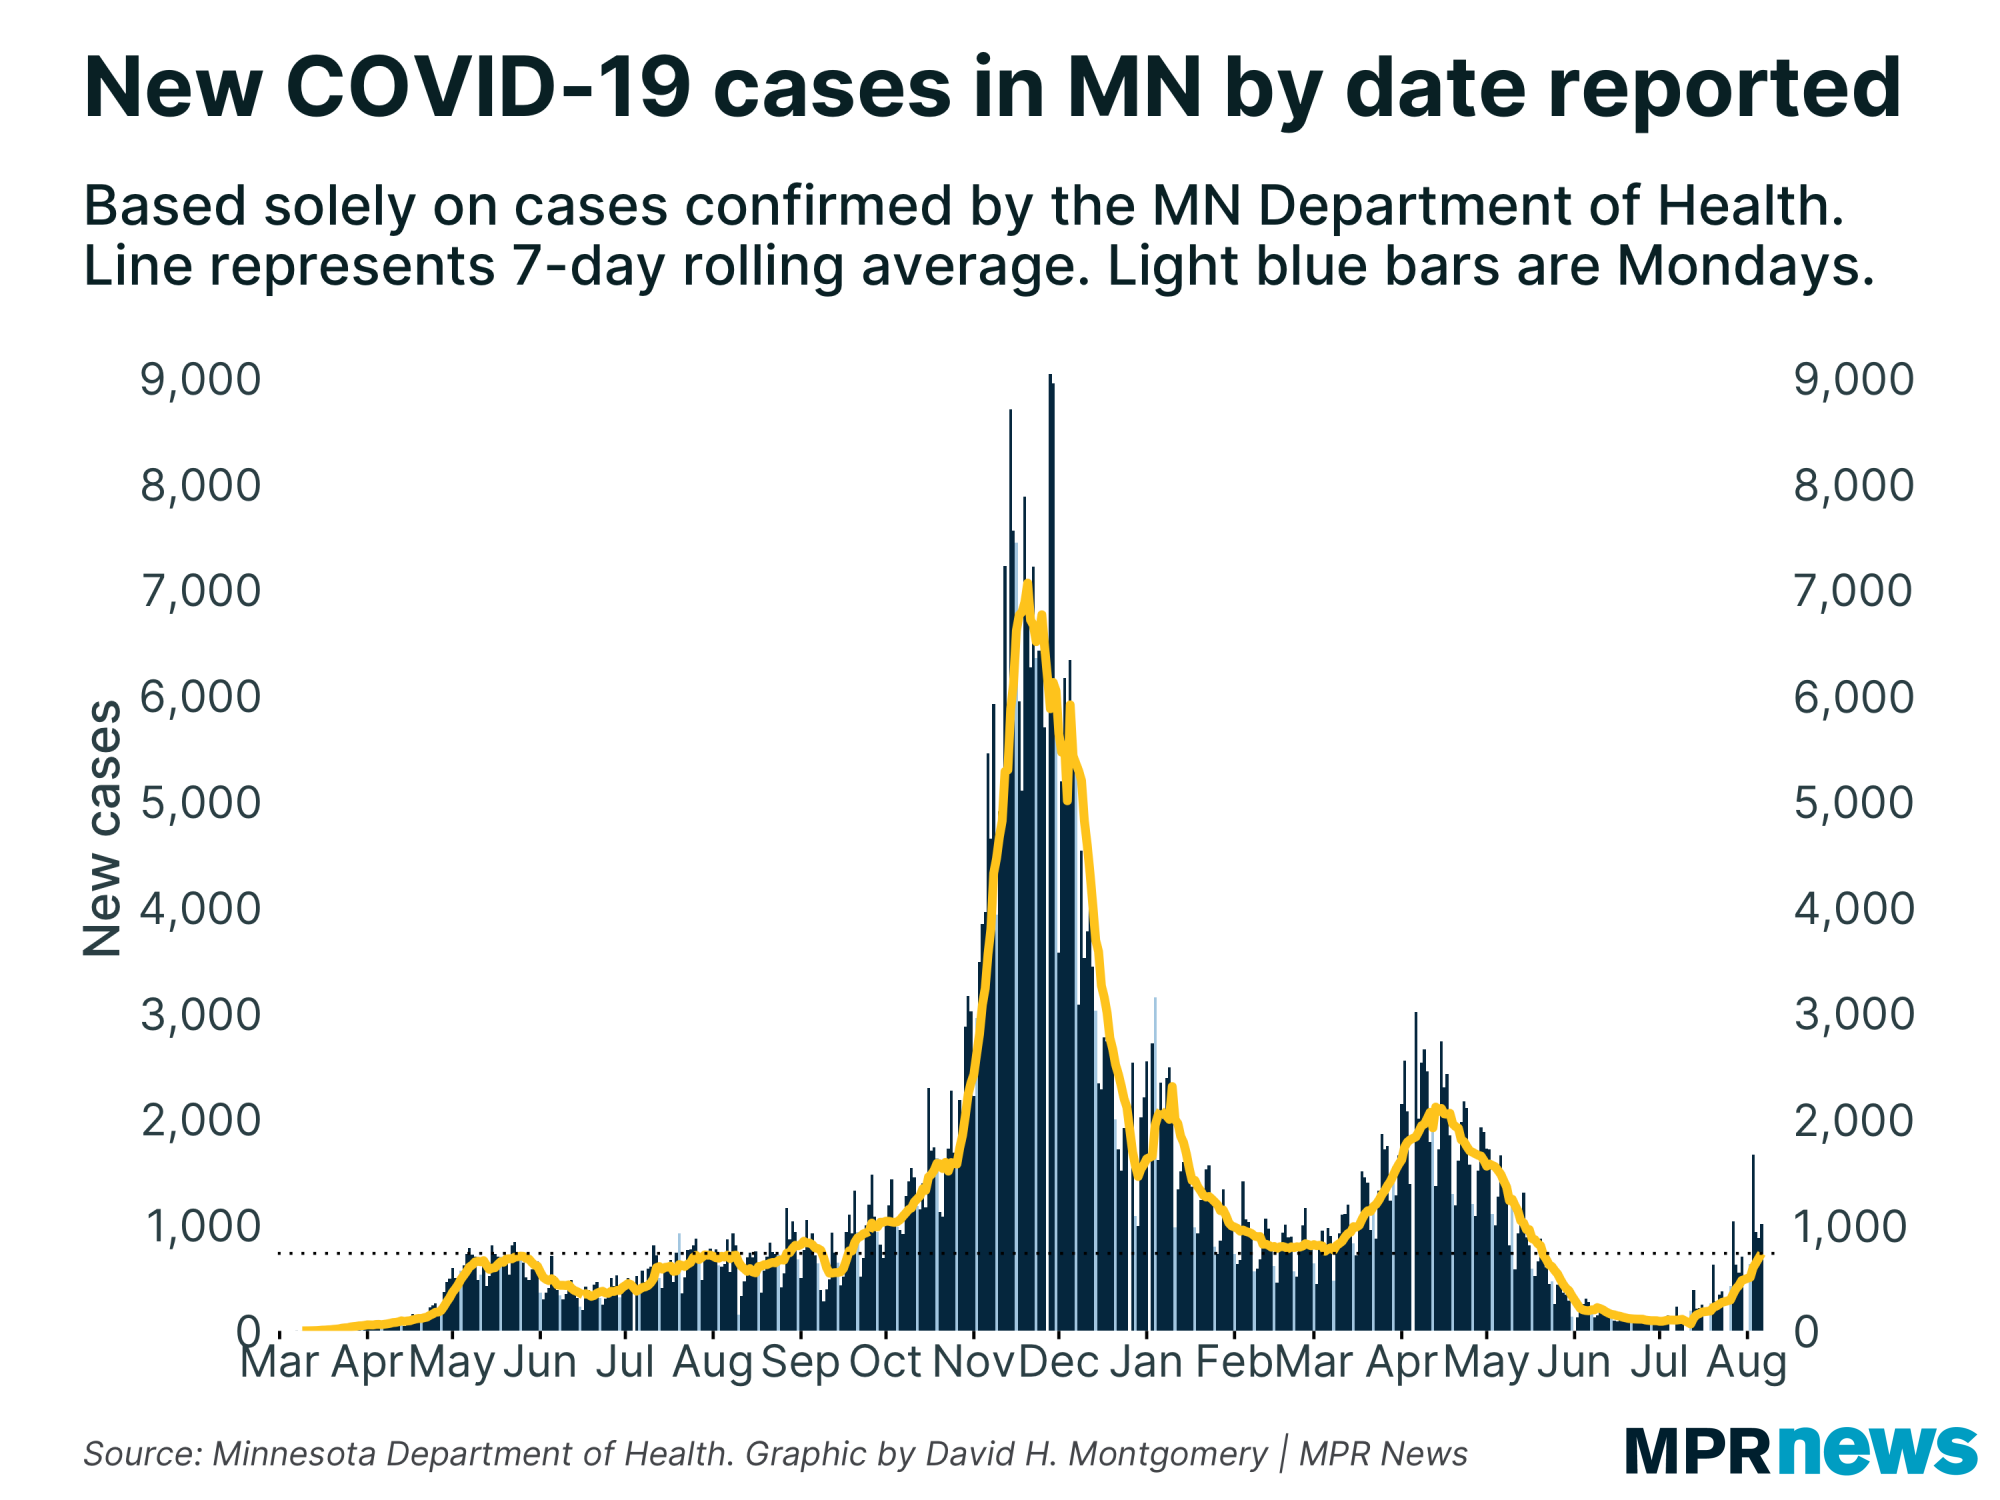
| Let's start by setting the stage. Minnesota's case counts started rising in the beginning of July; they're still going up steadily. The rate has varied a little, but to the naked eye, there have been no major changes lately — either for the worse (a sudden acceleration) or the better (a plateauing or peak). | |
|
|
|
We're up to more than 700 newly reported cases per day, on average. That's comparable to the lows we got to back in February and March, and far below the levels recorded in the last two waves.
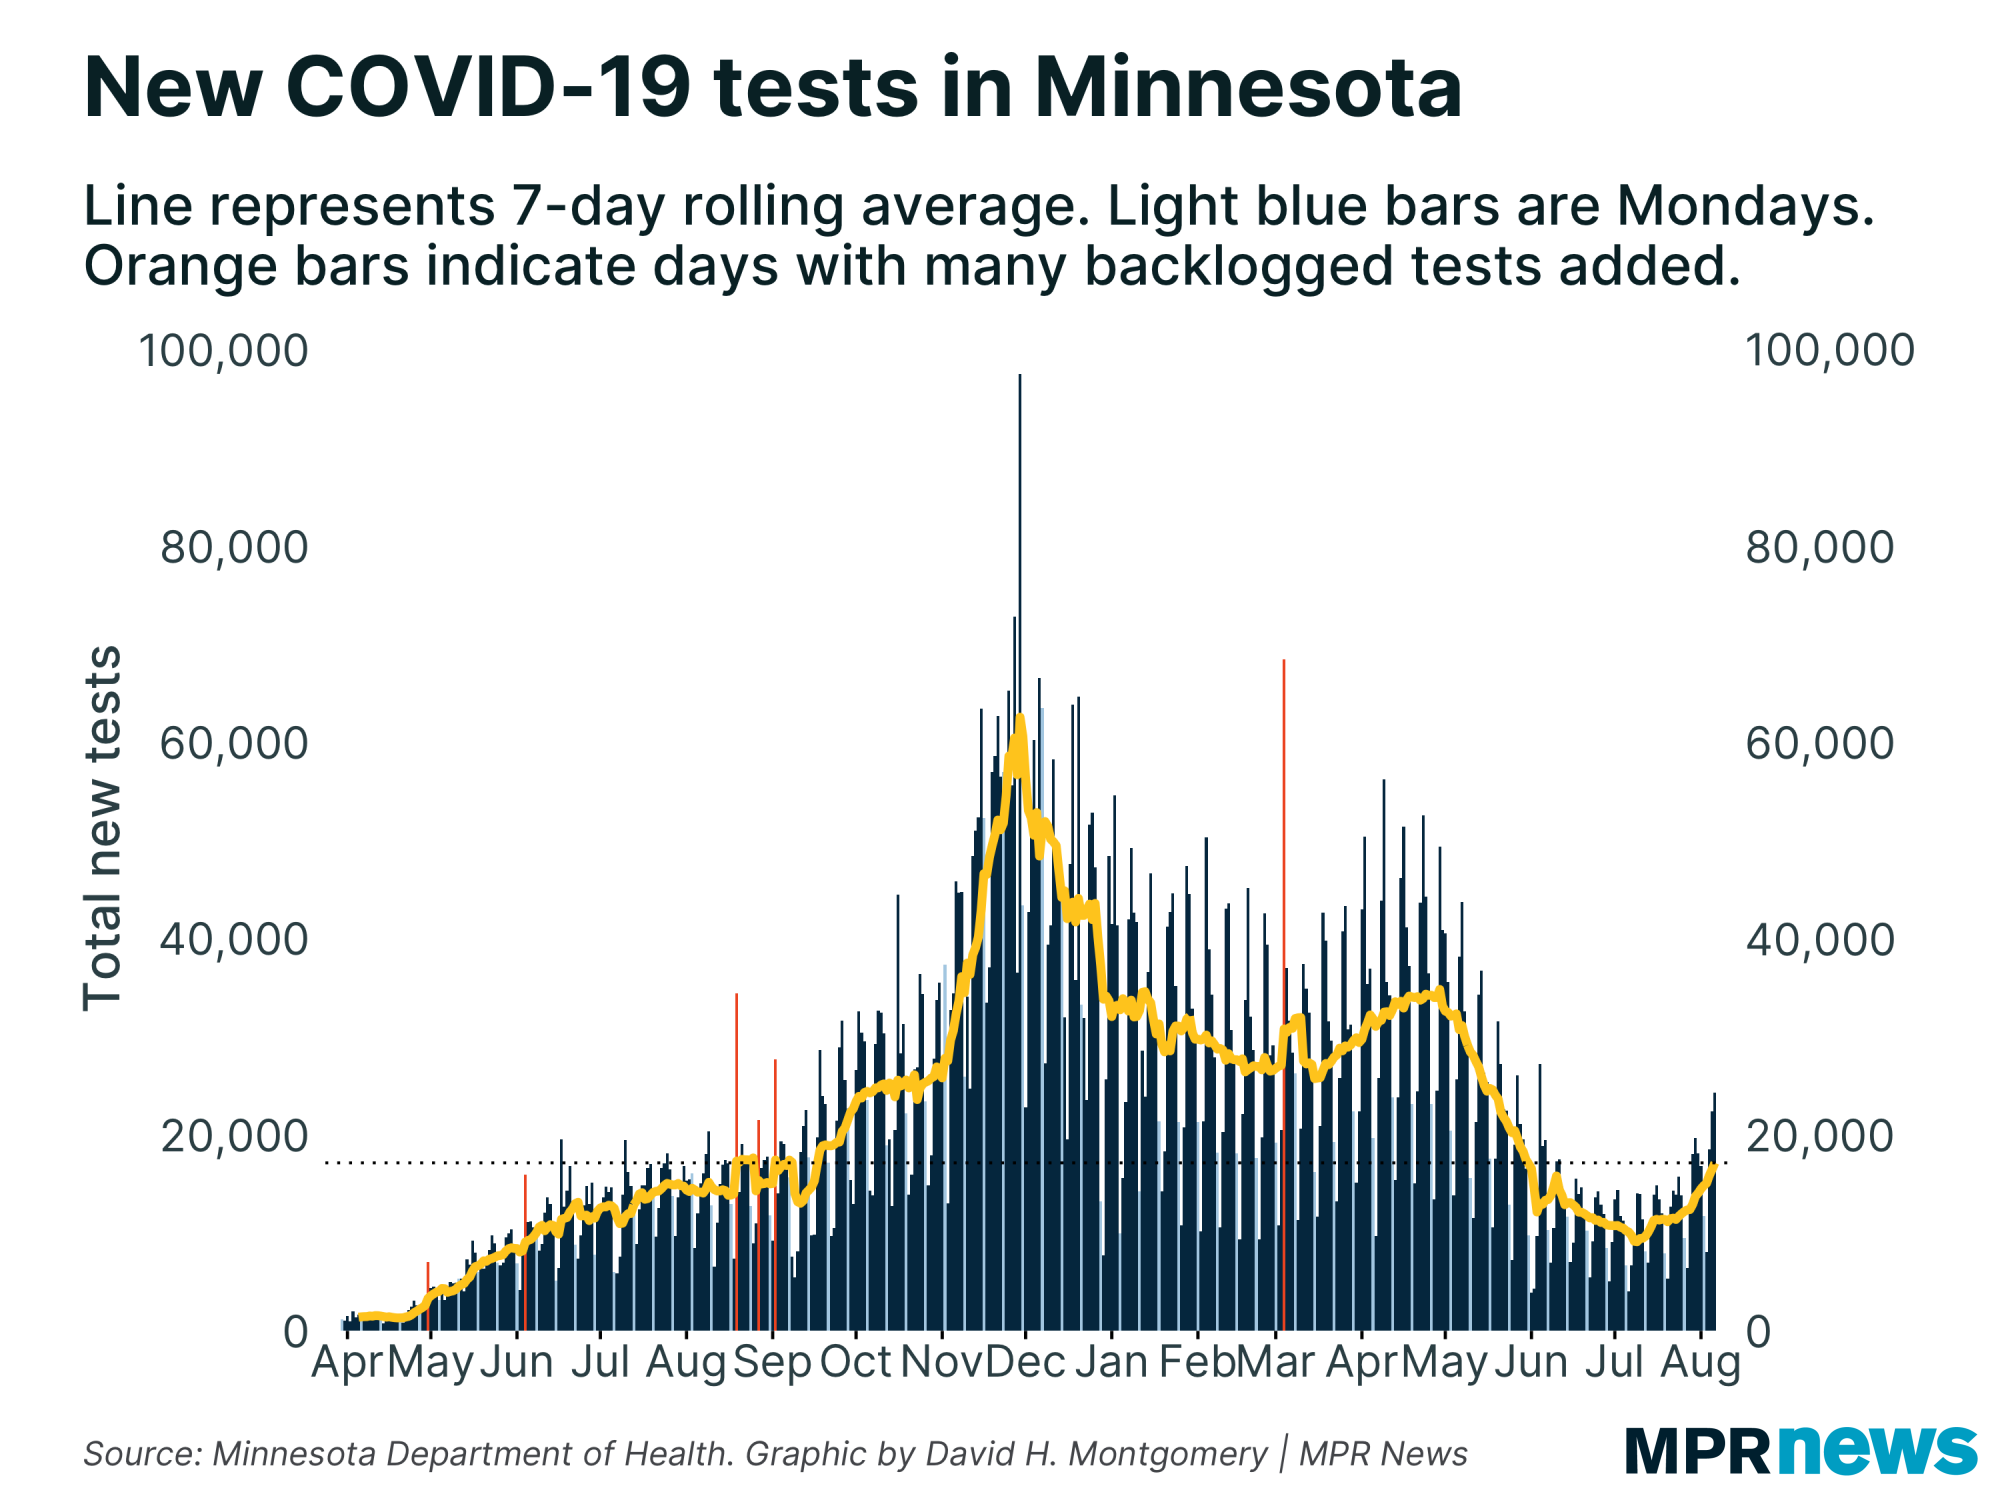
But it's important to keep in mind that testing levels are lower than they used to be, too. | |
|
|
|
The relationship between infections, testing volume and case rates is a dynamic and complicated one:
- Case counts go up when infections go up
- Confirmed cases also tend to go up when testing volume does, because we find a larger share of infections
- But testing volume also rises when infections go up, because when more people have COVID symptoms (or encounter people who do), more people get tested
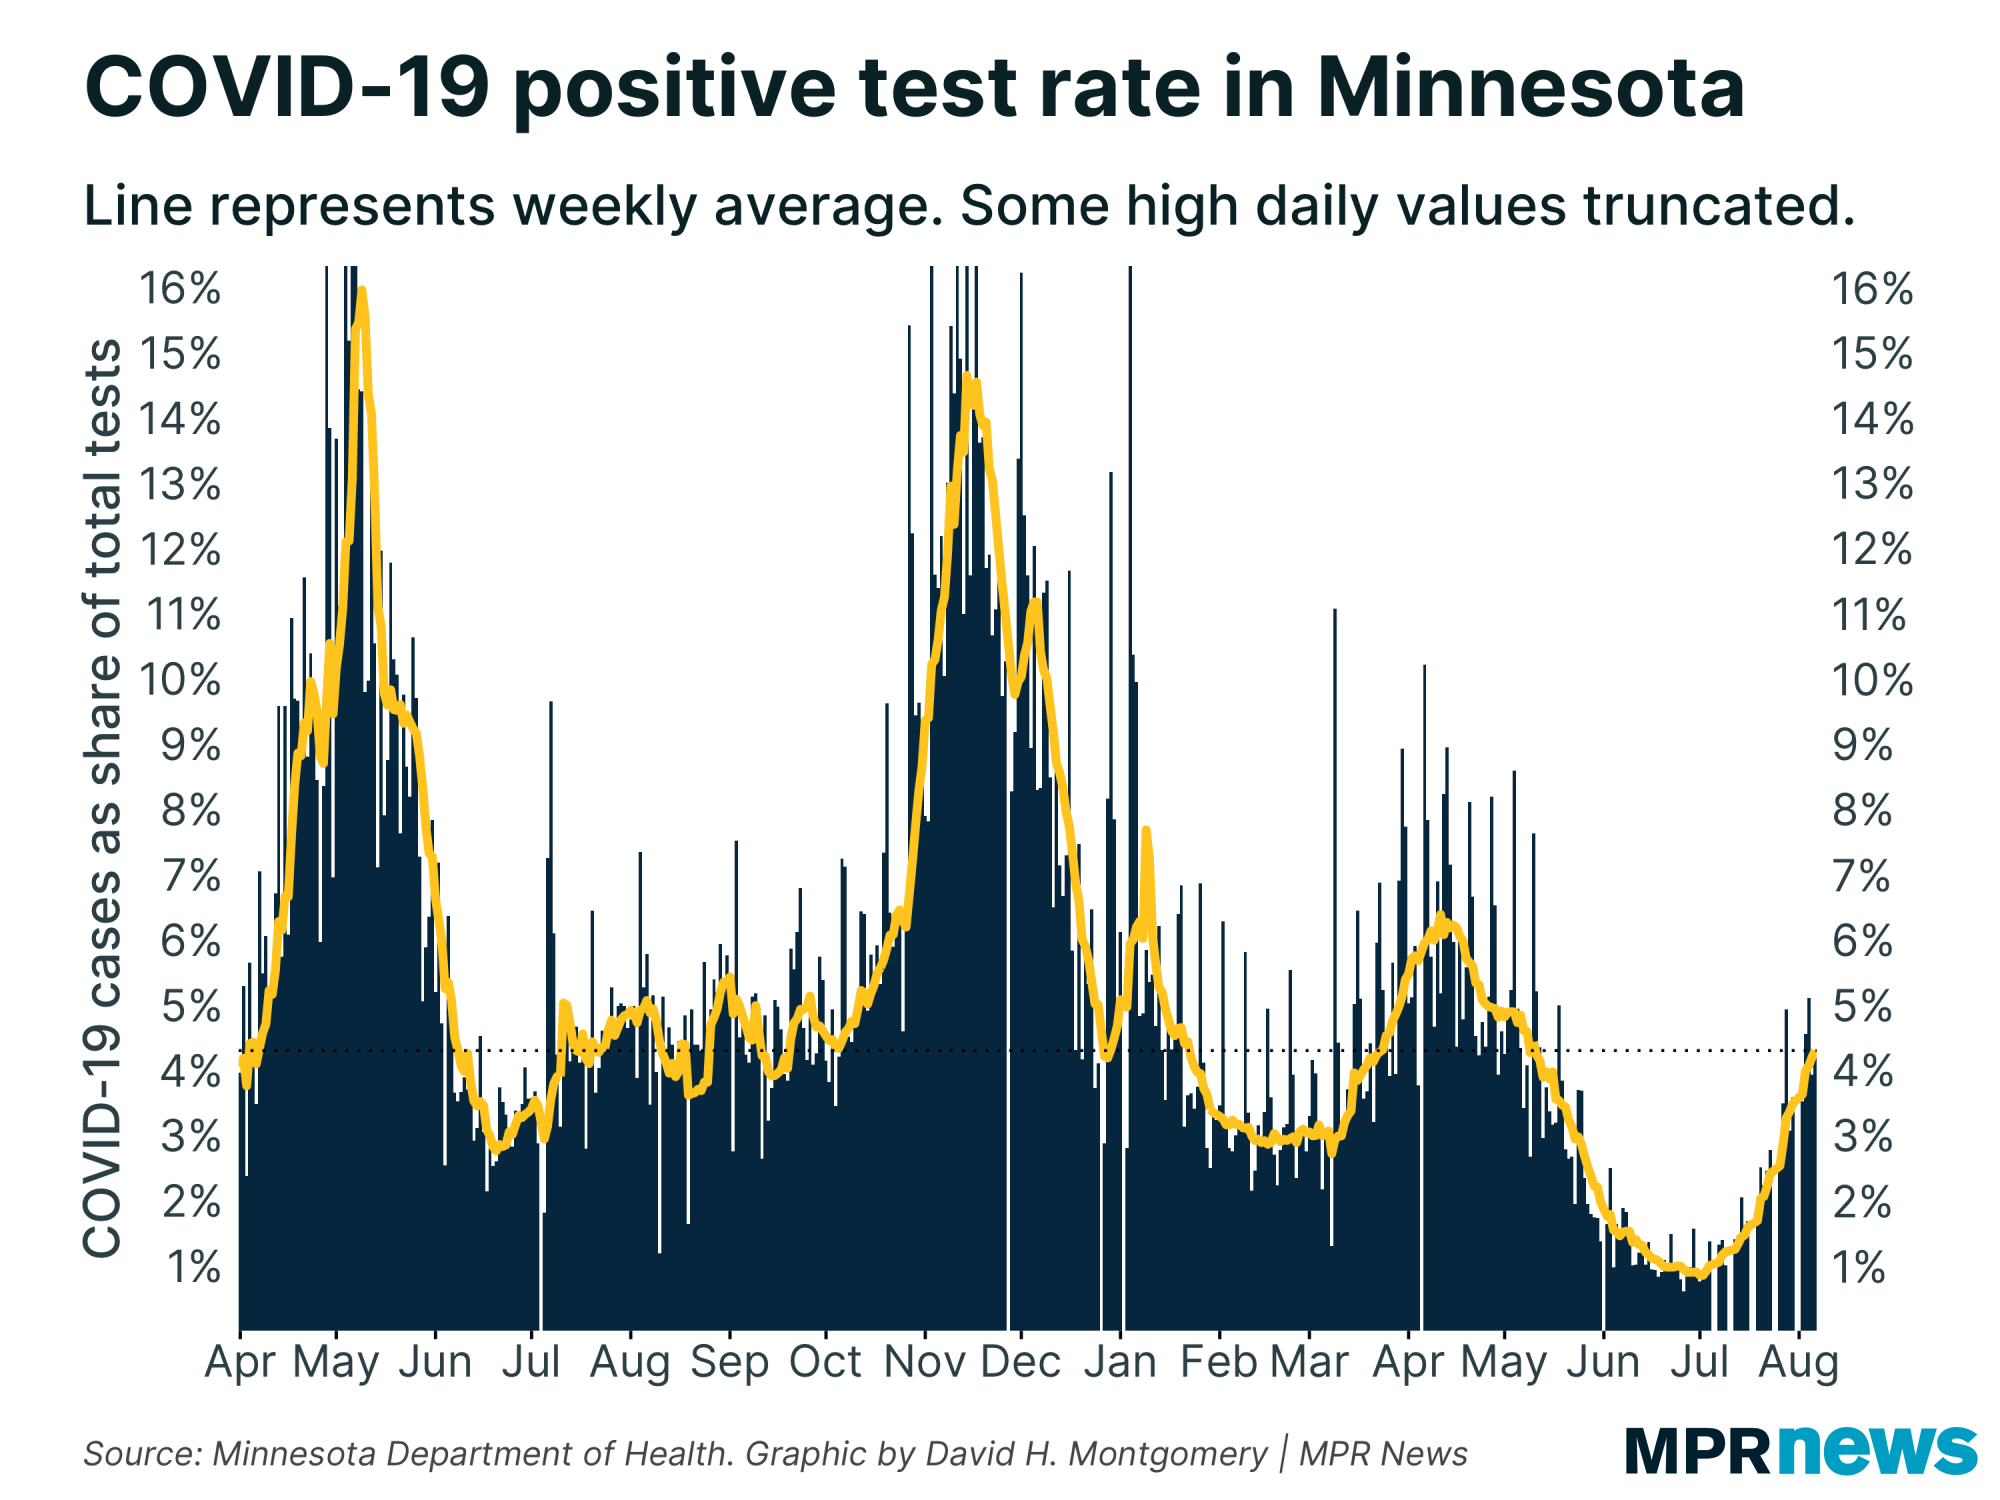
There is no perfect metric for tracking COVID-19, but I've consistently found positivity rate — the share of tests to come back positive — to be more useful than case counts themselves (though they are still useful!). Minnesota's positivity rate has been rising, too, up to 4.2 percent, from 1.2 percent four weeks ago. | | |
|
|
You might also note that while case counts are equal to where we were before the Spring 2021 wave, positivity rate is a bit higher in relative terms, about halfway up the spring slope.
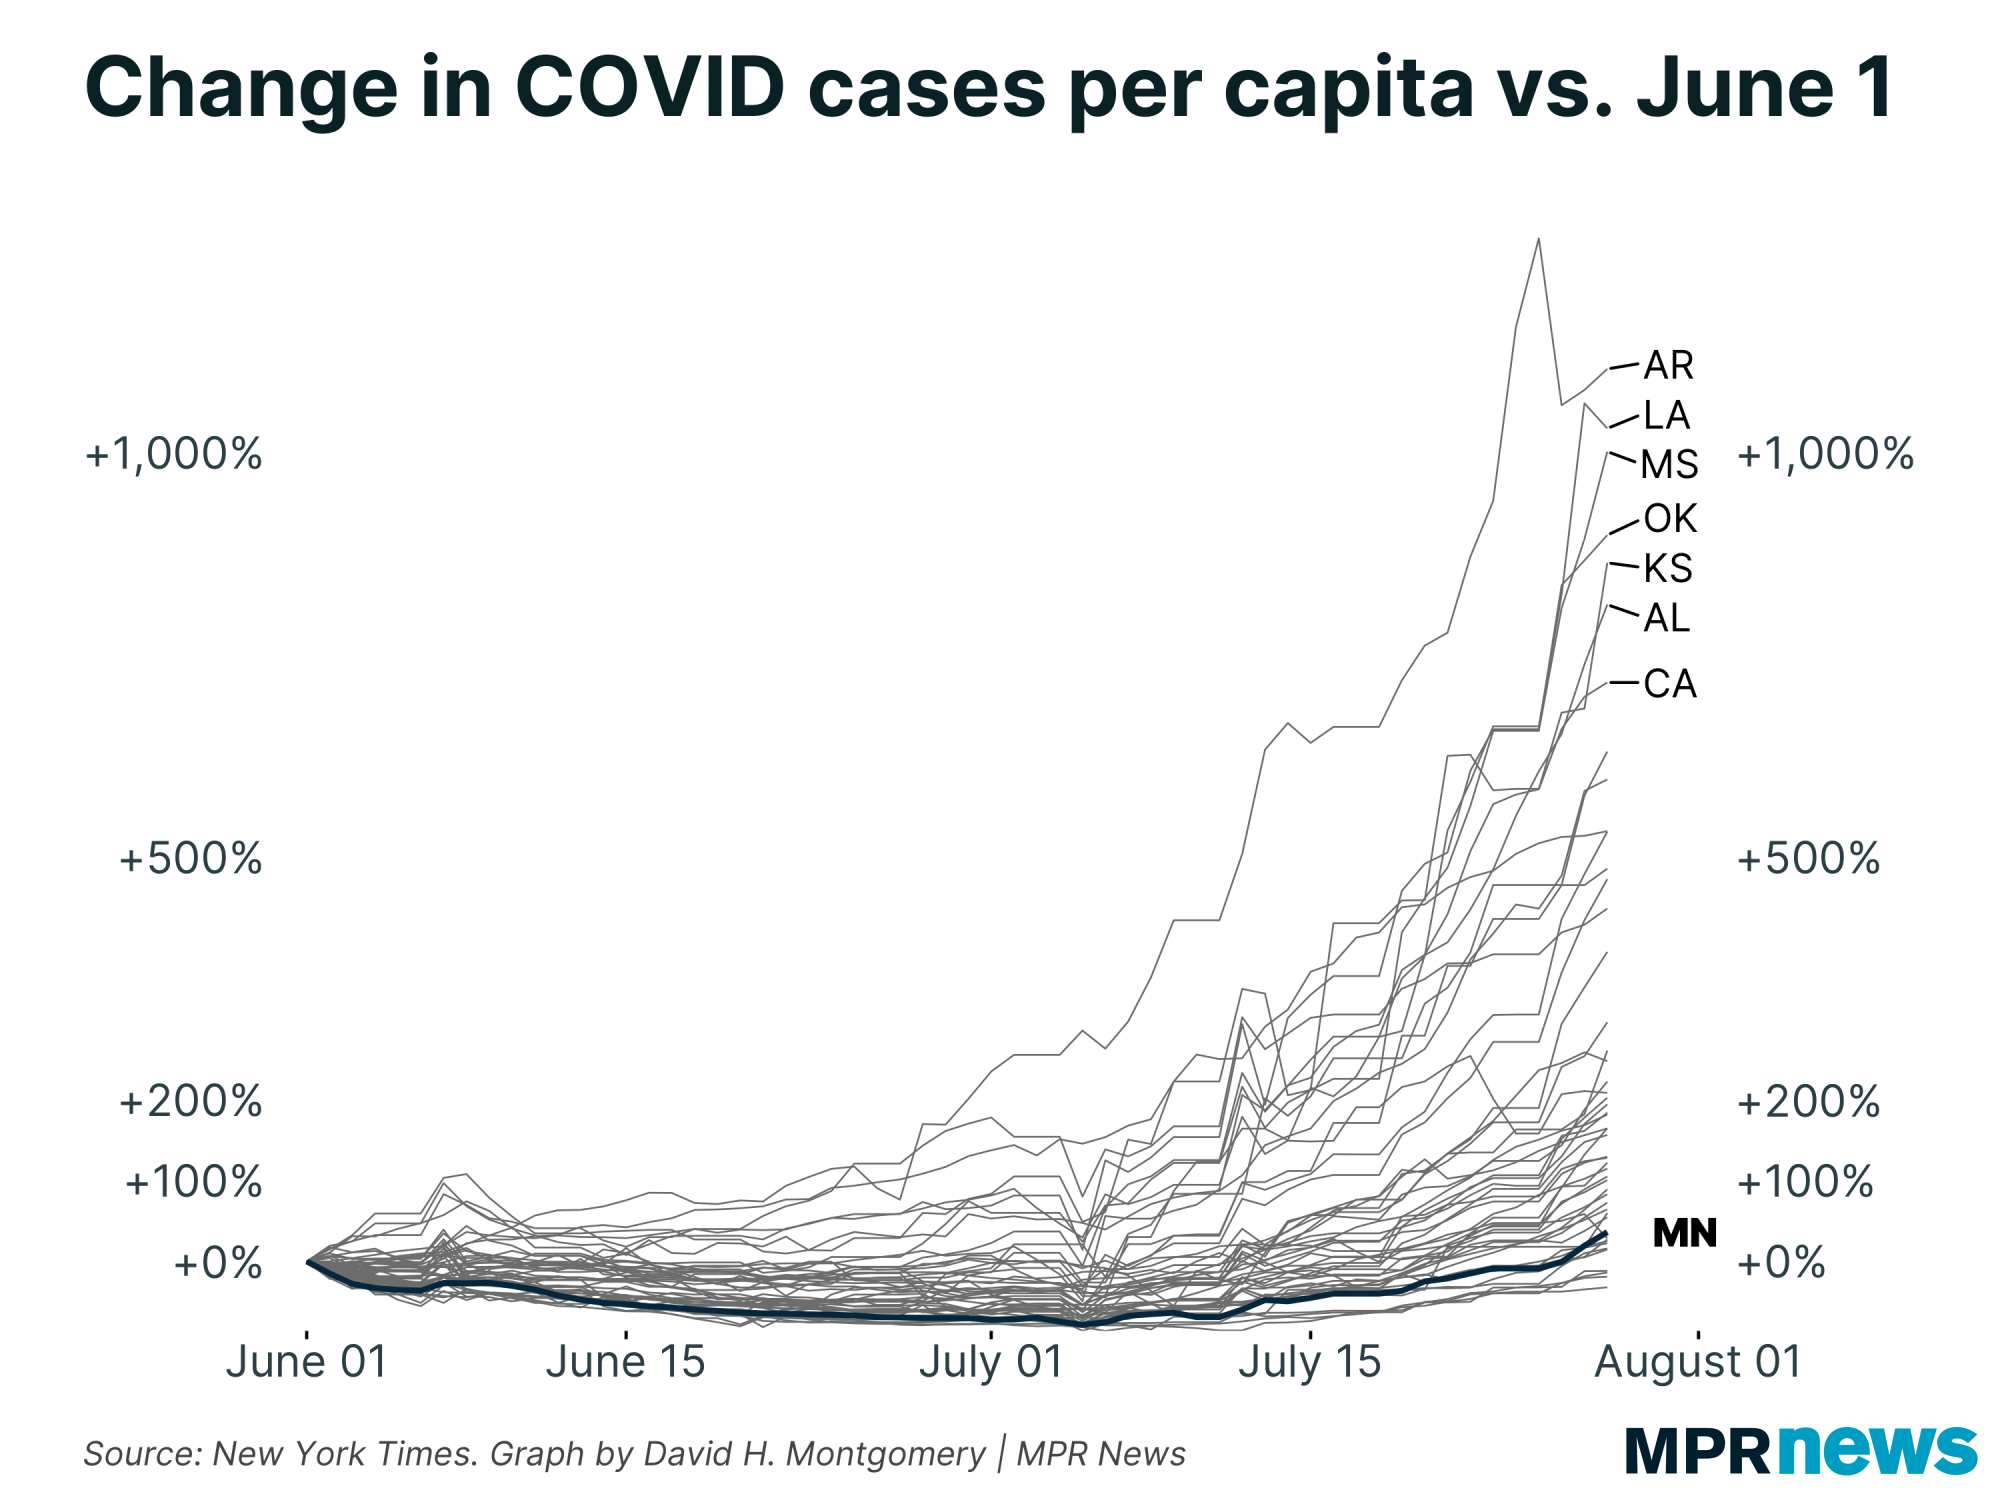
Here's the broader context for the U.S. A lot of states have seen truly epic surges in COVID-19 cases. Minnesota is up, but is so far in an entirely different ballpark. |
| |
|
|
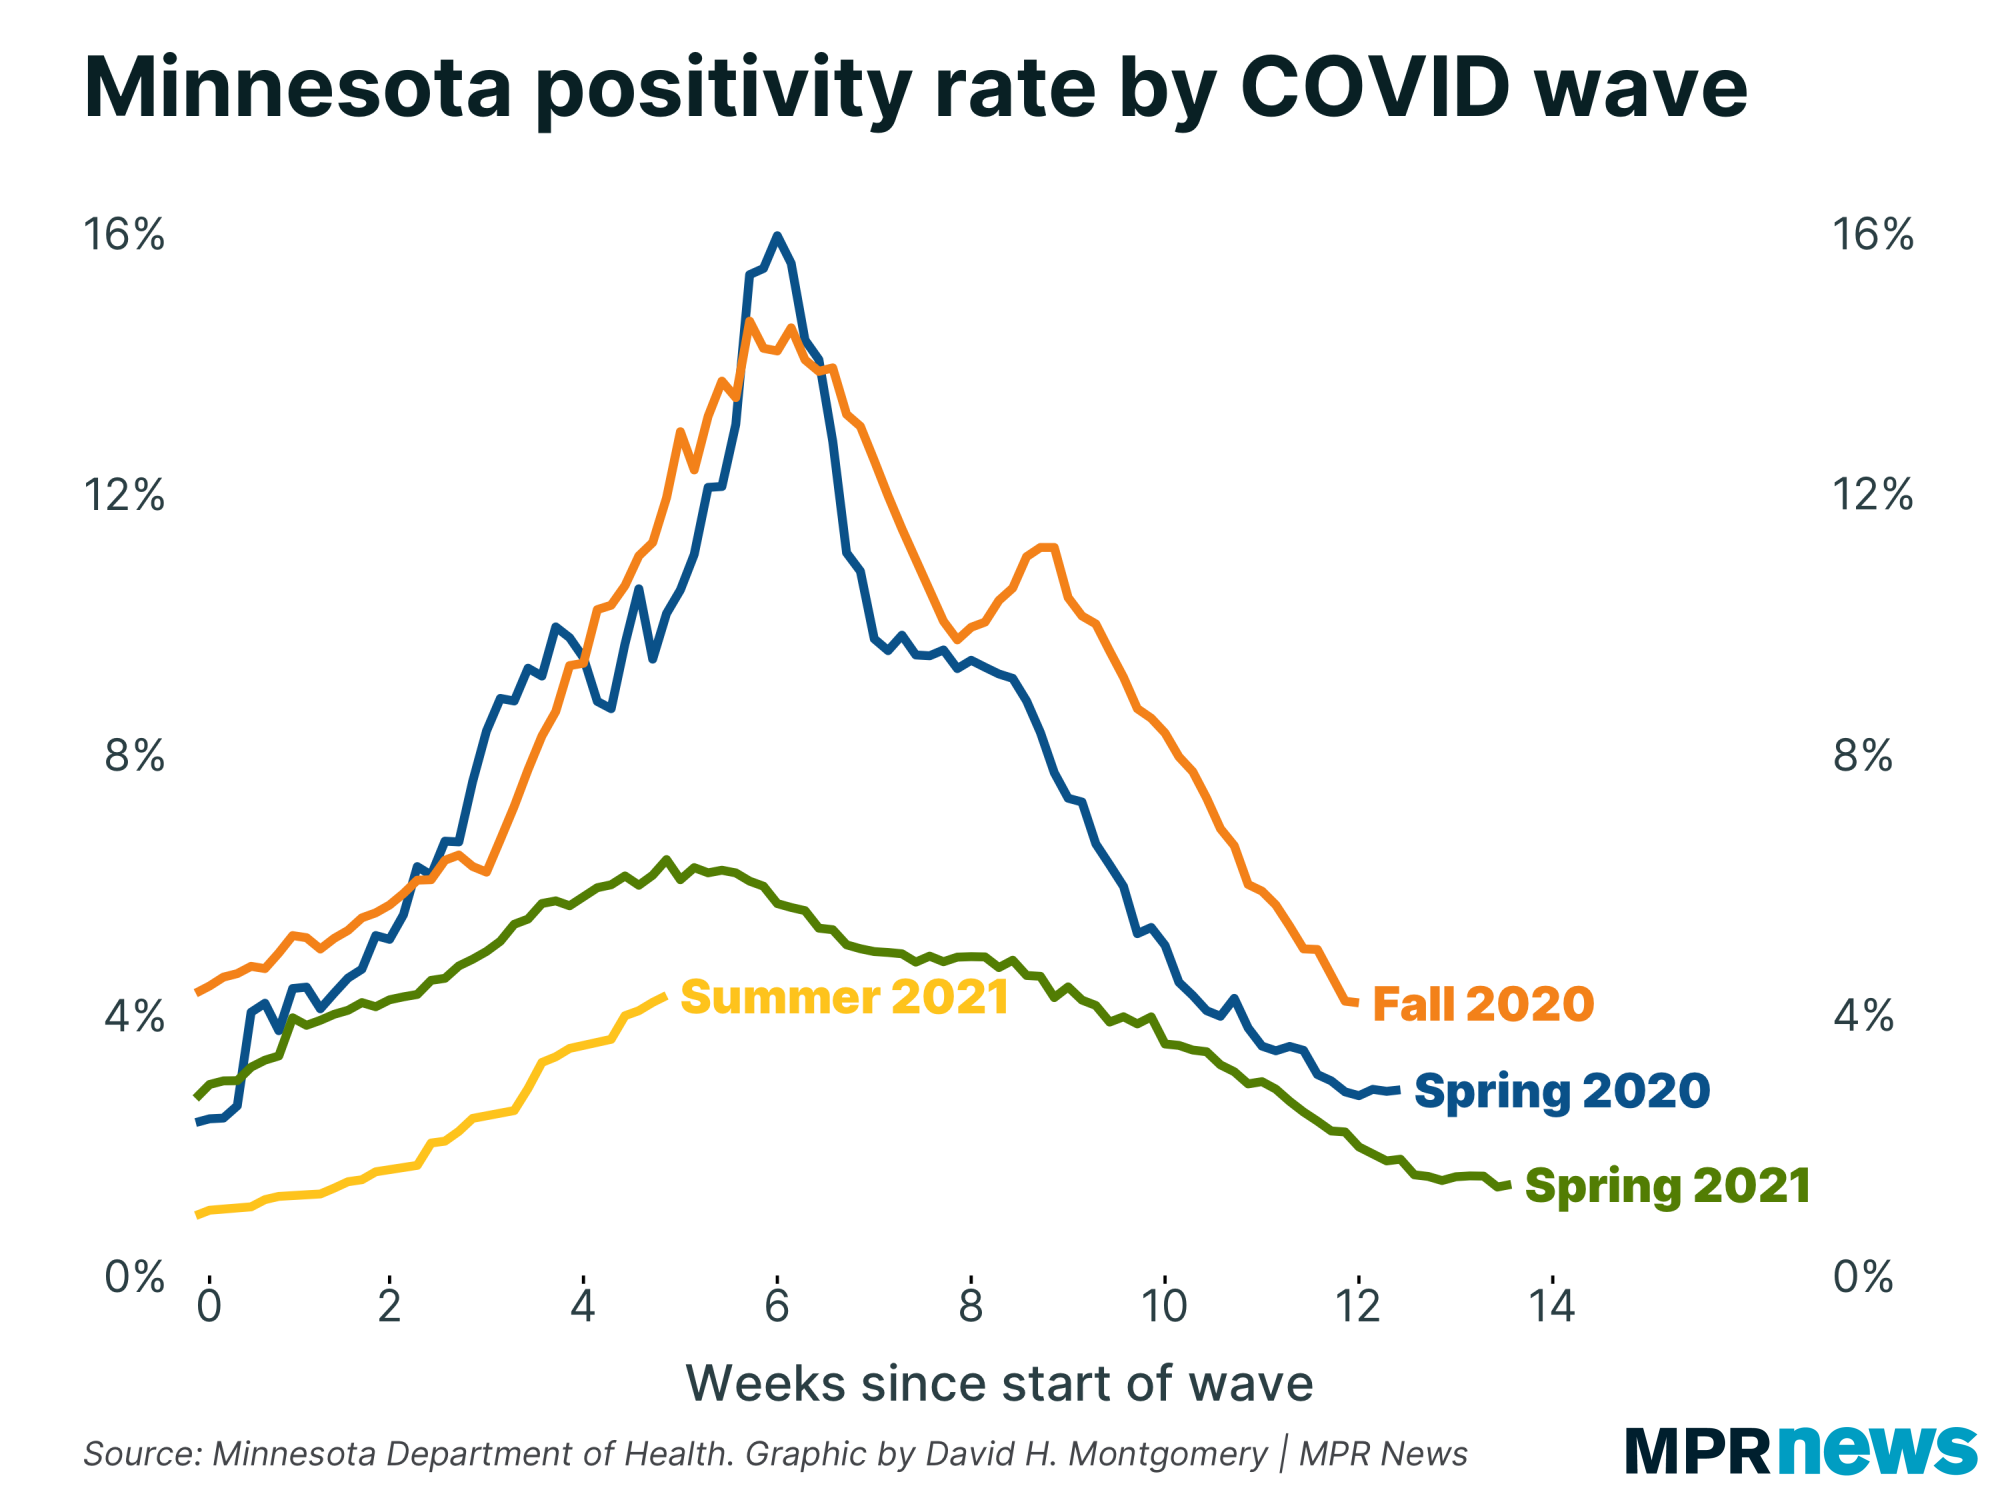
| When we line up Minnesota's four waves together, we can see how our current wave started at a much lower rate than past waves, and has largely risen at a similar pace to the Spring 2021 wave. But by this point back in April, case growth was already plateauing. There's no real end in sight. | |
|
|
|
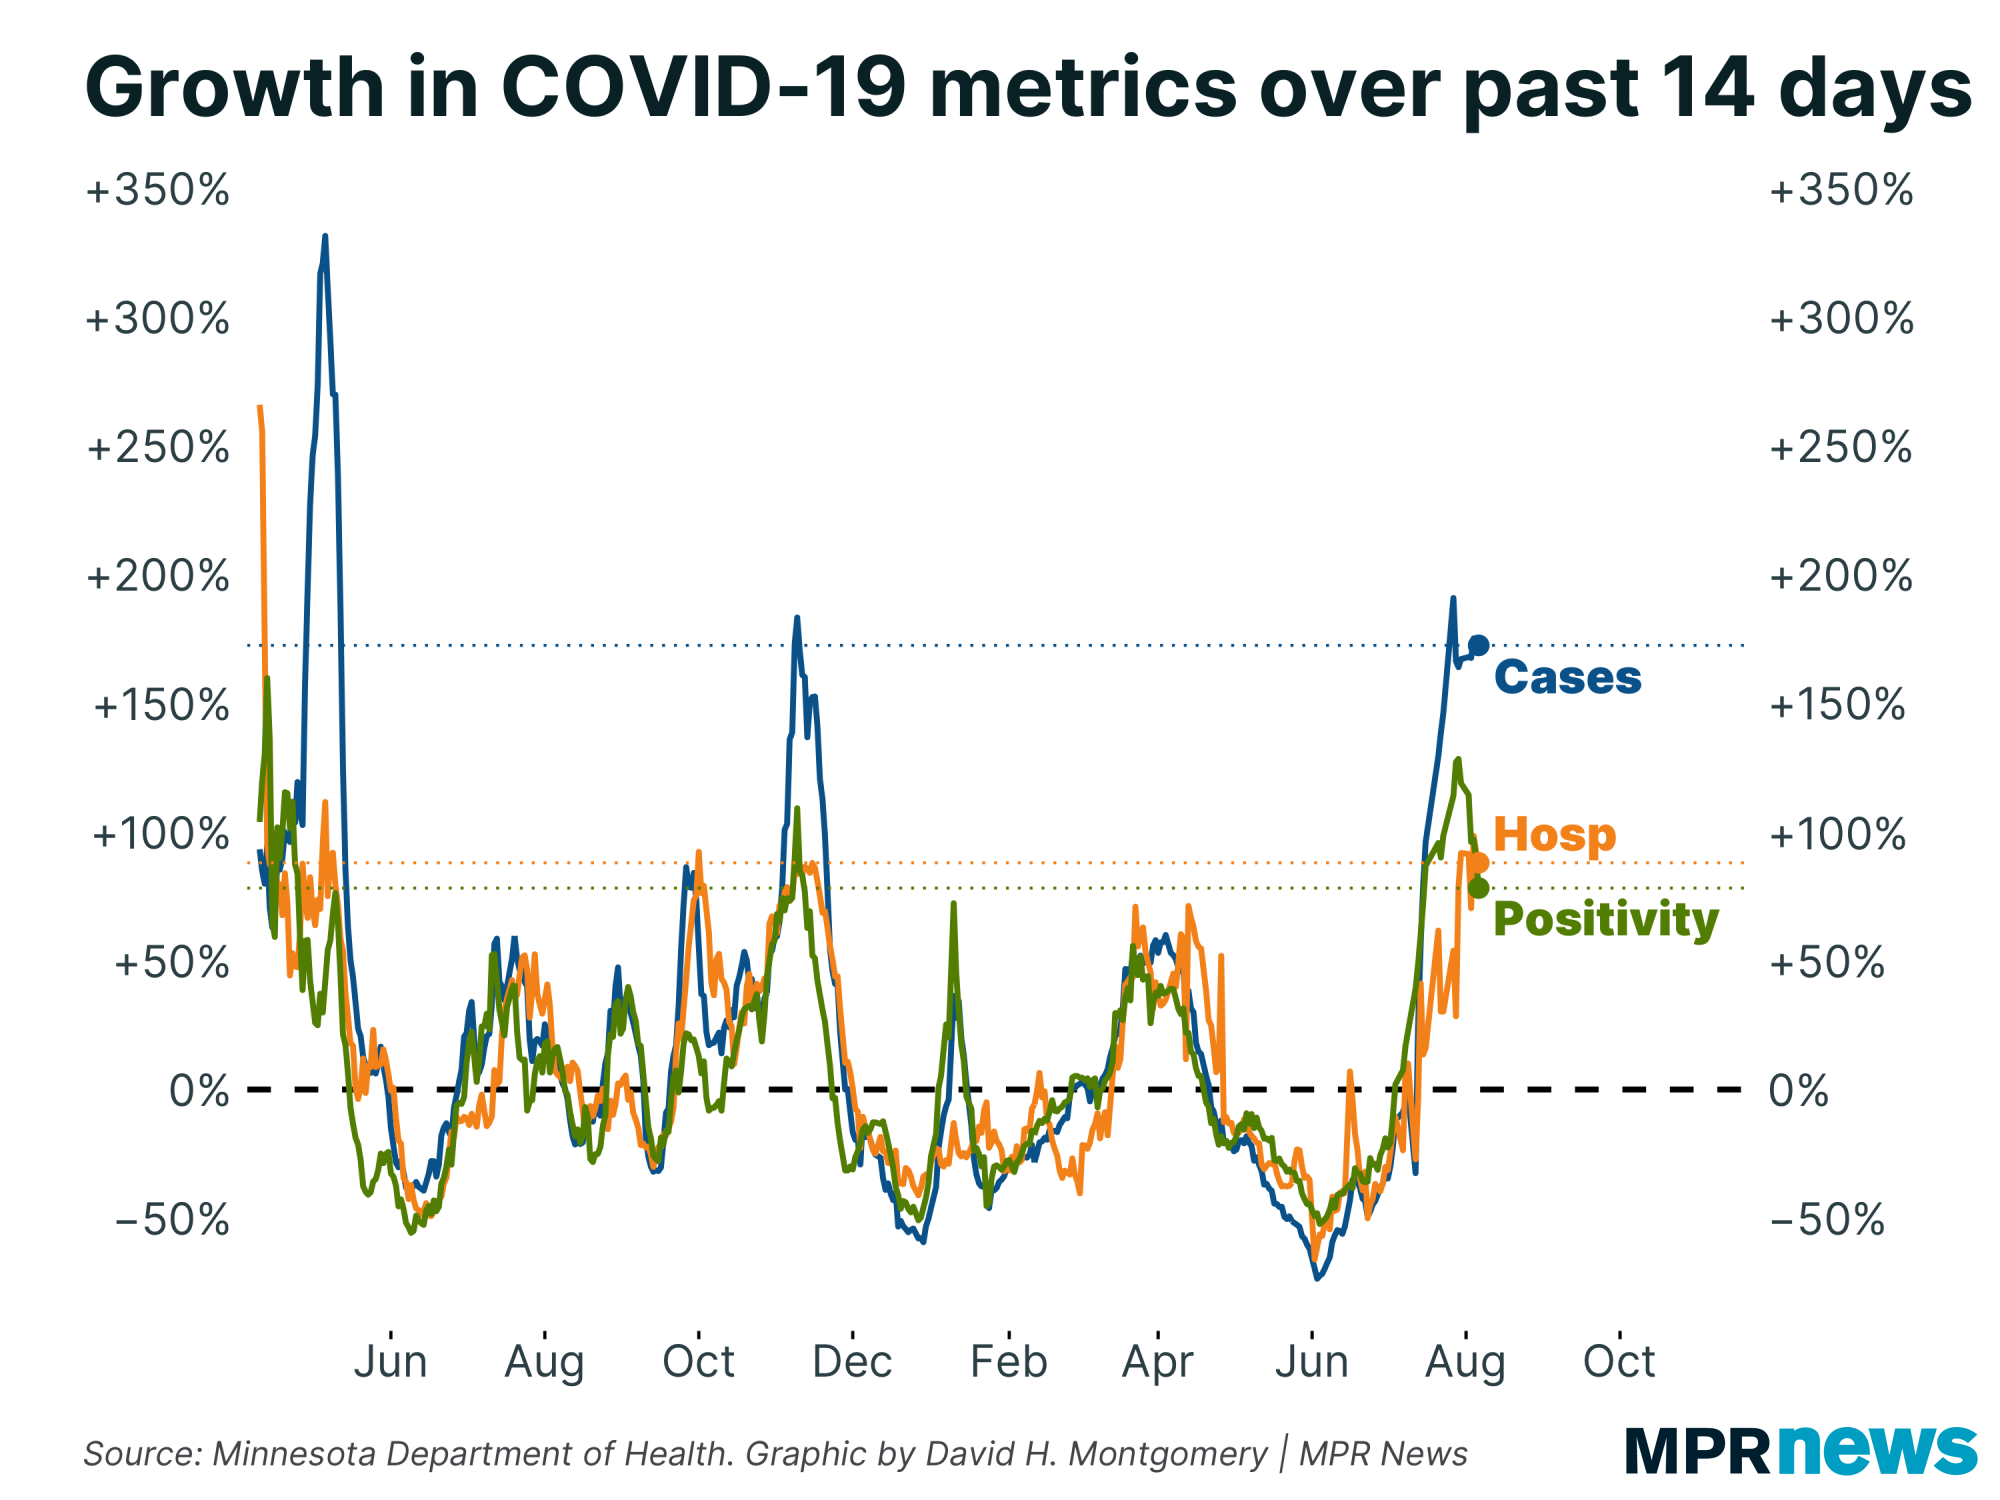
Another tool (but stay with me now) that I like to use to track the ebb and flow of COVID-19 in Minnesota is looking at the percent growth in key metrics over the past two weeks.
By this measure, we can see cases are up nearly 200 percent over the past two weeks. Positivity rate and hospital admissions have doubled. | |
|
|
|
But you can also notice something else: that positivity line is moving down.
Now, it's important not to misinterpret this. Positivity rate is still trending up. But this isn't graphing the positivity rate, it's graphing the change in positivity rate. (If you remember high school calculus, this is the first derivative of positivity rate.) That means any value above 0 indicates positivity rate is rising. A line going down means it's rising more slowly. A "peak" would happen once the line gets backdown to 0.
So this one metric suggests that the pace of growth of this wave has started to slow. It's a gradual slowing yet — not really visible to the naked eye on a straight graph of positivity — but it's real. Positivity rate is no longer accelerating, and it's begun decelerating.
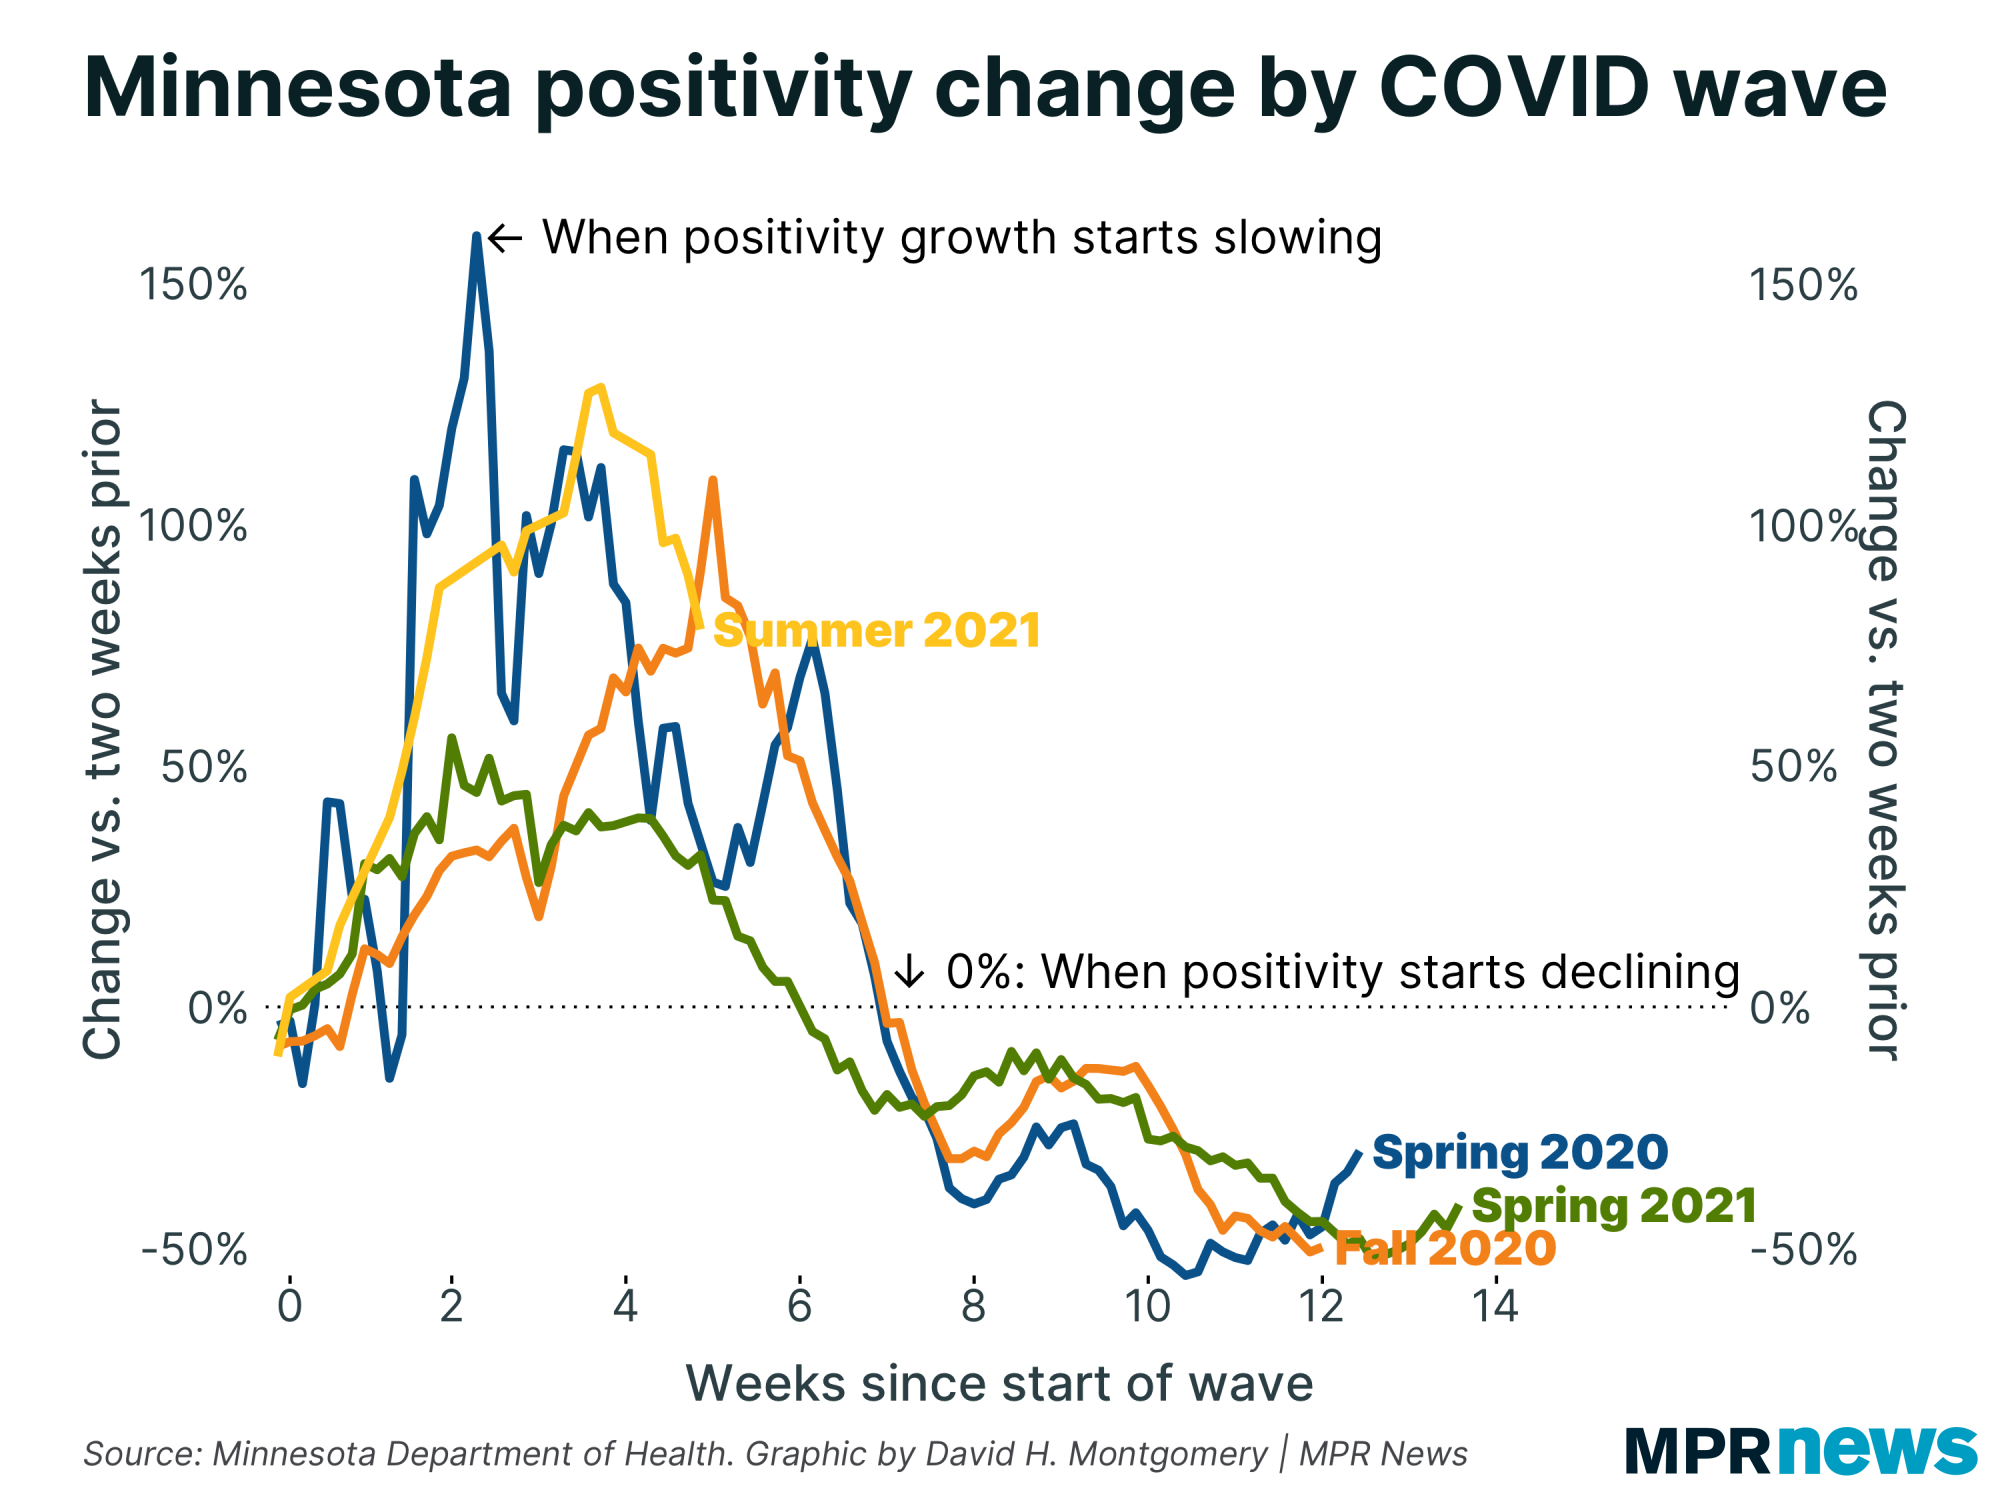
To check how meaningful this is, I focused the above graph just on positivity rate, and lined up Minnesota's four waves like before. |
| |
|
|
As you can see, once positivity growth started to slow in the past waves (especially the Fall 2020 and Spring 2021 waves, for which our data is more robust), it generally kept on slowing until it crossed 0, hit the peak, and started actually declining instead of merely decelerating.
The process isn't always smooth — the Spring 2020 wave jumped around a bit, and Spring 2021 decelerated gradually for a bit before falling more (that is, it had a plateau at the top, instead of a steep peak). But this gives us confidence that if this wave behaves like past waves — a big assumption! — we may have passed a turning point.
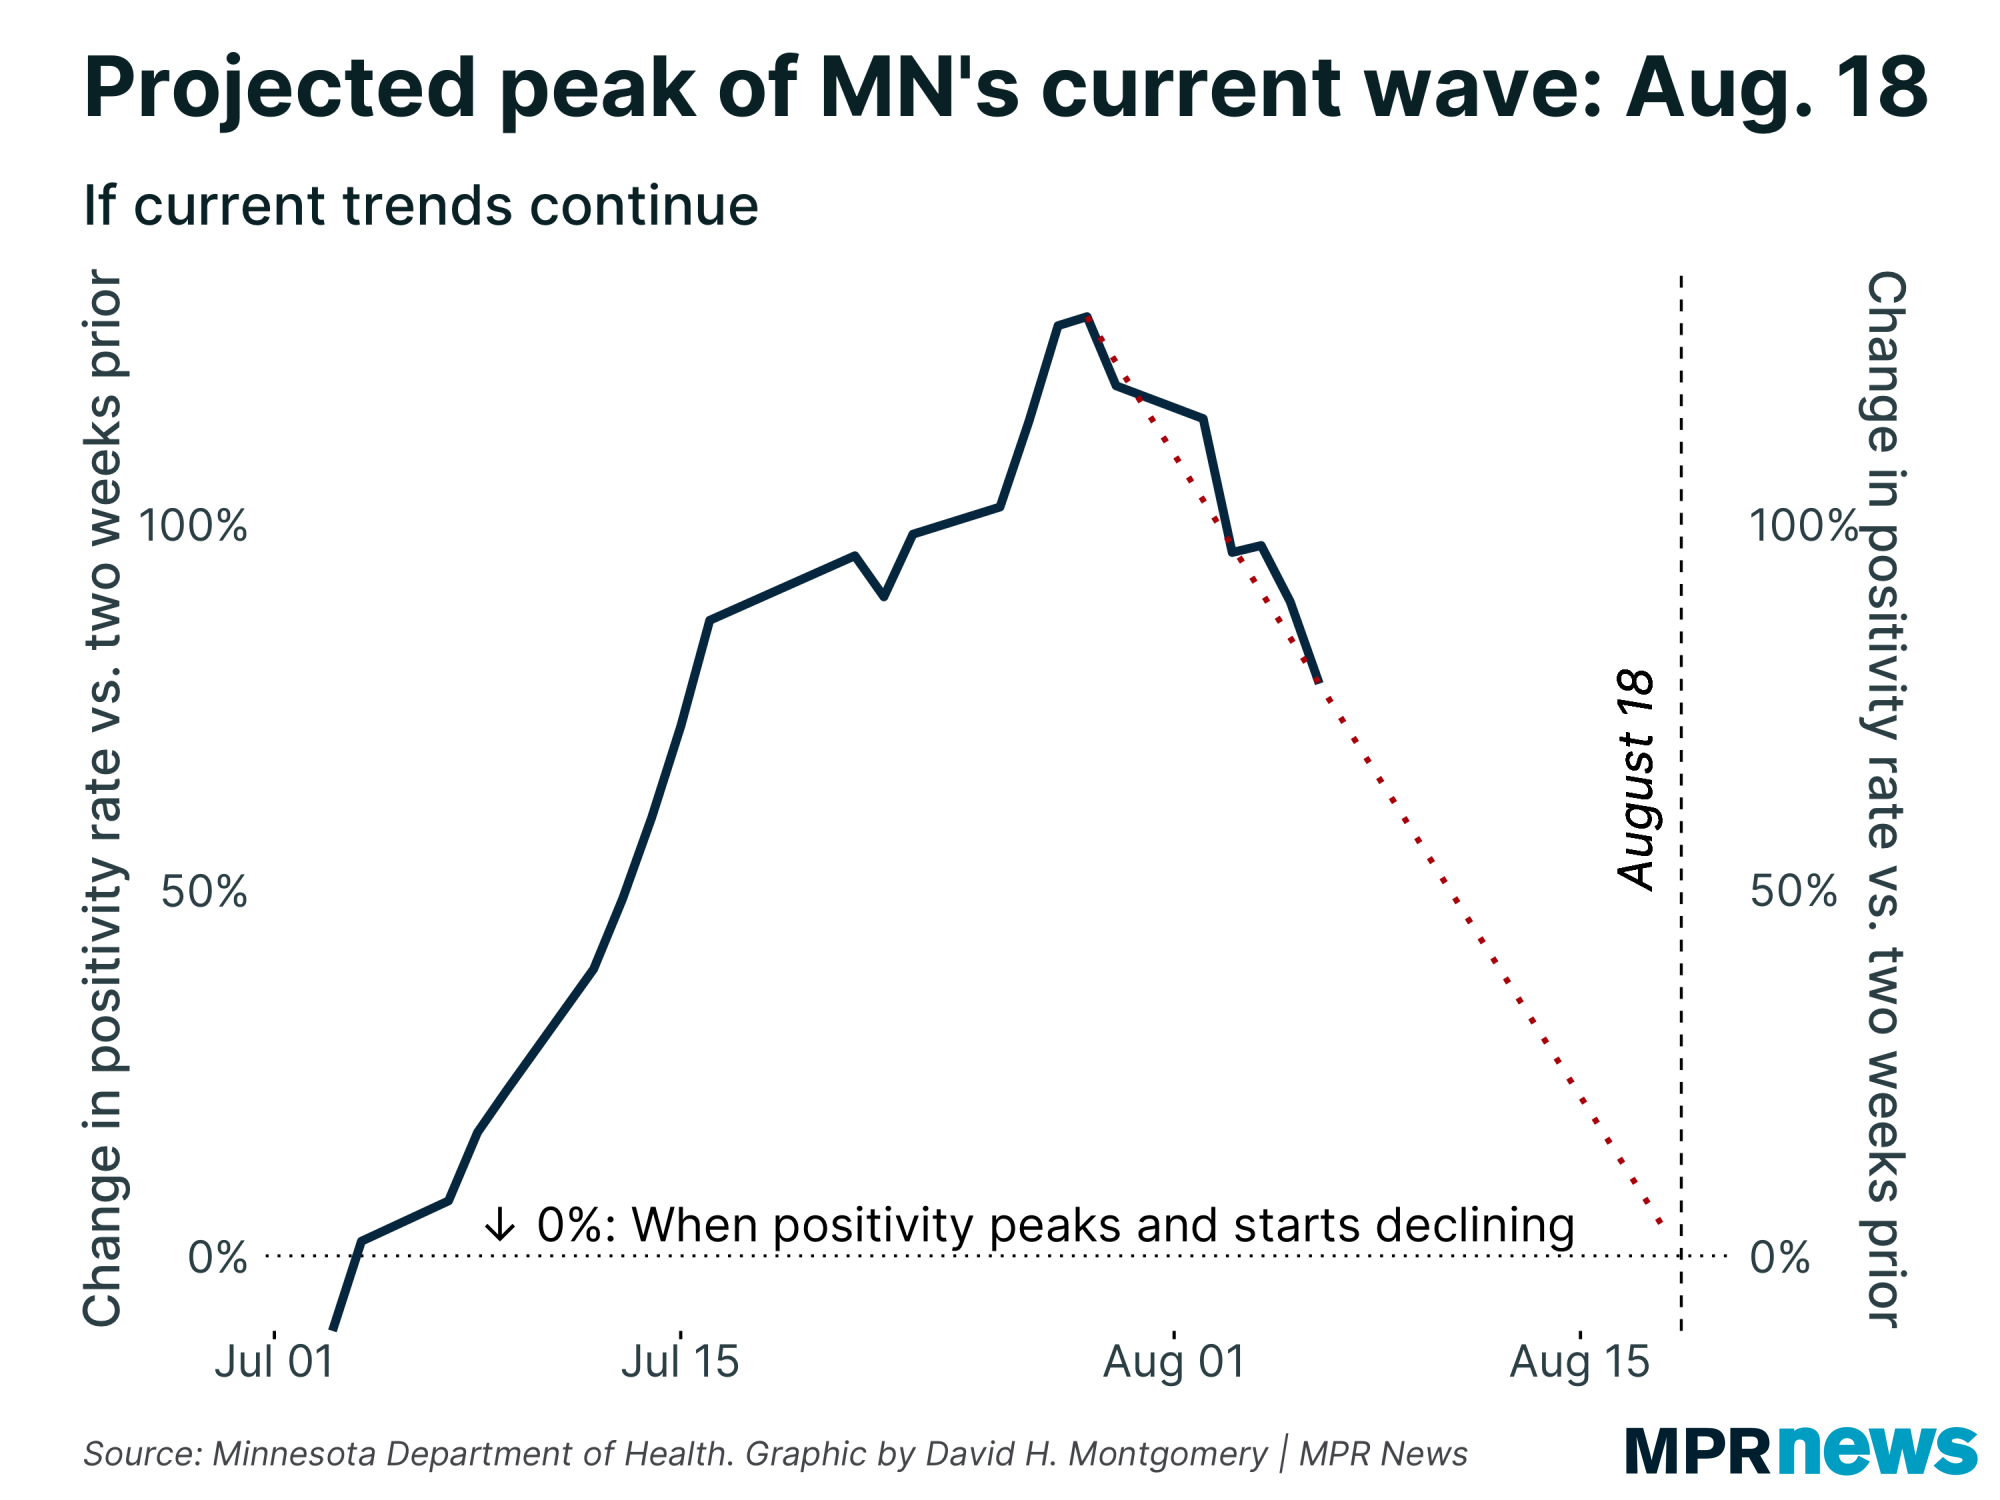
So if we have started a durable slowdown in cases, if we're not going to snap back to acceleration, what does that actually mean? Well, here's the graph of the change in our current wave's positivity rate, with recent trends extrapolated: |
| |
|
|
That's right: my hypothesis is that Minnesota's current COVID-19 wave will peak sometime around Wednesday, August 18. That's 12 days from now, just under two weeks.
(To clarify, this is based on report date, not the date people got infected or tested. So if true, the actual peak would be some days earlier — this is just when we'd know about it.)
Now, this is a prediction. The peak could come sooner than this, or much later. Some people have suggested that some combination of the upcoming State Fair, the currently happening Sturgis Motorcycle Rally in South Dakota, Labor Day cookouts, and the return to school could break the mold, since all our past waves took place with mitigation measures like masking mandates in place, measures that aren't in place now. That's entirely possible, and my charts here shouldn't be taken as any proof that it won't.
I'll keep checking the rate of change in Minnesota's positivity rate, to see if it continues to decelerate. If it starts accelerating again — especially for more than just one-day blips — that's a sign that a peak isn't near (and that the delta variants might have changed the game from what we're used to). If the slowdown continues, that's a good sign that we're on track to peak in mid-August.
Finally, I'll note that this is a timeline to the peak — when the outbreak stops expanding and starts retreating. Once that happens, we're likely due for a month or two of gradually declining case rates. The virus is probably going to be just as prevalent a week before the peak as it will be a week after. And this decline is not necessarily going to be smooth — last fall we had a minor bounce-back shortly after Christmas; it wouldn't be shocking to see another such minor bump around Labor Day and the Fair. The Christmas 2020 bump was transitory, but that doesn't mean for sure that a hypothetical Fair 2021 bump would be.
Whether I'm right or wrong, I'll check back to update you on how this prediction played out. |
| |
|
|
Below, I'll explore a few more stats about Minnesota's COVID-19 outbreak. If you want to learn more, I also recommend these other articles:
| | |
|
|
| Hospitalizations, deaths both rising |
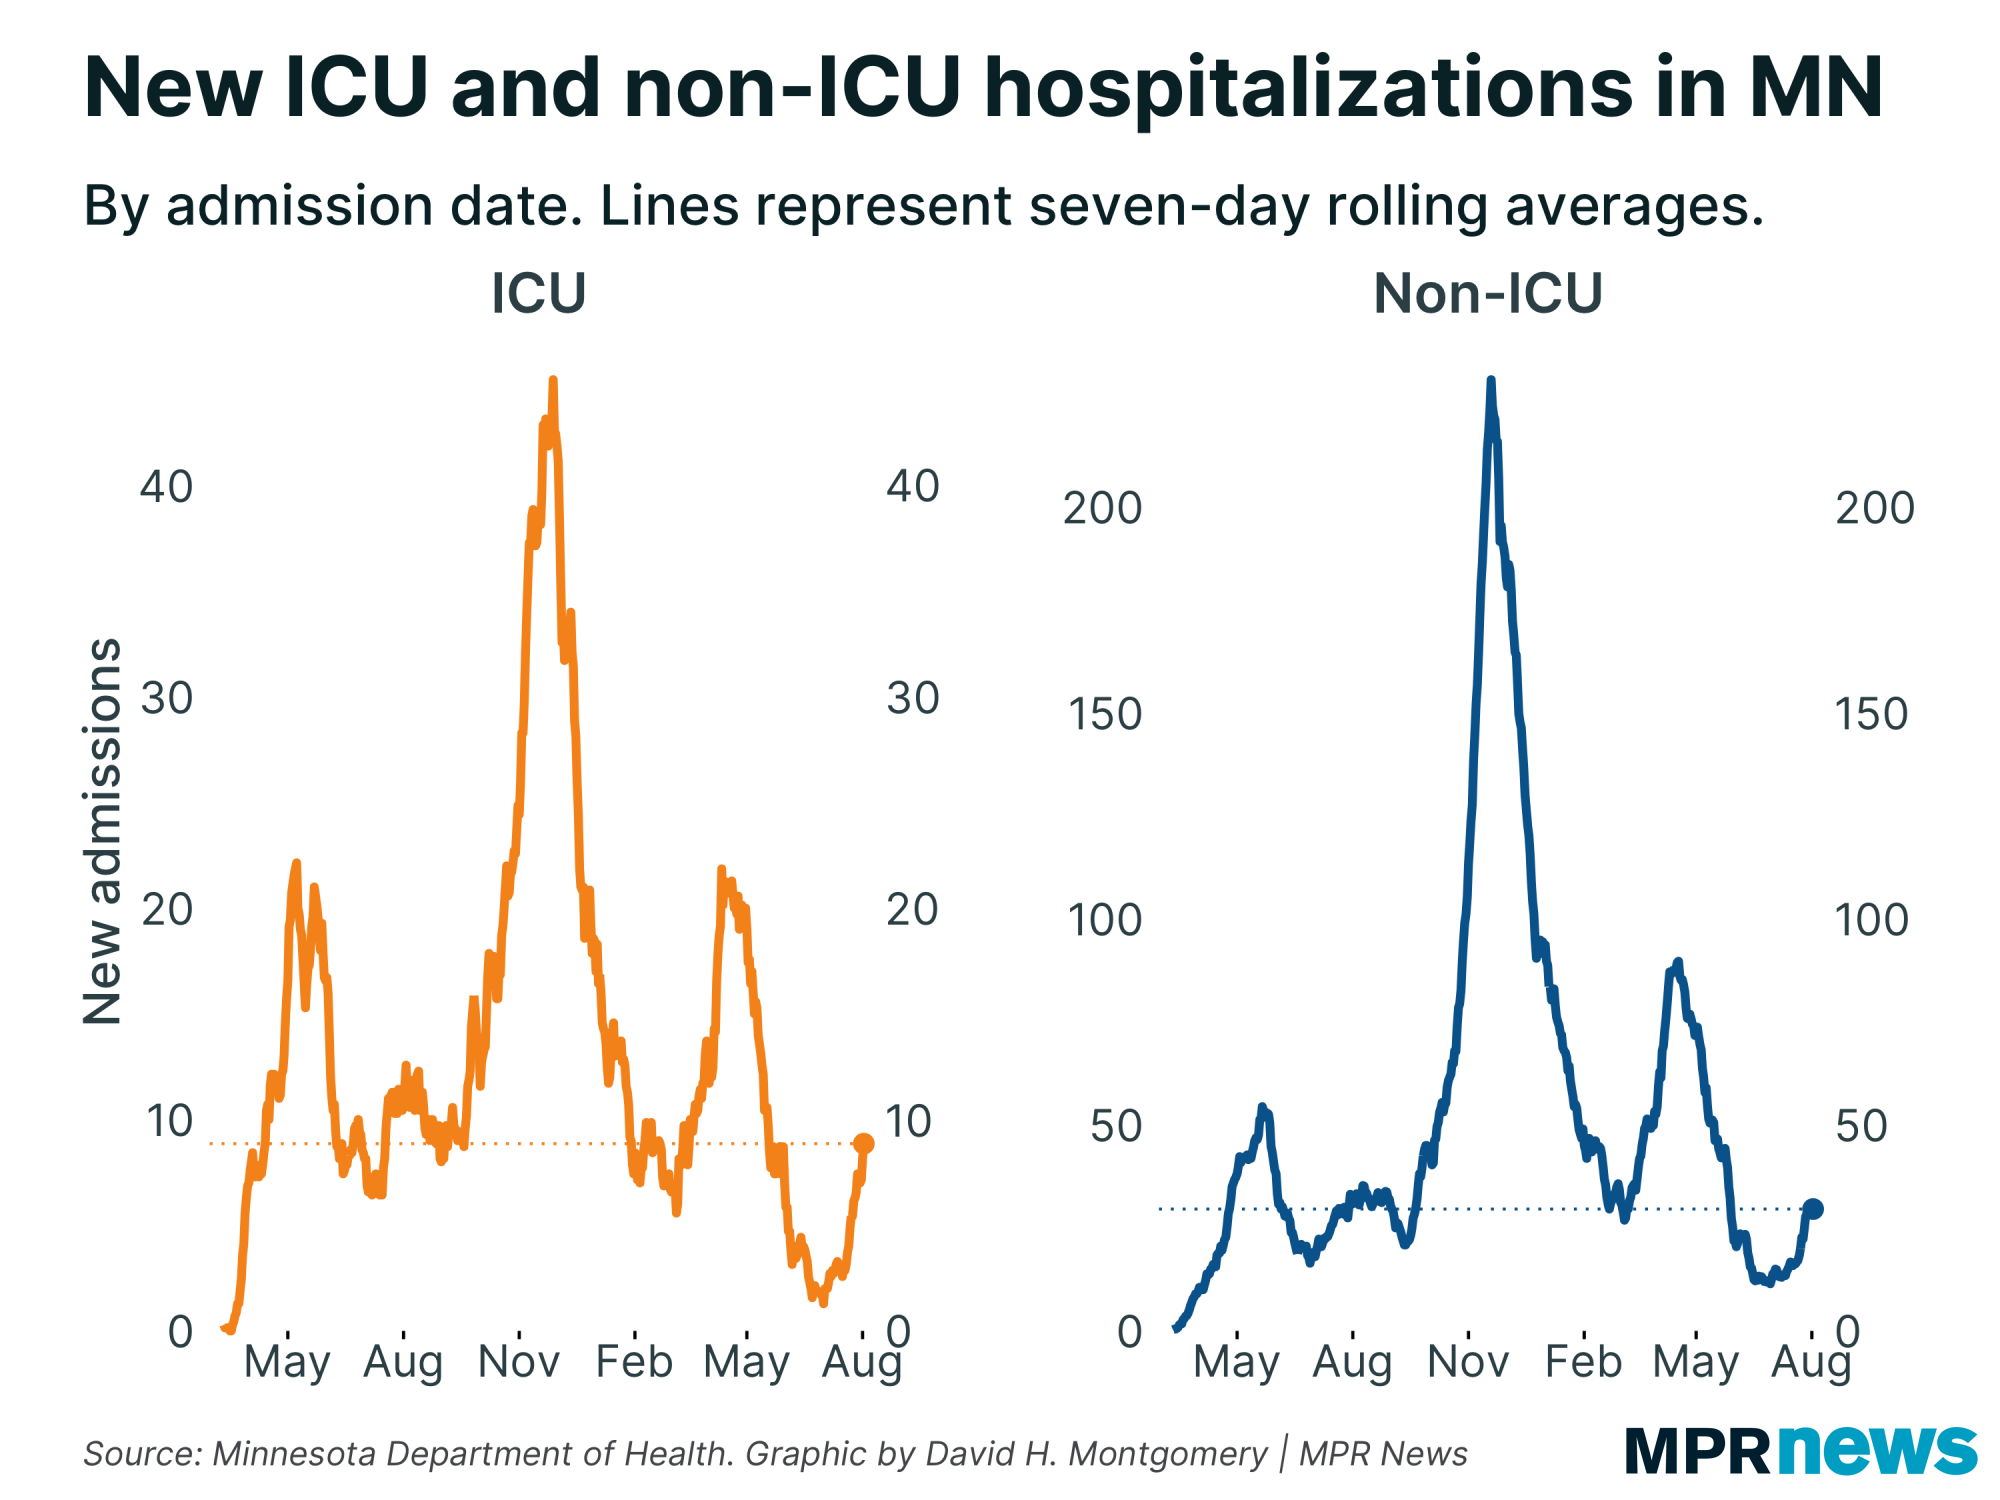
With so many vulnerable people vaccinated, the more consequential stats for tracking the impact of COVID-19 in Minnesota might be hospitalizations or deaths. These aren't as useful as cases for tracking the course of the outbreak, because they are trailing indicators (especially deaths). But ultimately what matters are these serious cases that threaten death or long-lasting symptoms.
So far, these metrics are both rising — though both more gradually than past waves. Both ICU and non-ICU hospitalizations are up from their June lows, but still relatively low. |
| |
|
|
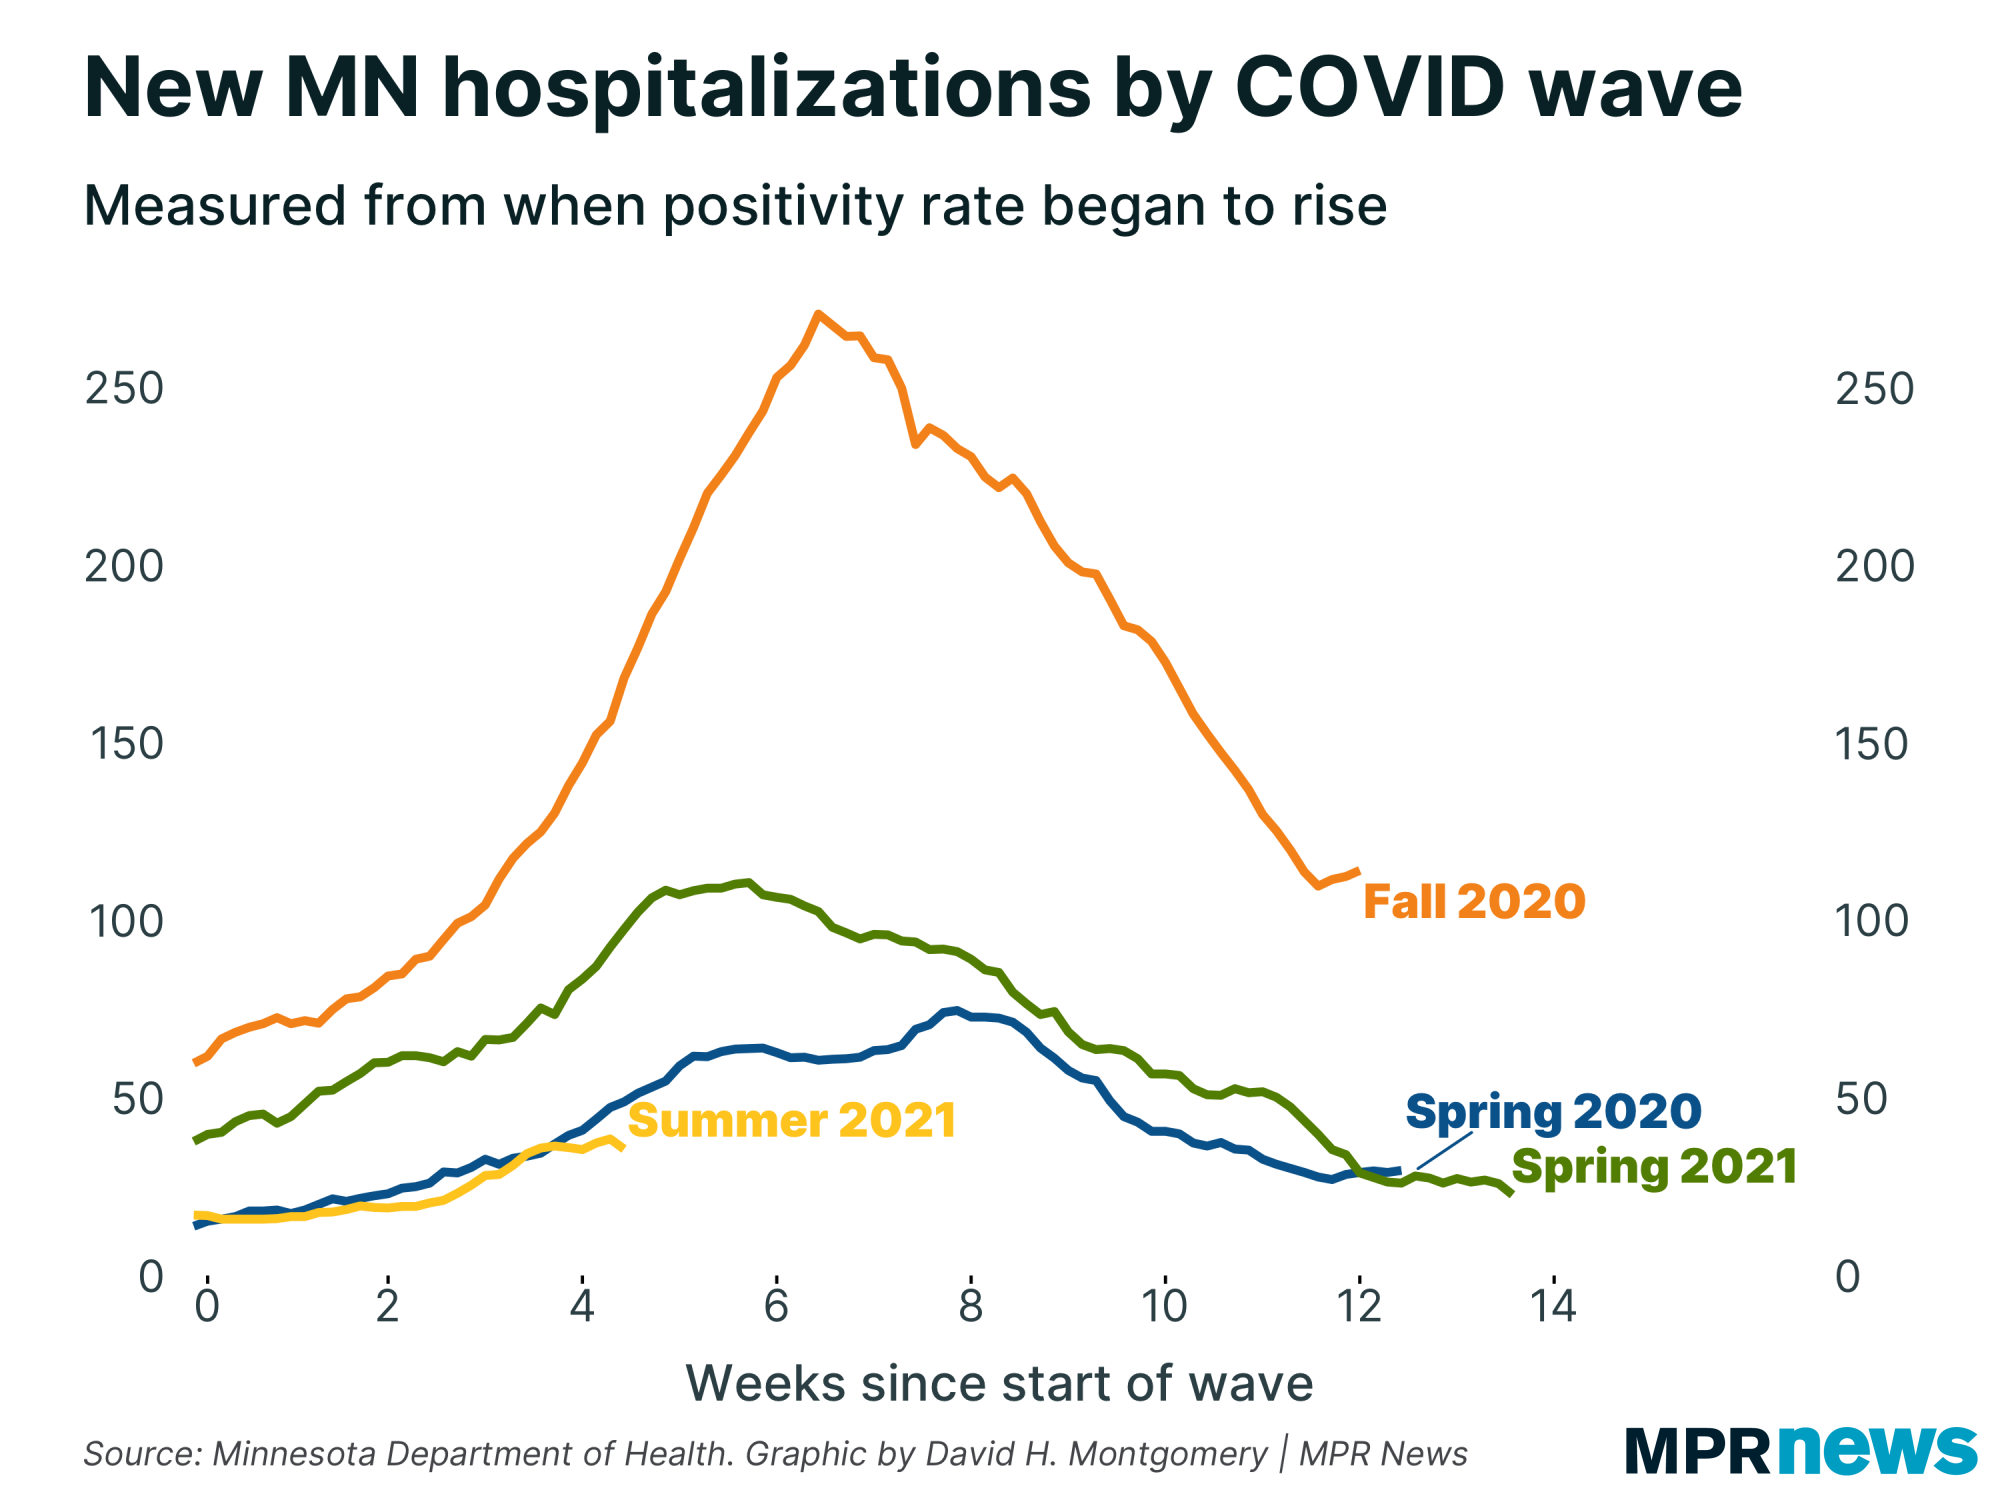
| When you line up the different COVID-19 waves, you can see the current wave is strikingly similar to hospitalization rates we saw in Minnesota's first wave back in spring 2020. I'm not sure what that means (and the metrics from back then are less reliable). More notably, we continue to be well below the hospitalization rates in the comparatively mild Spring 2021 wave. |
| |
|
|
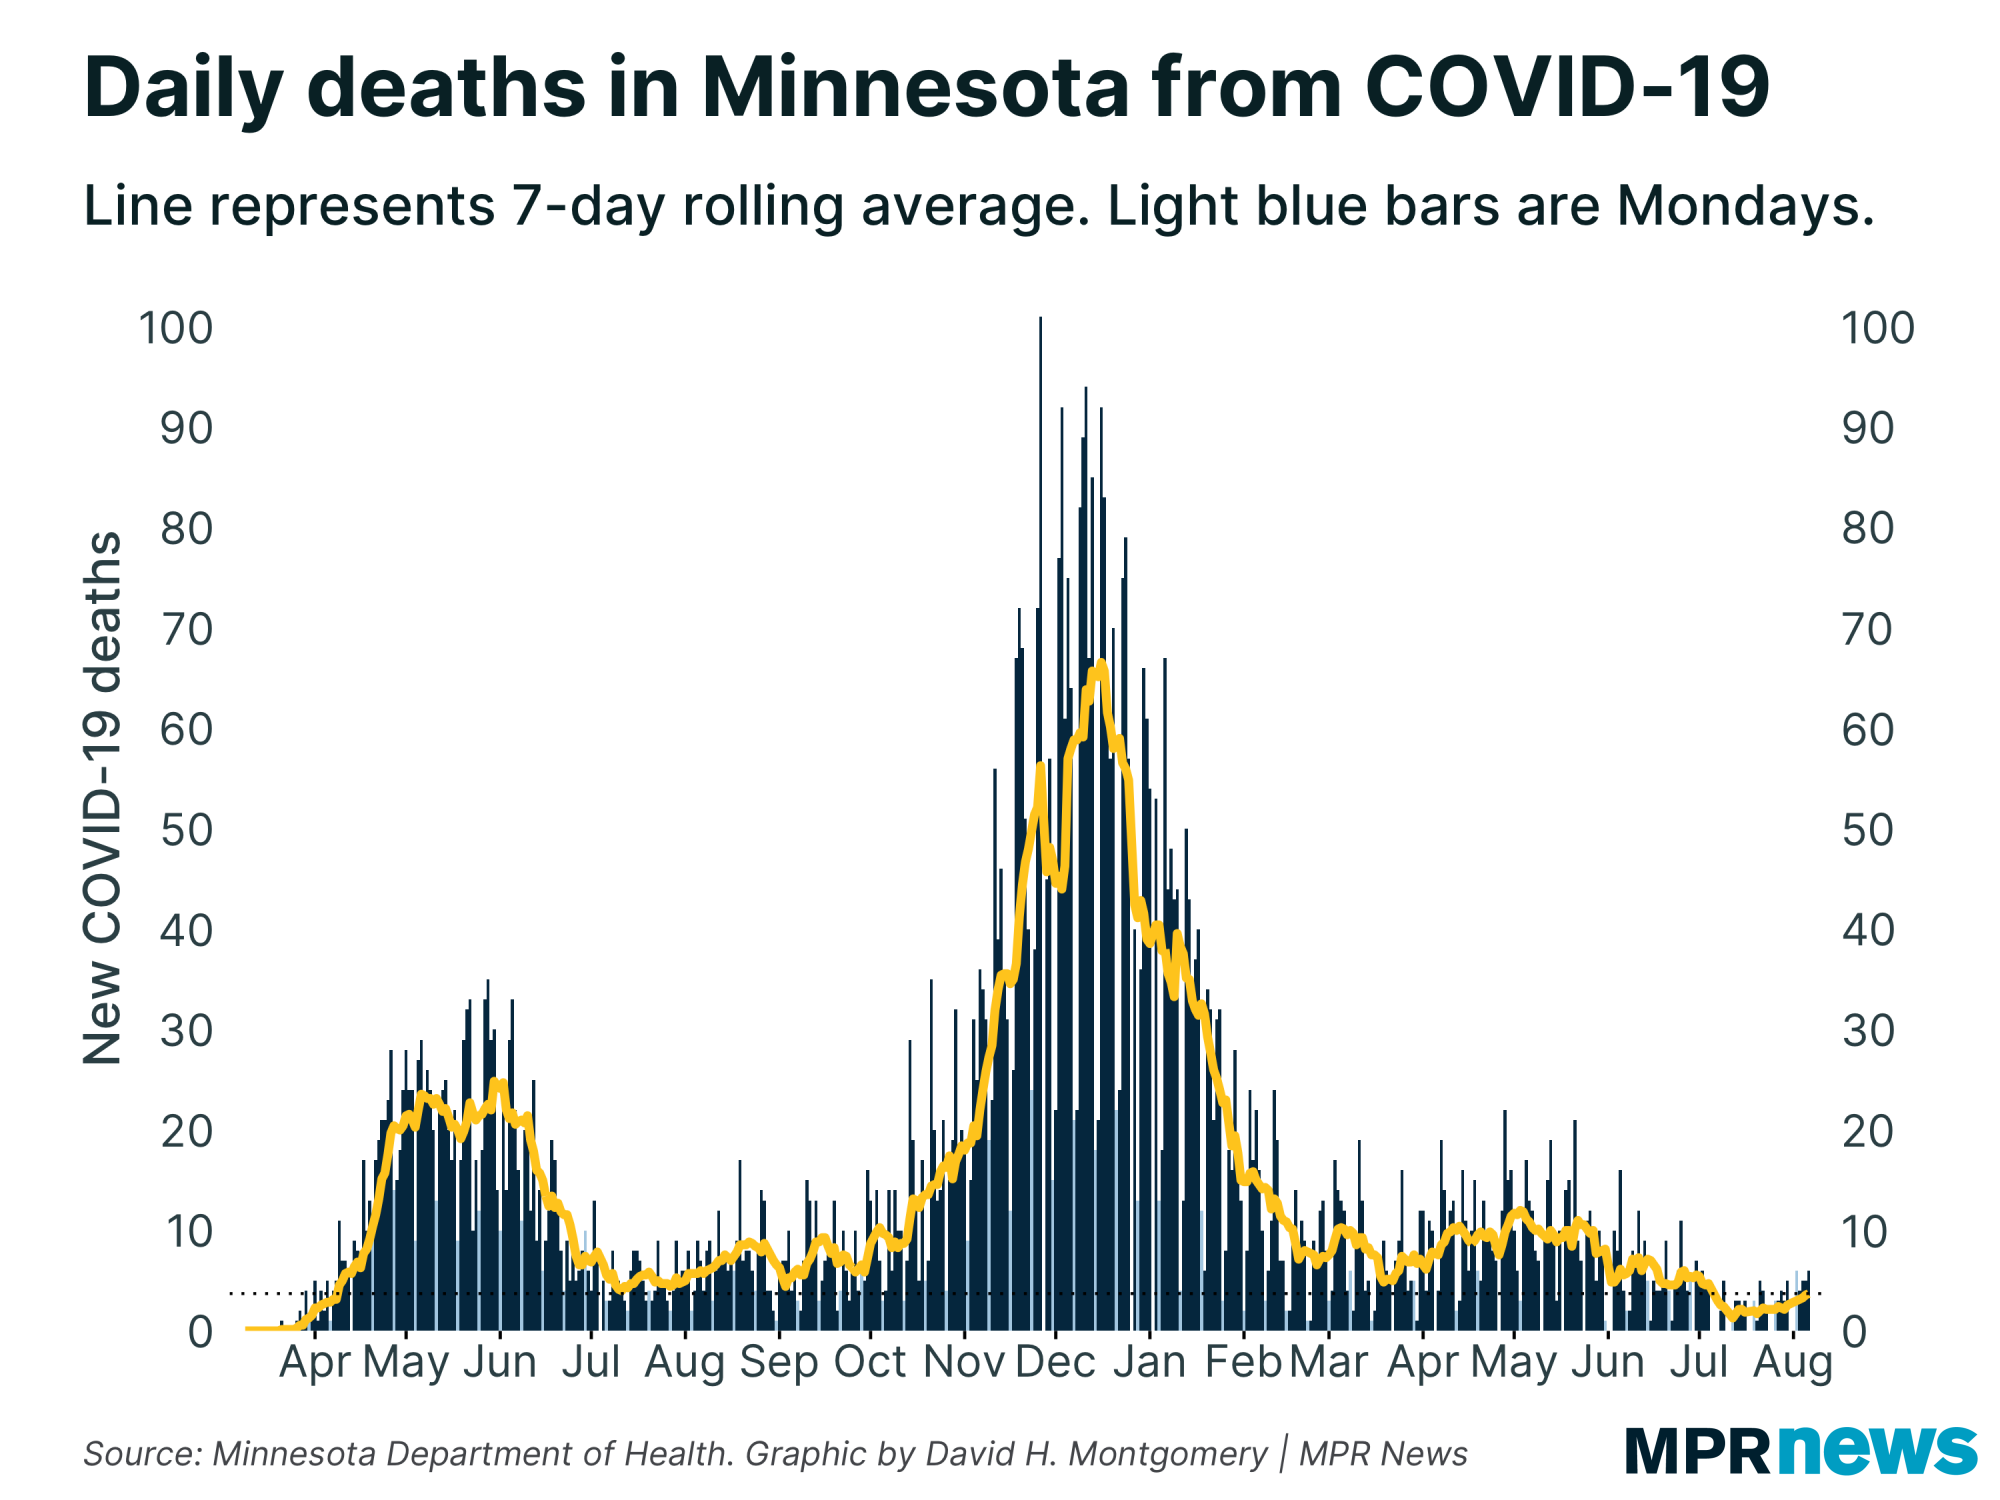
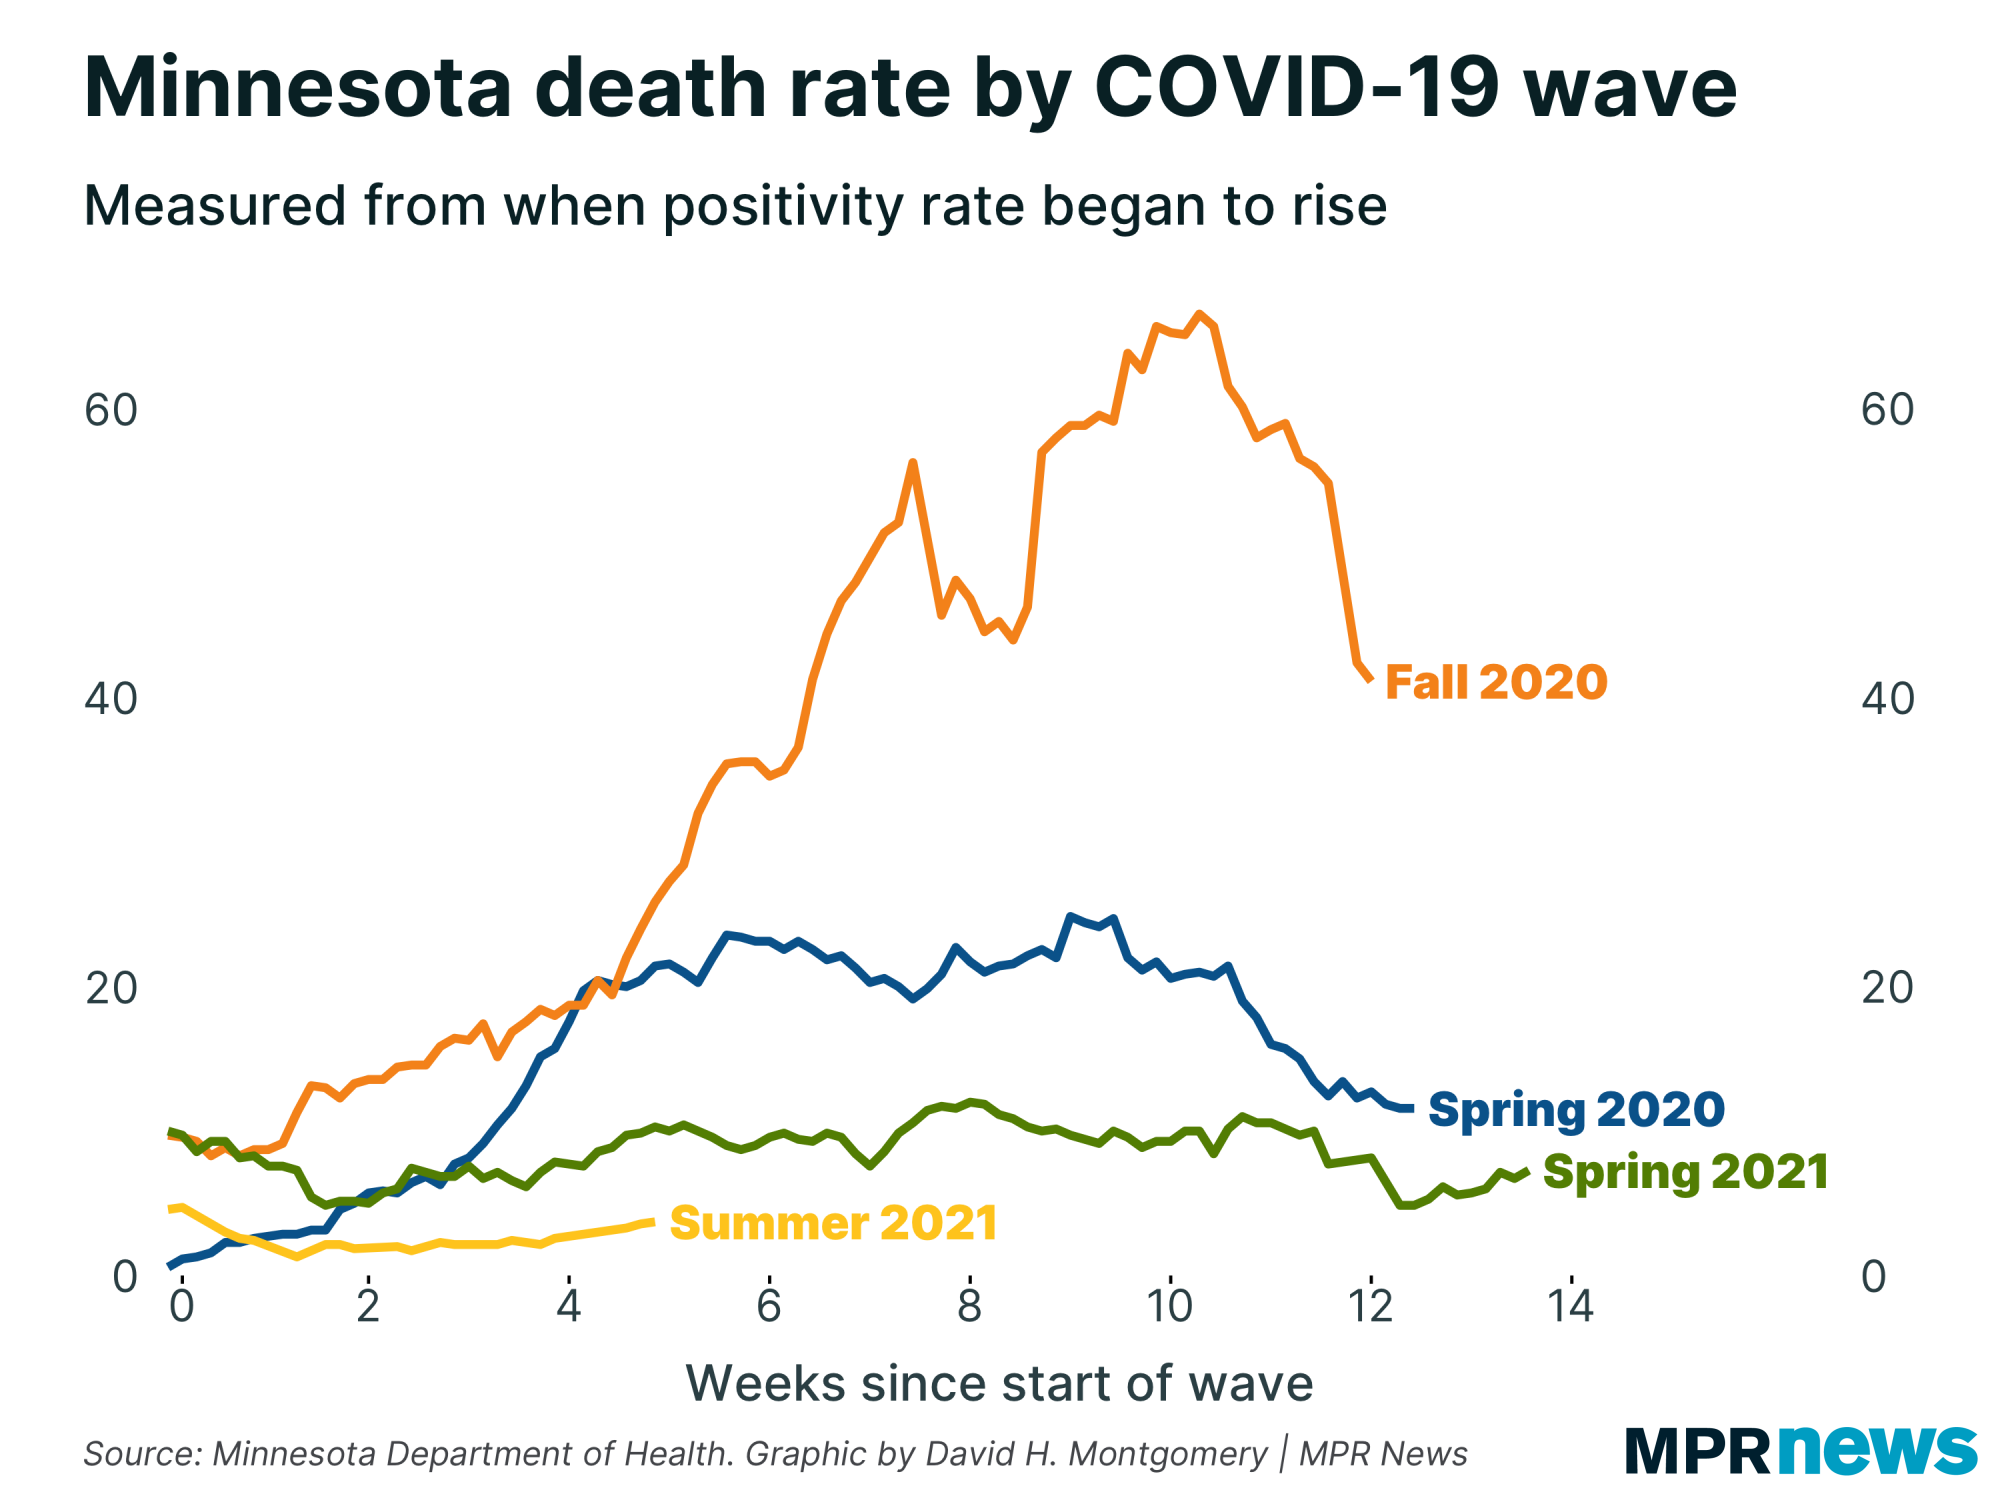
| Deaths are up even more gradually, from an average of just below 2 COVID-19 deaths per day in mid-July, up to nearly 4 per day now. | | |
|
|
| And when you line up death rates by wave, the current increase barely registers: | | |
|
|
Vaccination rates continue to rise
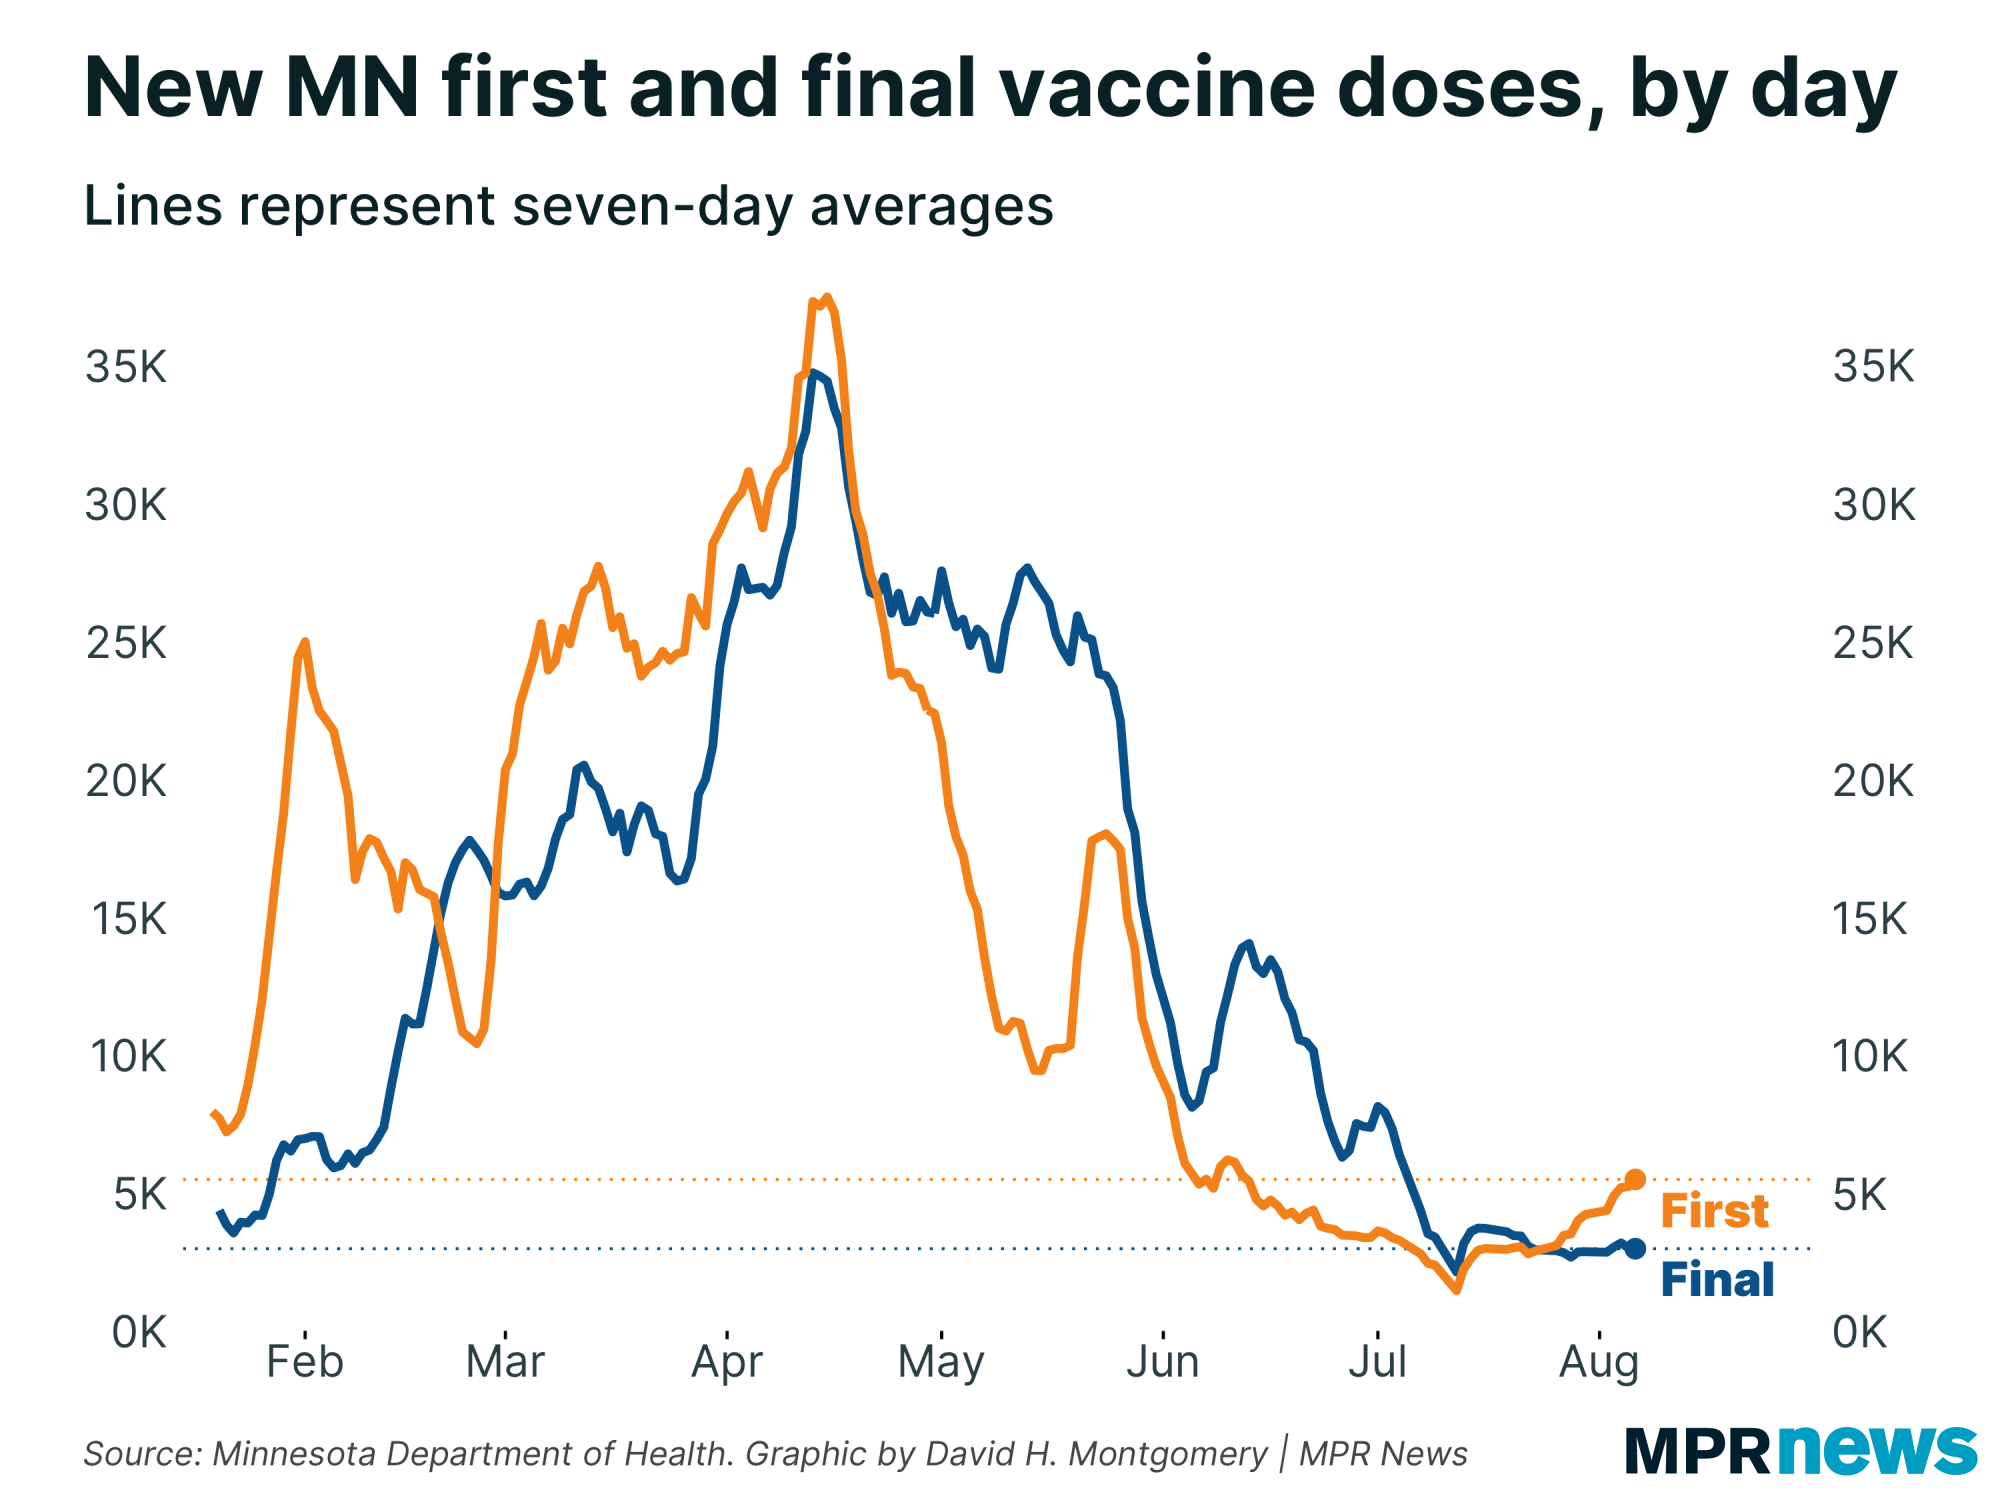
| | Vaccination rates continue to rise steadily, possibly due to fear of the delta variant, possibly due to a host of mandates and incentives. We're now up to about 5,500 new first doses per day on average, from a bottom near 2,000 per day in early July. |
| |
|
|
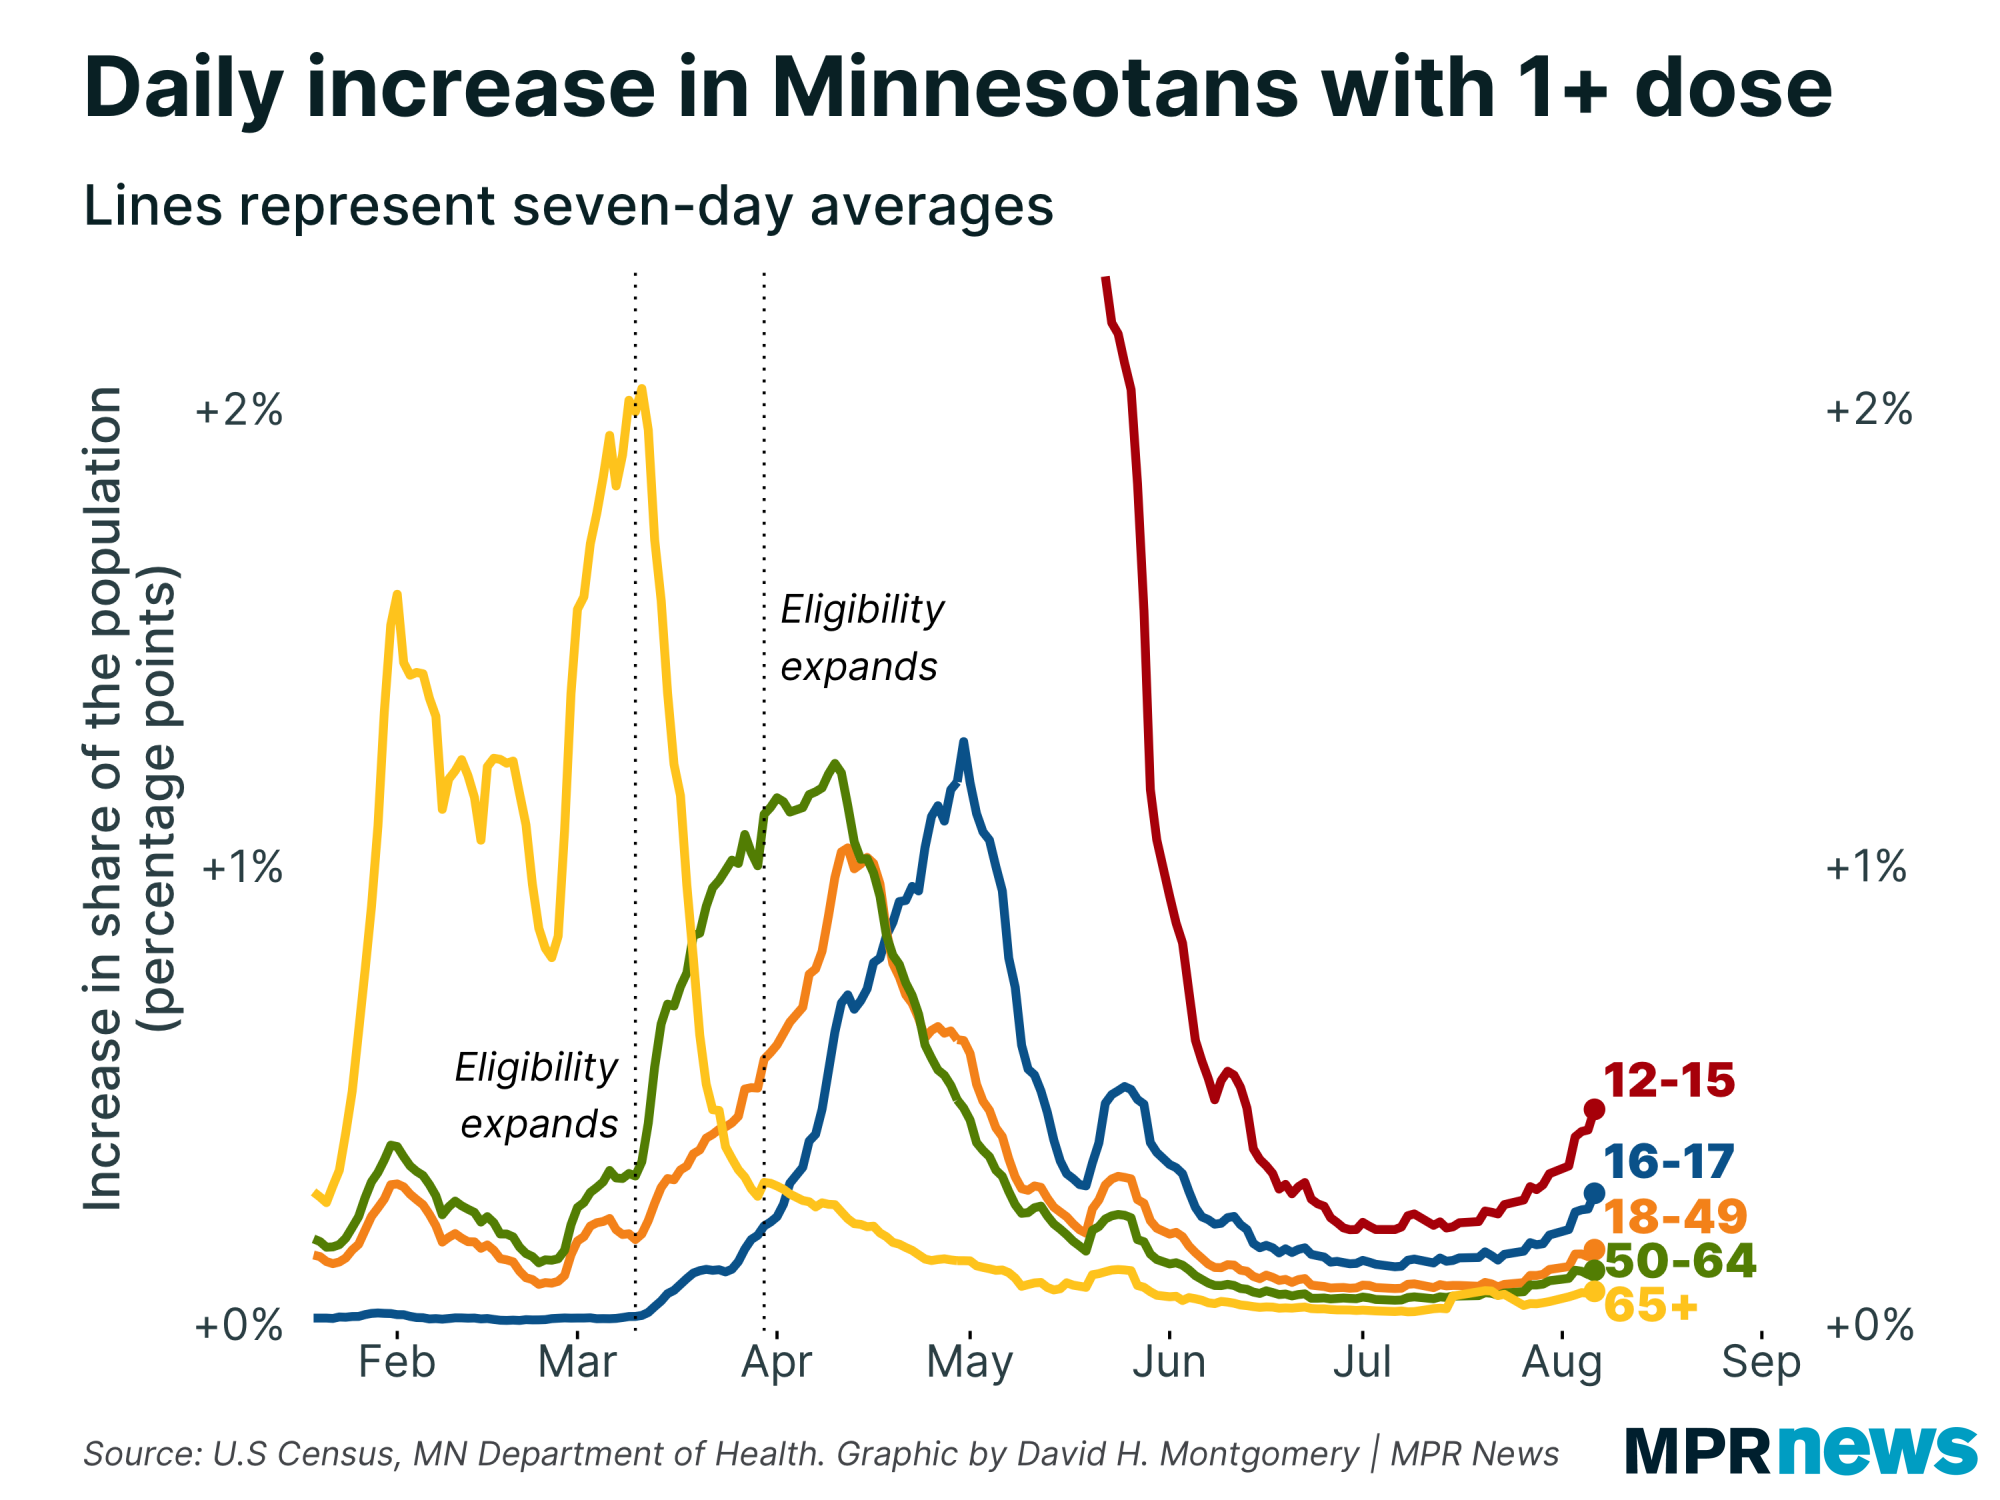
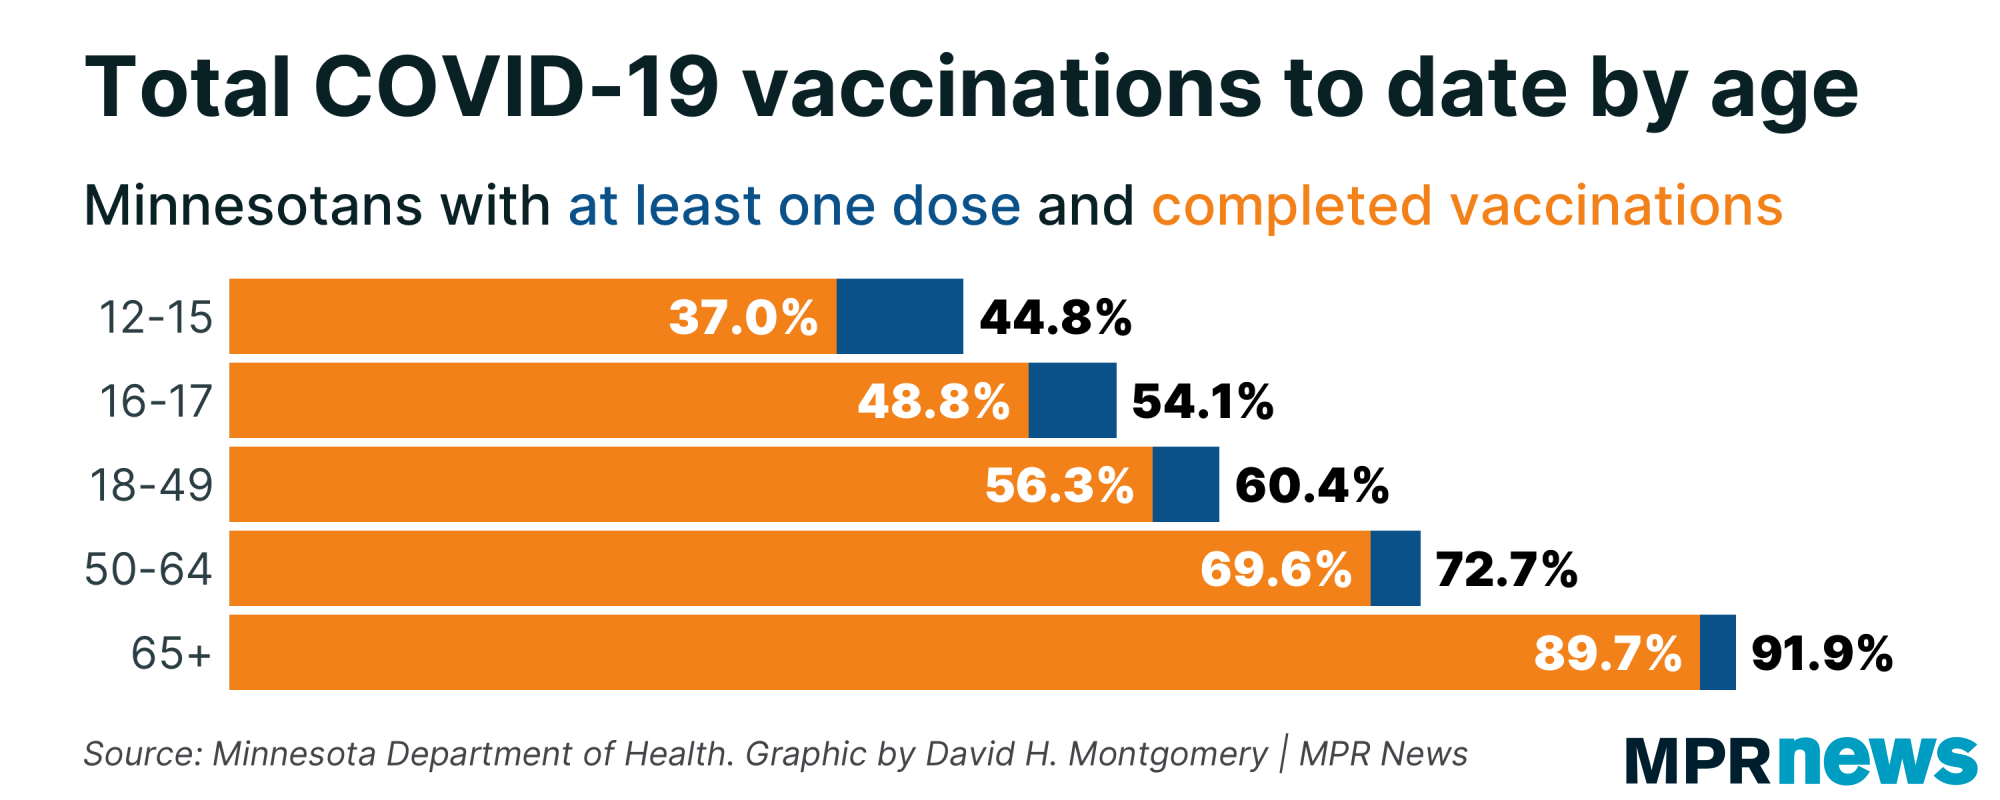
| The growth in new vaccinations has been concentrated in teenagers, though every group is up. | | |
|
|
| Of course, these younger groups still have larger numbers of unvaccinated people. Vaccination rates are still strongly correlated with age (as, by and large, is the risk of serious complications from the disease, though even young, healthy people can have serious cases). | |
|
|
|
What's happening next?
|
I'll keep you posted on how my prediction turns out, and also hopefully check in more detail — finally — on how this current wave is affecting different demographic groups.
Thanks for subscribing to this newsletter and for all of you who've sent me your feedback. As always, if you like this newsletter, please share it and the sign-up link with others who you think might enjoy it.
— David |
| |
|
|
Preference Center ❘ Unsubscribe You received this email because you subscribed or it was sent to you by a friend. This email was sent by: %%Member_Busname%%
%%Member_Addr%% %%Member_City%%, %%Member_State%%, %%Member_PostalCode%%
  |
|
|
| | |