| Welcome back to COVID in Minnesota TODAY, an email newsletter from MPR News about understanding the latest developments in Minnesota's COVID-19 outbreak. | | |
|
|
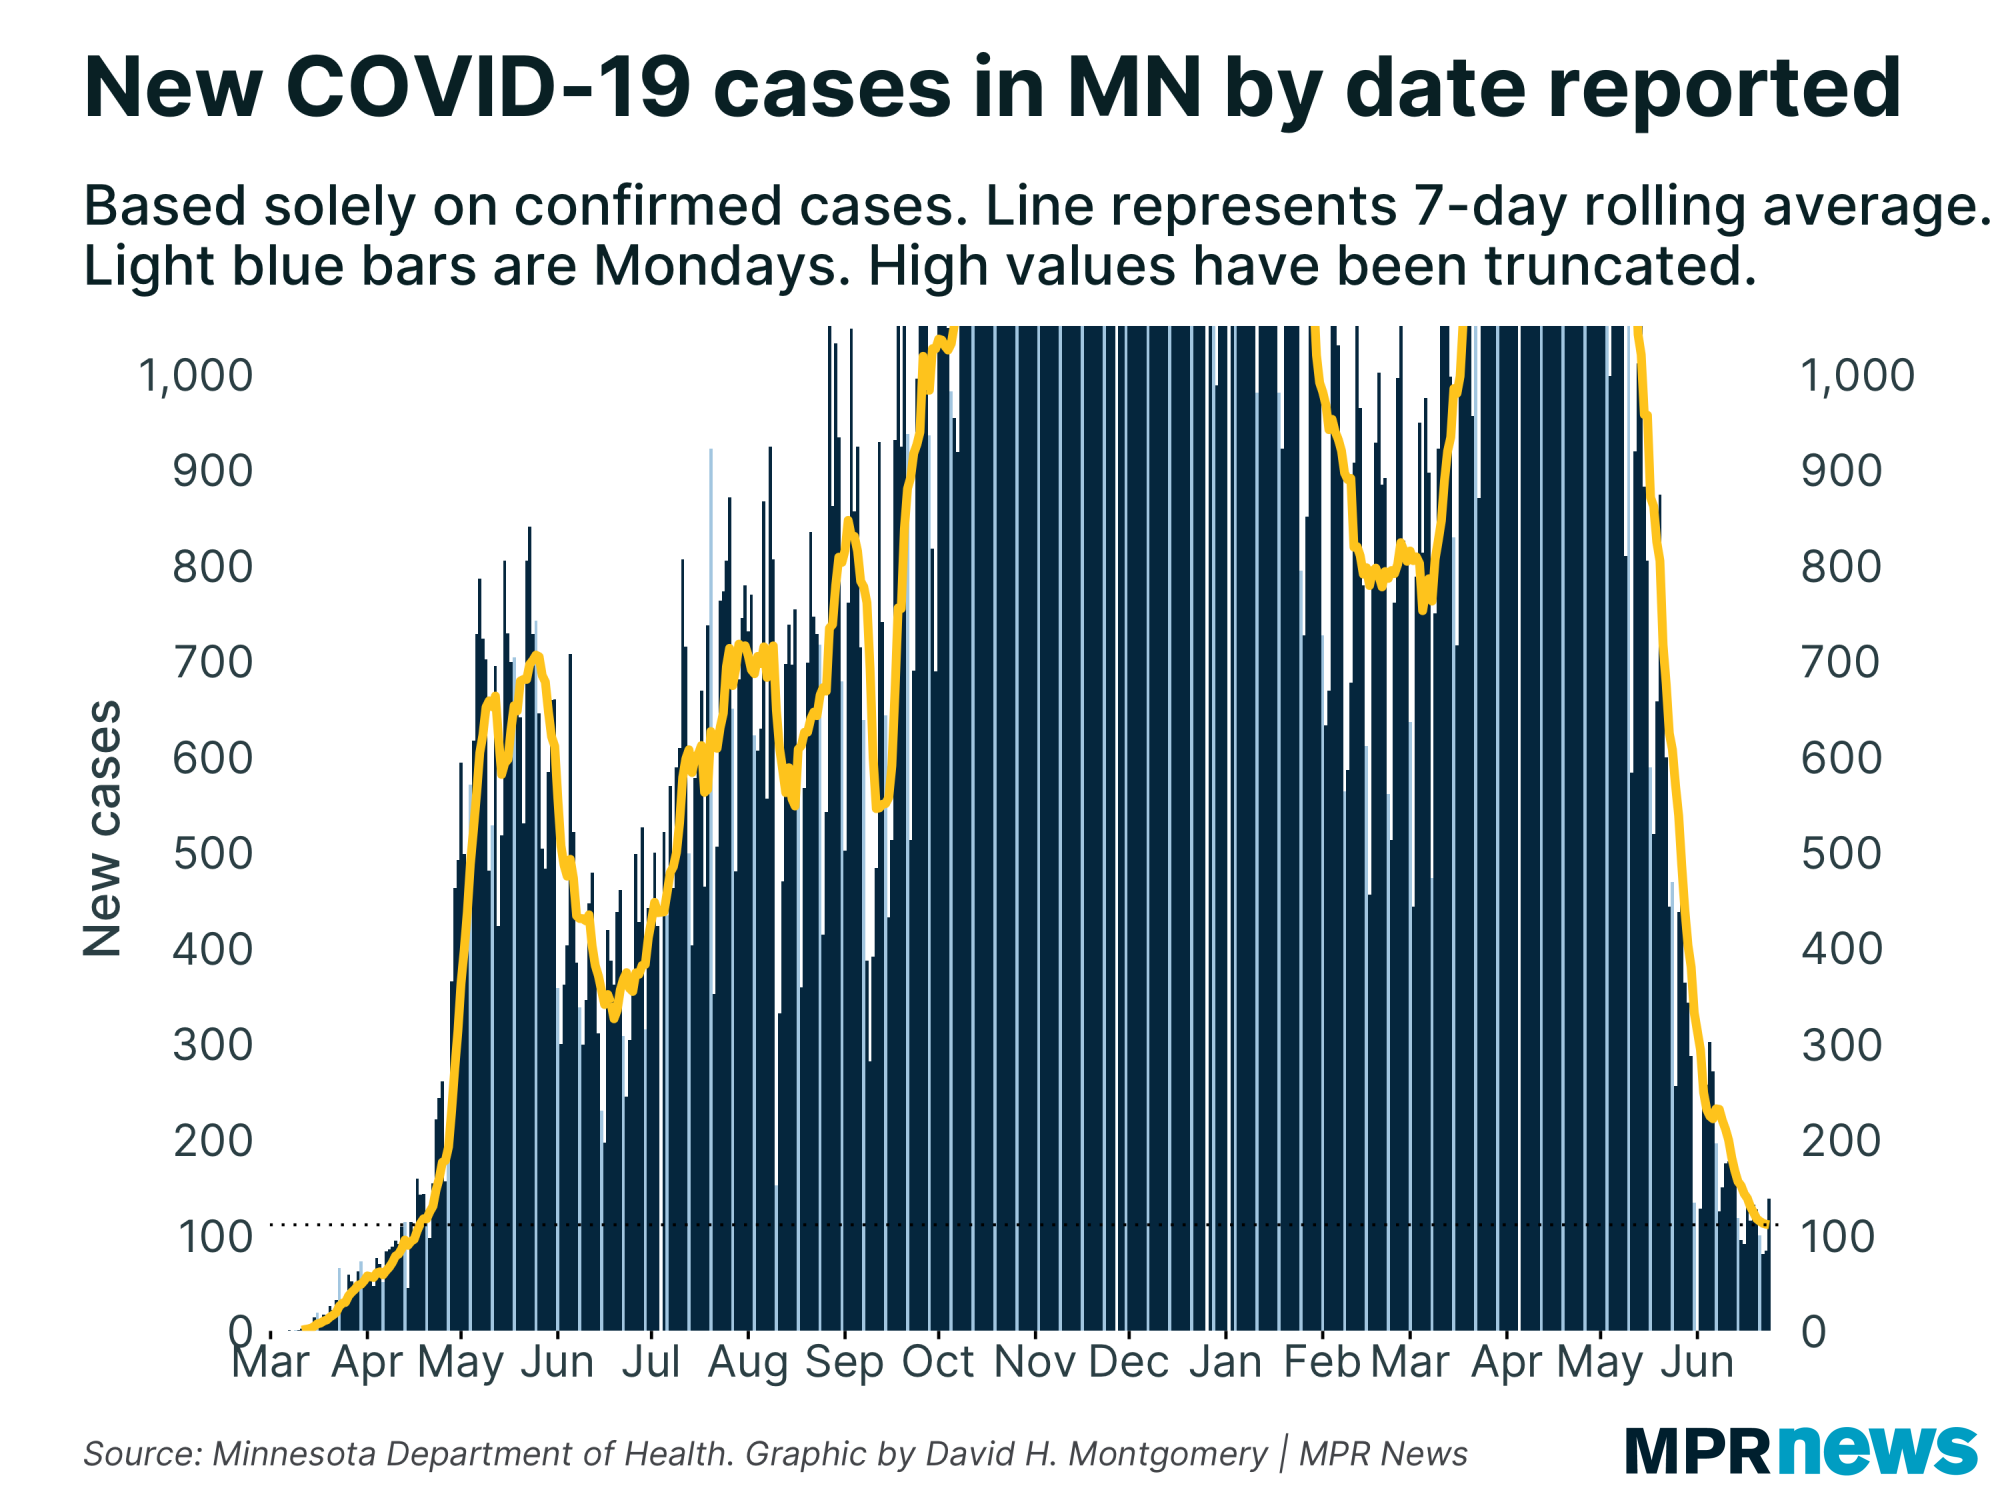
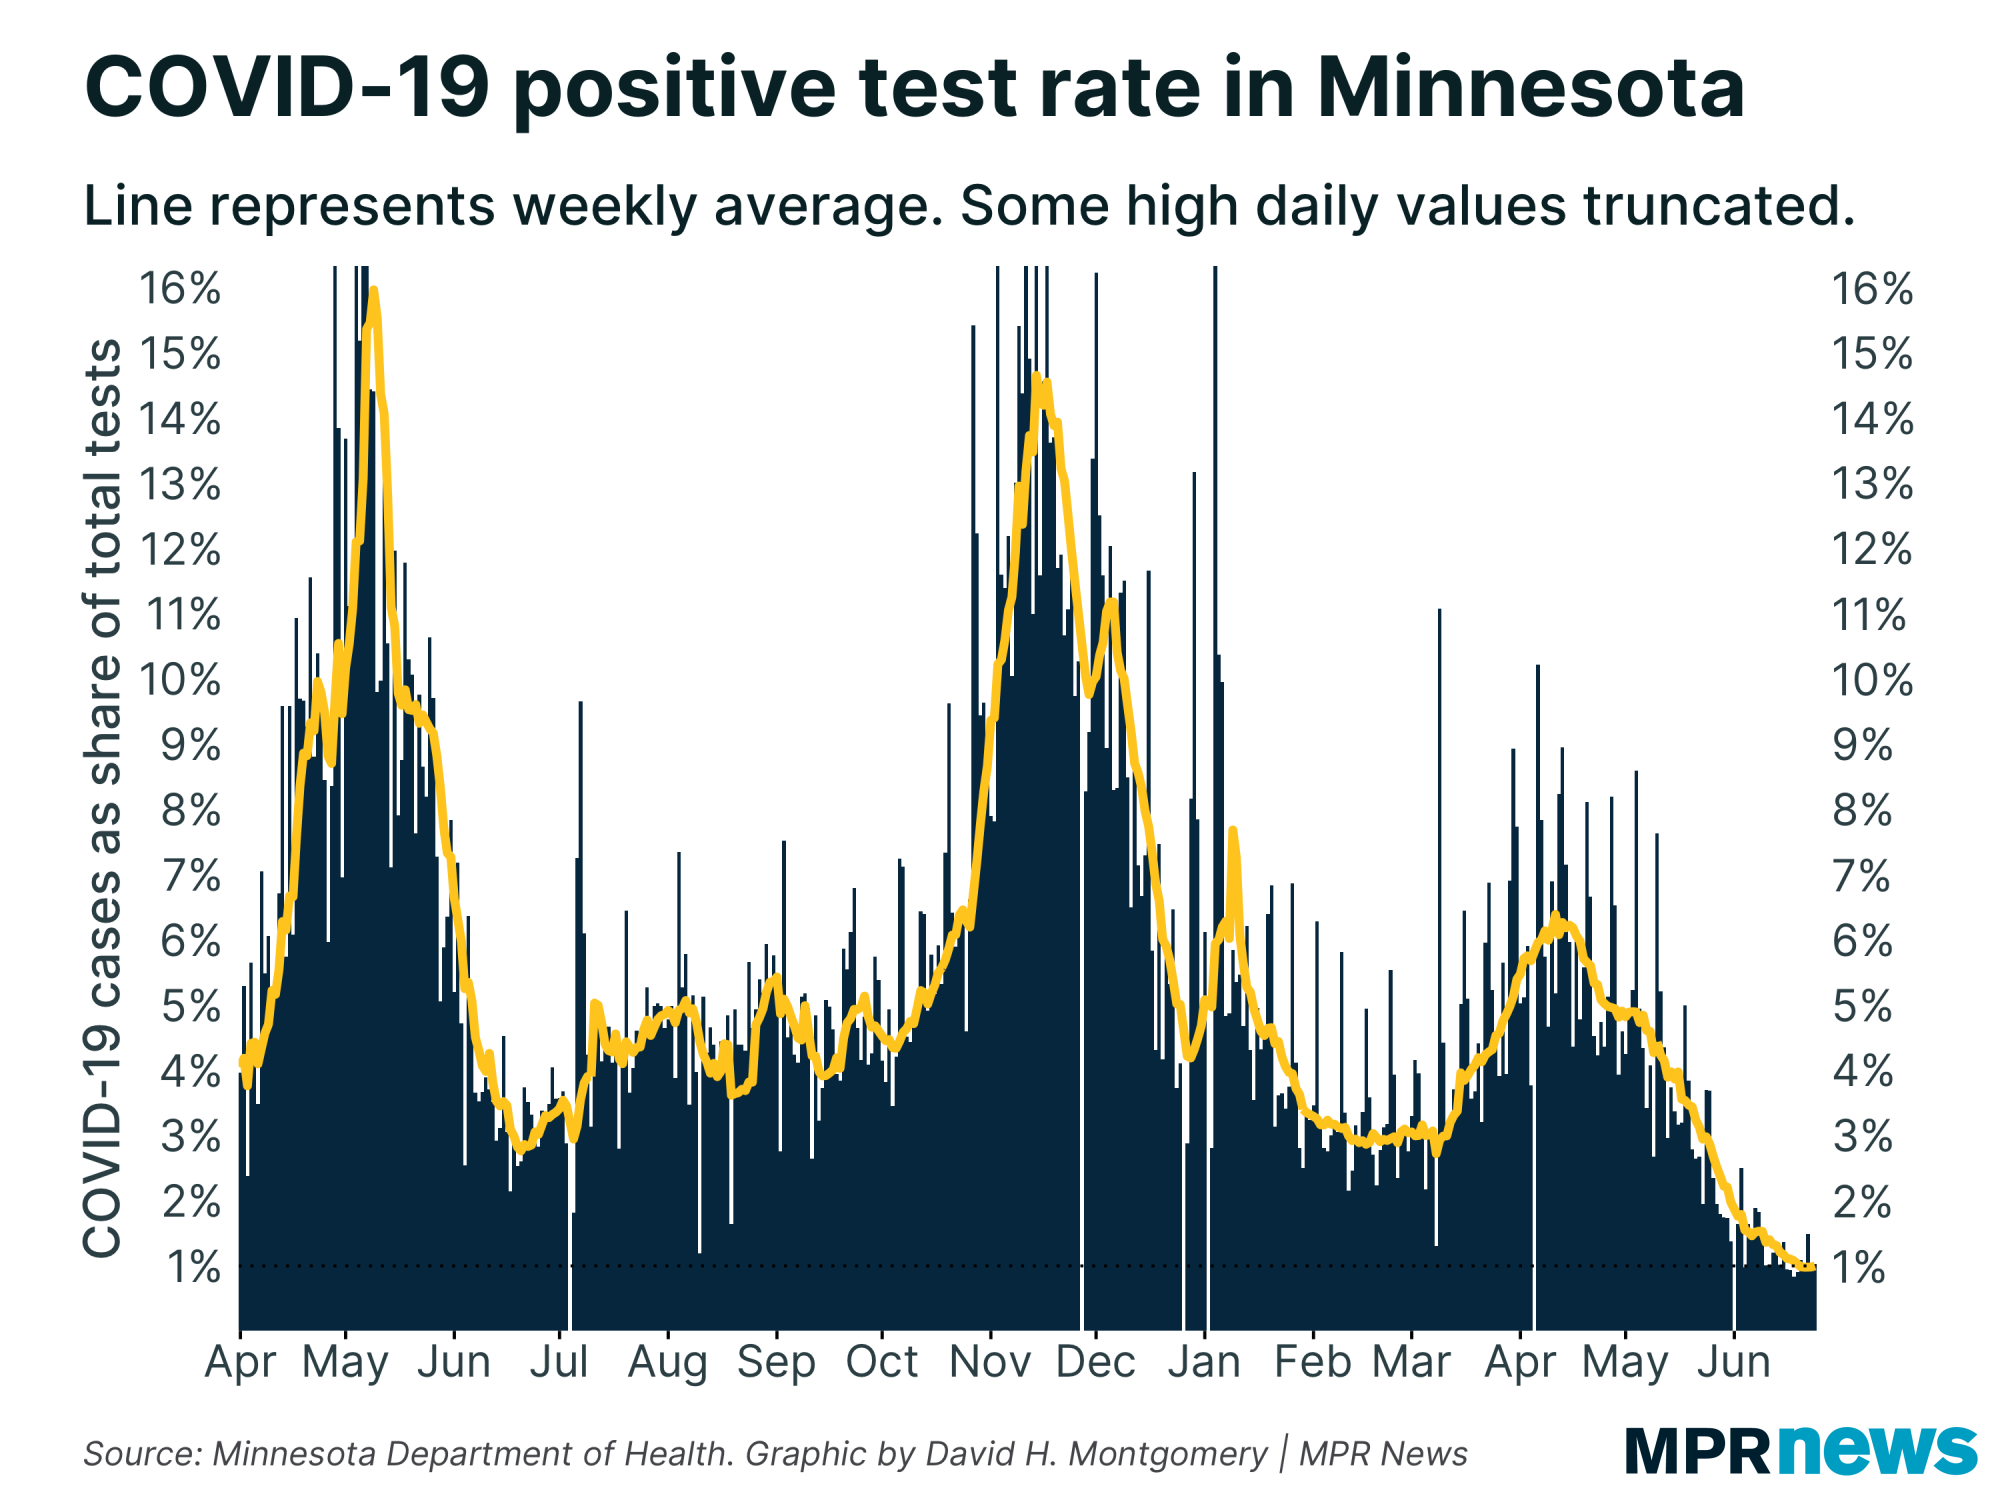
Minnesota's COVID-19 outbreak continues to diminish, with our average positivity rate now below 1 percent and cases edging down to 100 per day. Even deaths, long a laggard, have finally dropped a bit.
The biggest question now is how long this will last. With vaccination rates stalling out a little over 50 percent of the population, it's possible that enough Minnesotans still lack immunity from vaccination or infection to allow the virus to circulate broadly, especially the new, more contagious variants. Or not — maybe there just aren't enough susceptible hosts remaining for the virus to experience more than extremely localized outbreaks.
So in the near term, I'm watching to see if cases, hospitalizations and deaths continue to fall, or if we eventually reach a plateau or even start rising again.
Read on for a look at the current stats, as well as variants and another look at the issue of false positives. |
| |
|
|
| Cases continue to fall, but this week has seen an apparent slowing in the pace of improvement. In the past few days, Minnesota has averaged one or two fewer new cases per day. Last week we were regularly seeing drops of five to 10 per day. | | |
|
|
| It's something of the same story with positivity rate, which dropped below 1 percent on Sunday and has hovered around 0.97 or 0.99 percent ever since. | | |
|
|
Whenever we see a change in trajectory like this, we have to consider two possible interpretations: it's either a real change in the course of the disease, or it's just a temporary blip.
Back in mid-February, for example, months of decline in new case numbers petered out into a plateau that lasted for weeks before the third wave hit. Last July, a rise in positivity rate turned out to not be a new wave, flattening out to a summer-long plateau.
On the other hand, you have moments like we saw for a few days earlier this month, when positivity rate plateaued at around 1.5 percent for several days, and I wondered if we'd bottomed out. Turns out, nope, it was just temporary, and after a few days it resumed falling.
So what's happening now? Impossible to say. If we do bottom out at 1 percent positivity and around 100 new cases per day, that's not disastrous — the current level of infection is the mildest Minnesota has seen since the pandemic got going. But after the past year-plus, we'd all like to see these numbers keep going down!
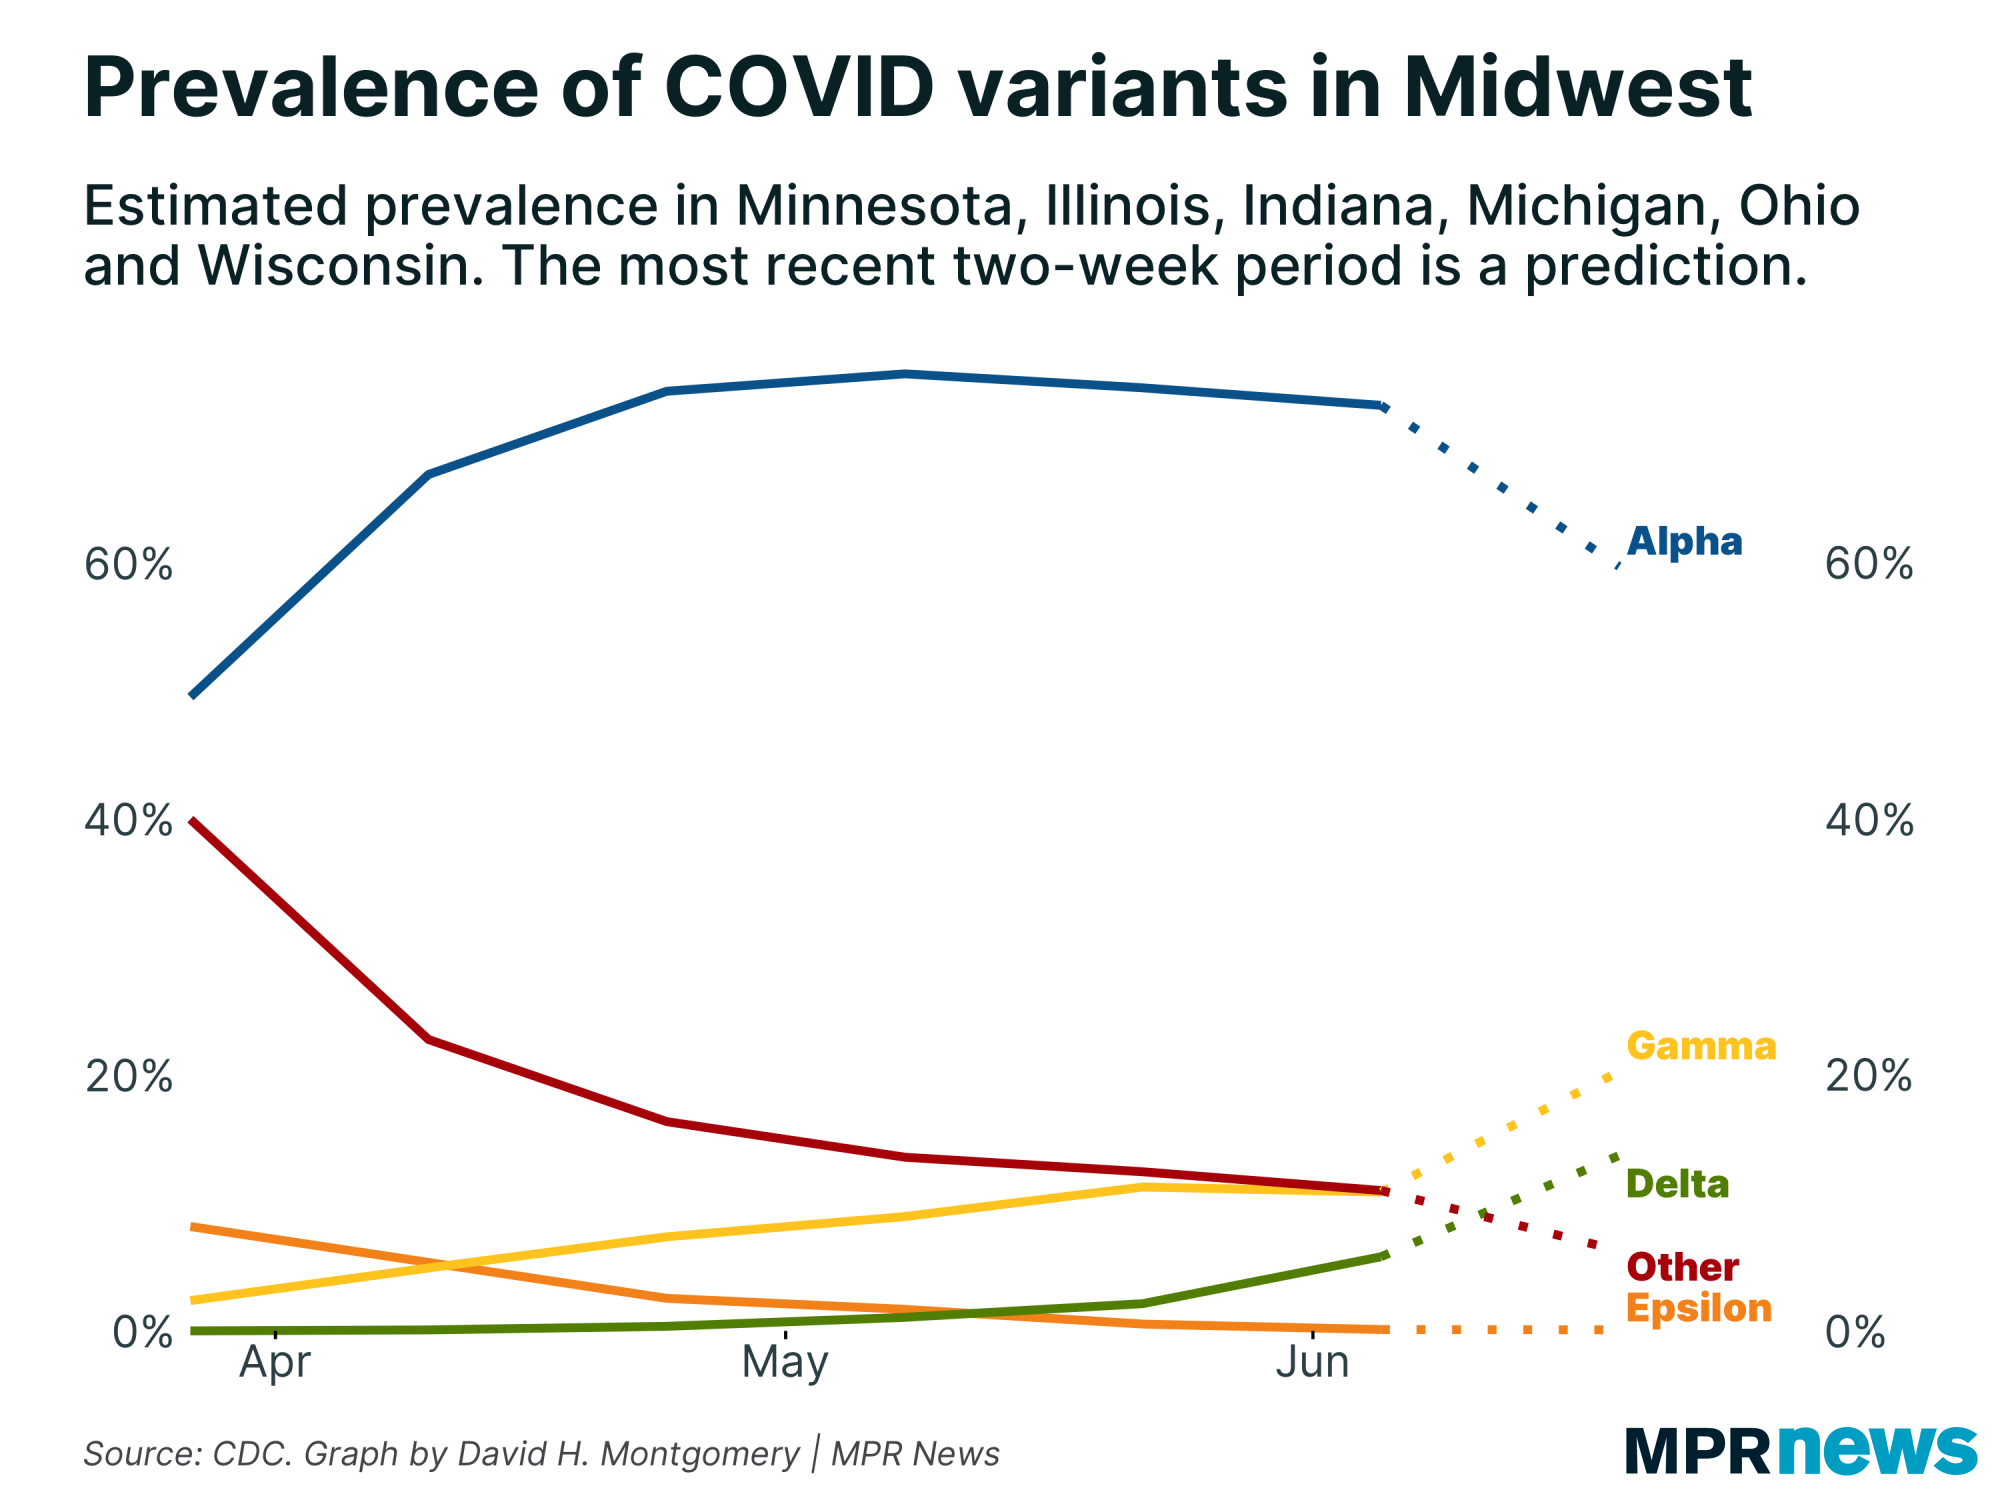
The wild card in all this is the new variants, which are generally more contagious than earlier versions of the coronavirus. In particular, some experts are worried about the delta variant, first detected in India, which has surged to represent more than 90 percent of all new infections in the United Kingdom.
That may yet happen in the United States, too, where delta is around 20 percent of all infections. It's a little less prevalent in the Midwest, with around a 15 percent share of cases lately — though rising. |
| |
|
|
Evidence suggests that fully vaccinated people aren't at risk from the delta variants, and even single doses provide some protection (just not as much as against other variants). But we don't know how many of the just under half of Minnesotans who are unvaccinated also have some immunity.
This model estimates around half of unvaccinated Minnesotans have a prior infection, for total population-level resistance levels somewhere around 70 percent.
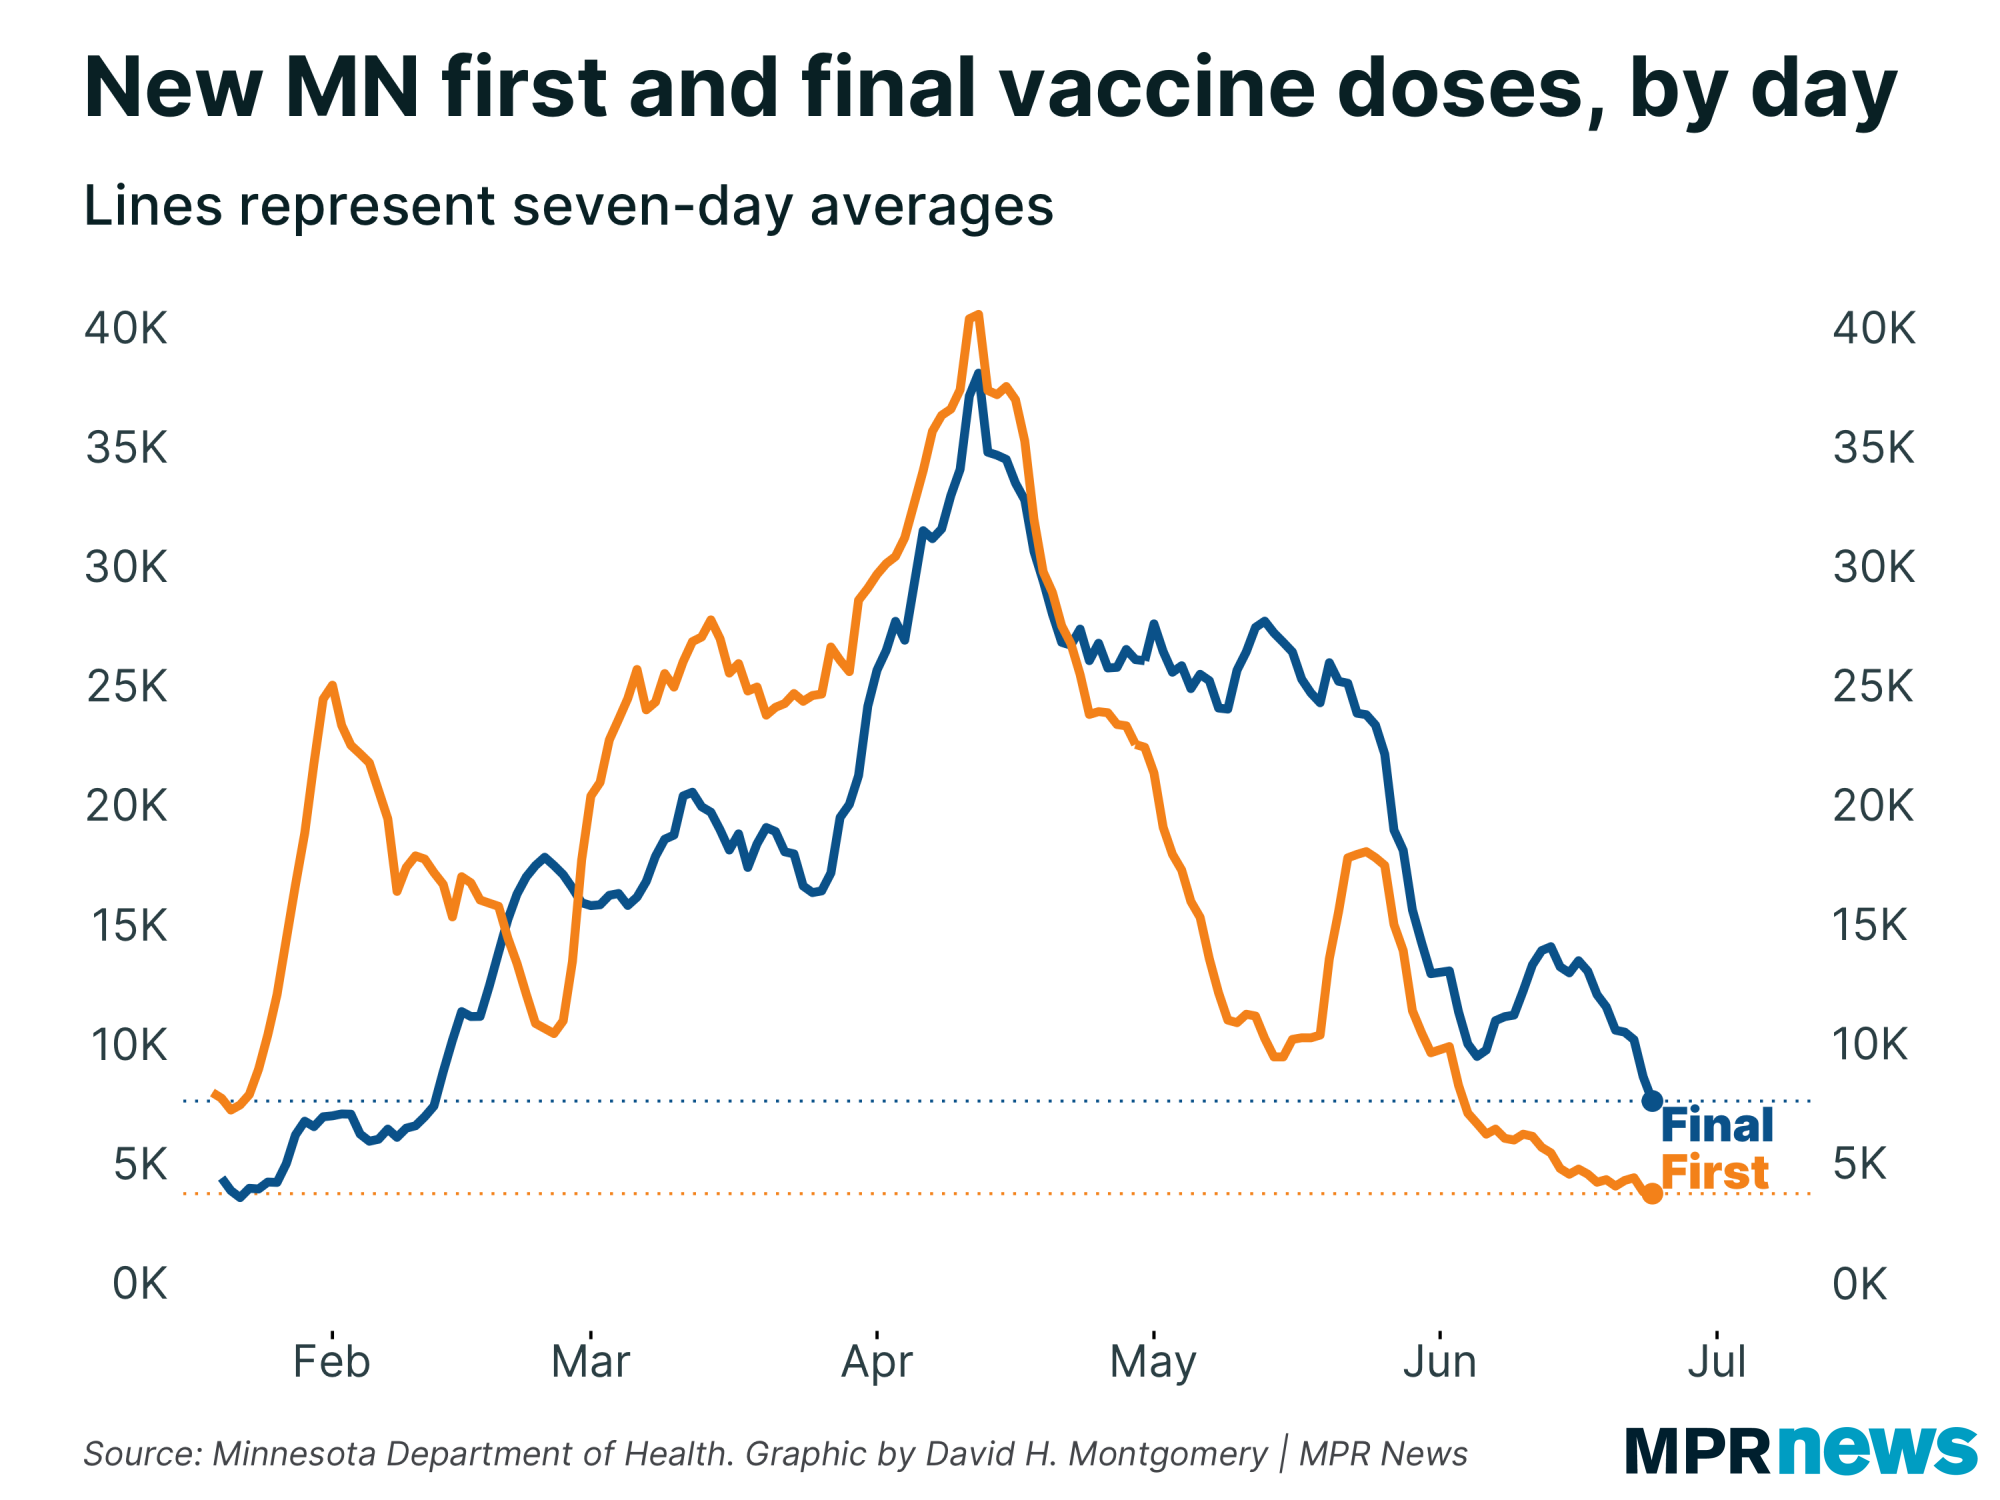
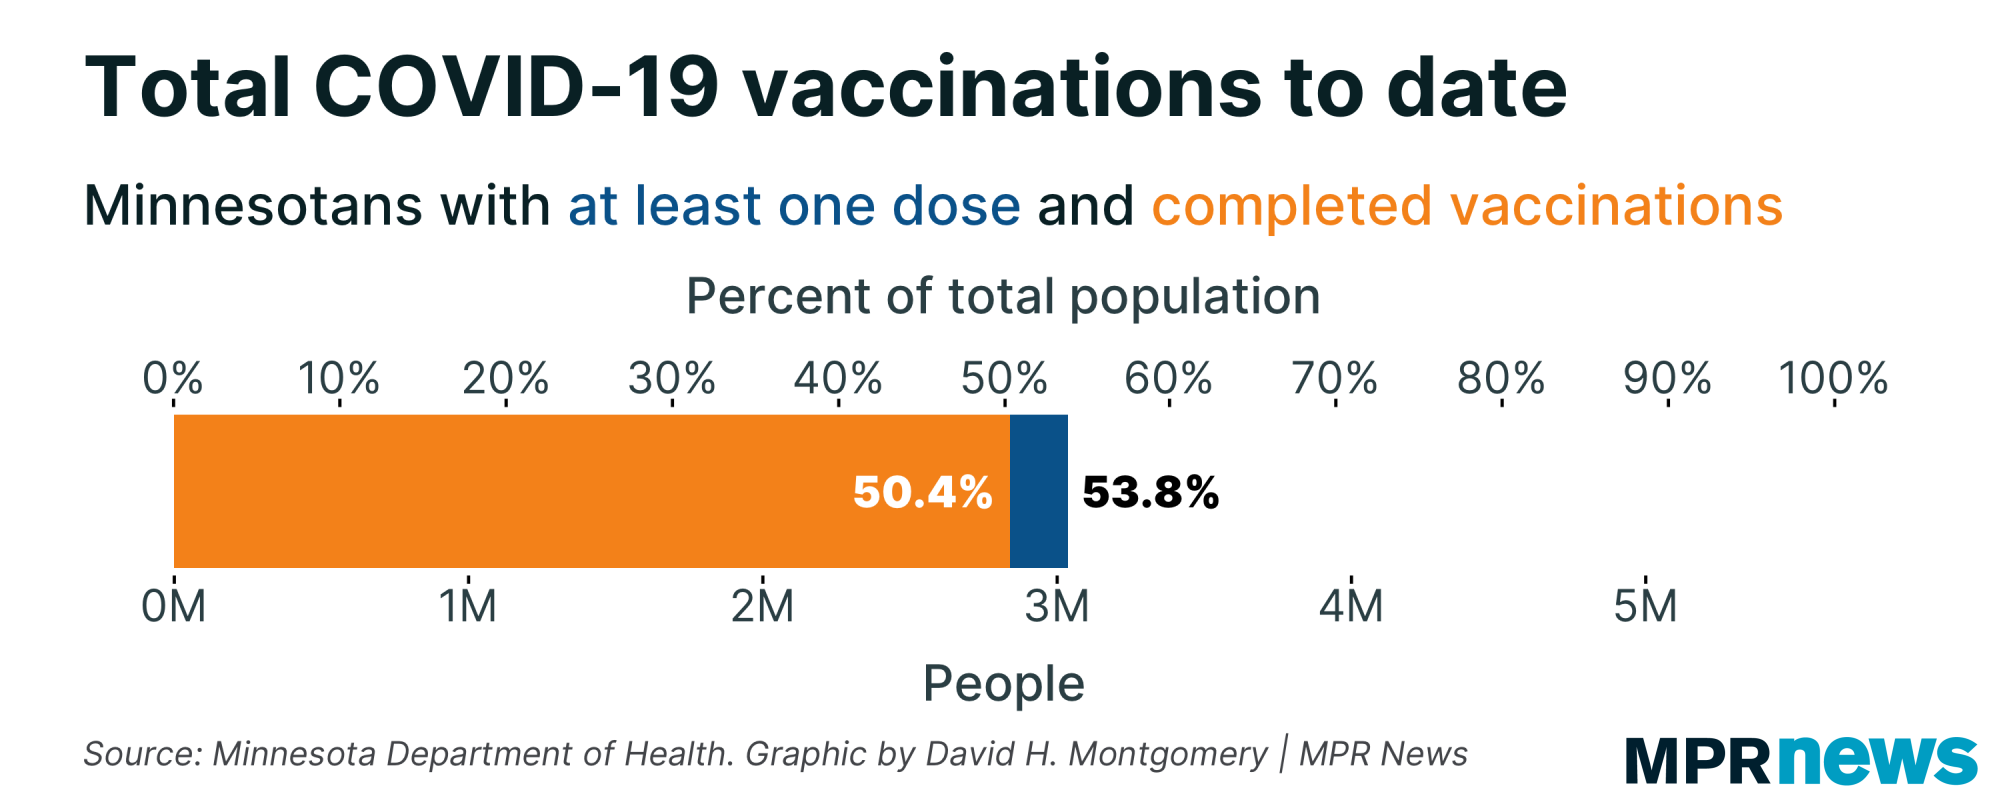
Whatever the number is, though, it's not increasing very quickly. There are something like 2.6 million unvaccinated Minnesotans, and we're adding fewer than 4,000 new vaccinations per day (and falling), on top of just over 100 new infections per day. |
| |
|
|
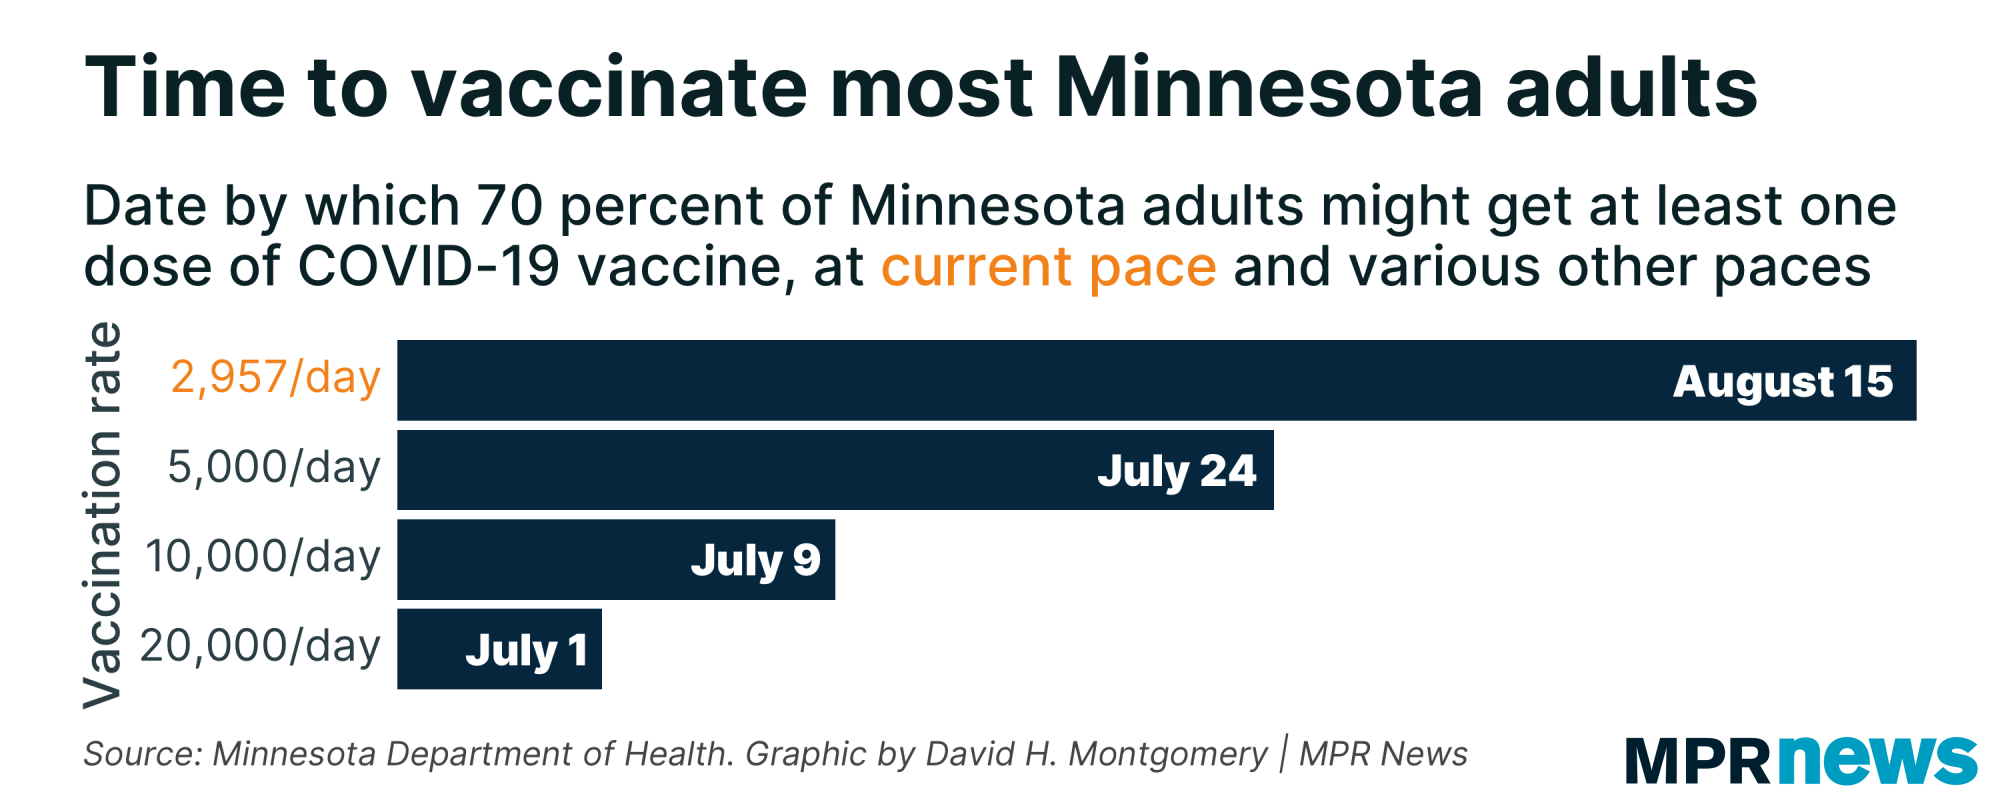
The arithmetic from those numbers is pretty simple. To vaccinate half of those remaining 2.6 million would take two years at the current pace (but just two months at a 20,000 per day pace like we exceeded for months this spring).
Even the state's goal of 70 percent of adults vaccinated — a much more reasonable target — (we're at 65.5 percent), is looking further and further by the day as vaccinations slow. At the current rate, it would take until mid-August to administer those additional 150,000-plus shots, and all the trends point to it taking even longer. |
| |
|
|
False positivity, revisited
|
Last week I wrote about the issue of false positives, which are capable of really skewing the results of a medical test when the disease is rare in the tested population. For example, for a hypothetical test with a 1 percent false positive rate, the odds of a positive test result being real were 75 percent if 30 out of 1,000 people had the disease, but less than 10 percent if 1 out of 1,000 did.
Fortunately, I noted, the PCR tests for COVID-19 have essentially no risk of false positives. That means we can trust the stats these tests are giving us even as COVID-19 gets rarer and rarer. If they had a significant false positive rate, then as the disease got rarer, the tests would be flooding the zone with false positives.
But PCR tests aren’t the only kind of test out there. There are also antigen tests, often used as rapid tests. They account for about 17 percent of Minnesota’s COVID-19 tests right now — and they do have non-negligible false positives.
One study found that antigen tests have a false positive rate of 0.4 percent. That seems like a really low number, and it is – more than twice as accurate as the 1 percent false positive example I gave earlier.
But twice as accurate still only gets you to about 19 percent of positives being real — or 81 percent being fake — when 1 out of 1,000 people had the disease. That’s still a lot of false positives.
So do we have to worry about these antigen tests skewing Minnesota’s numbers? Perhaps surprisingly, the answer is not yet — and the reason why has some interesting implications.
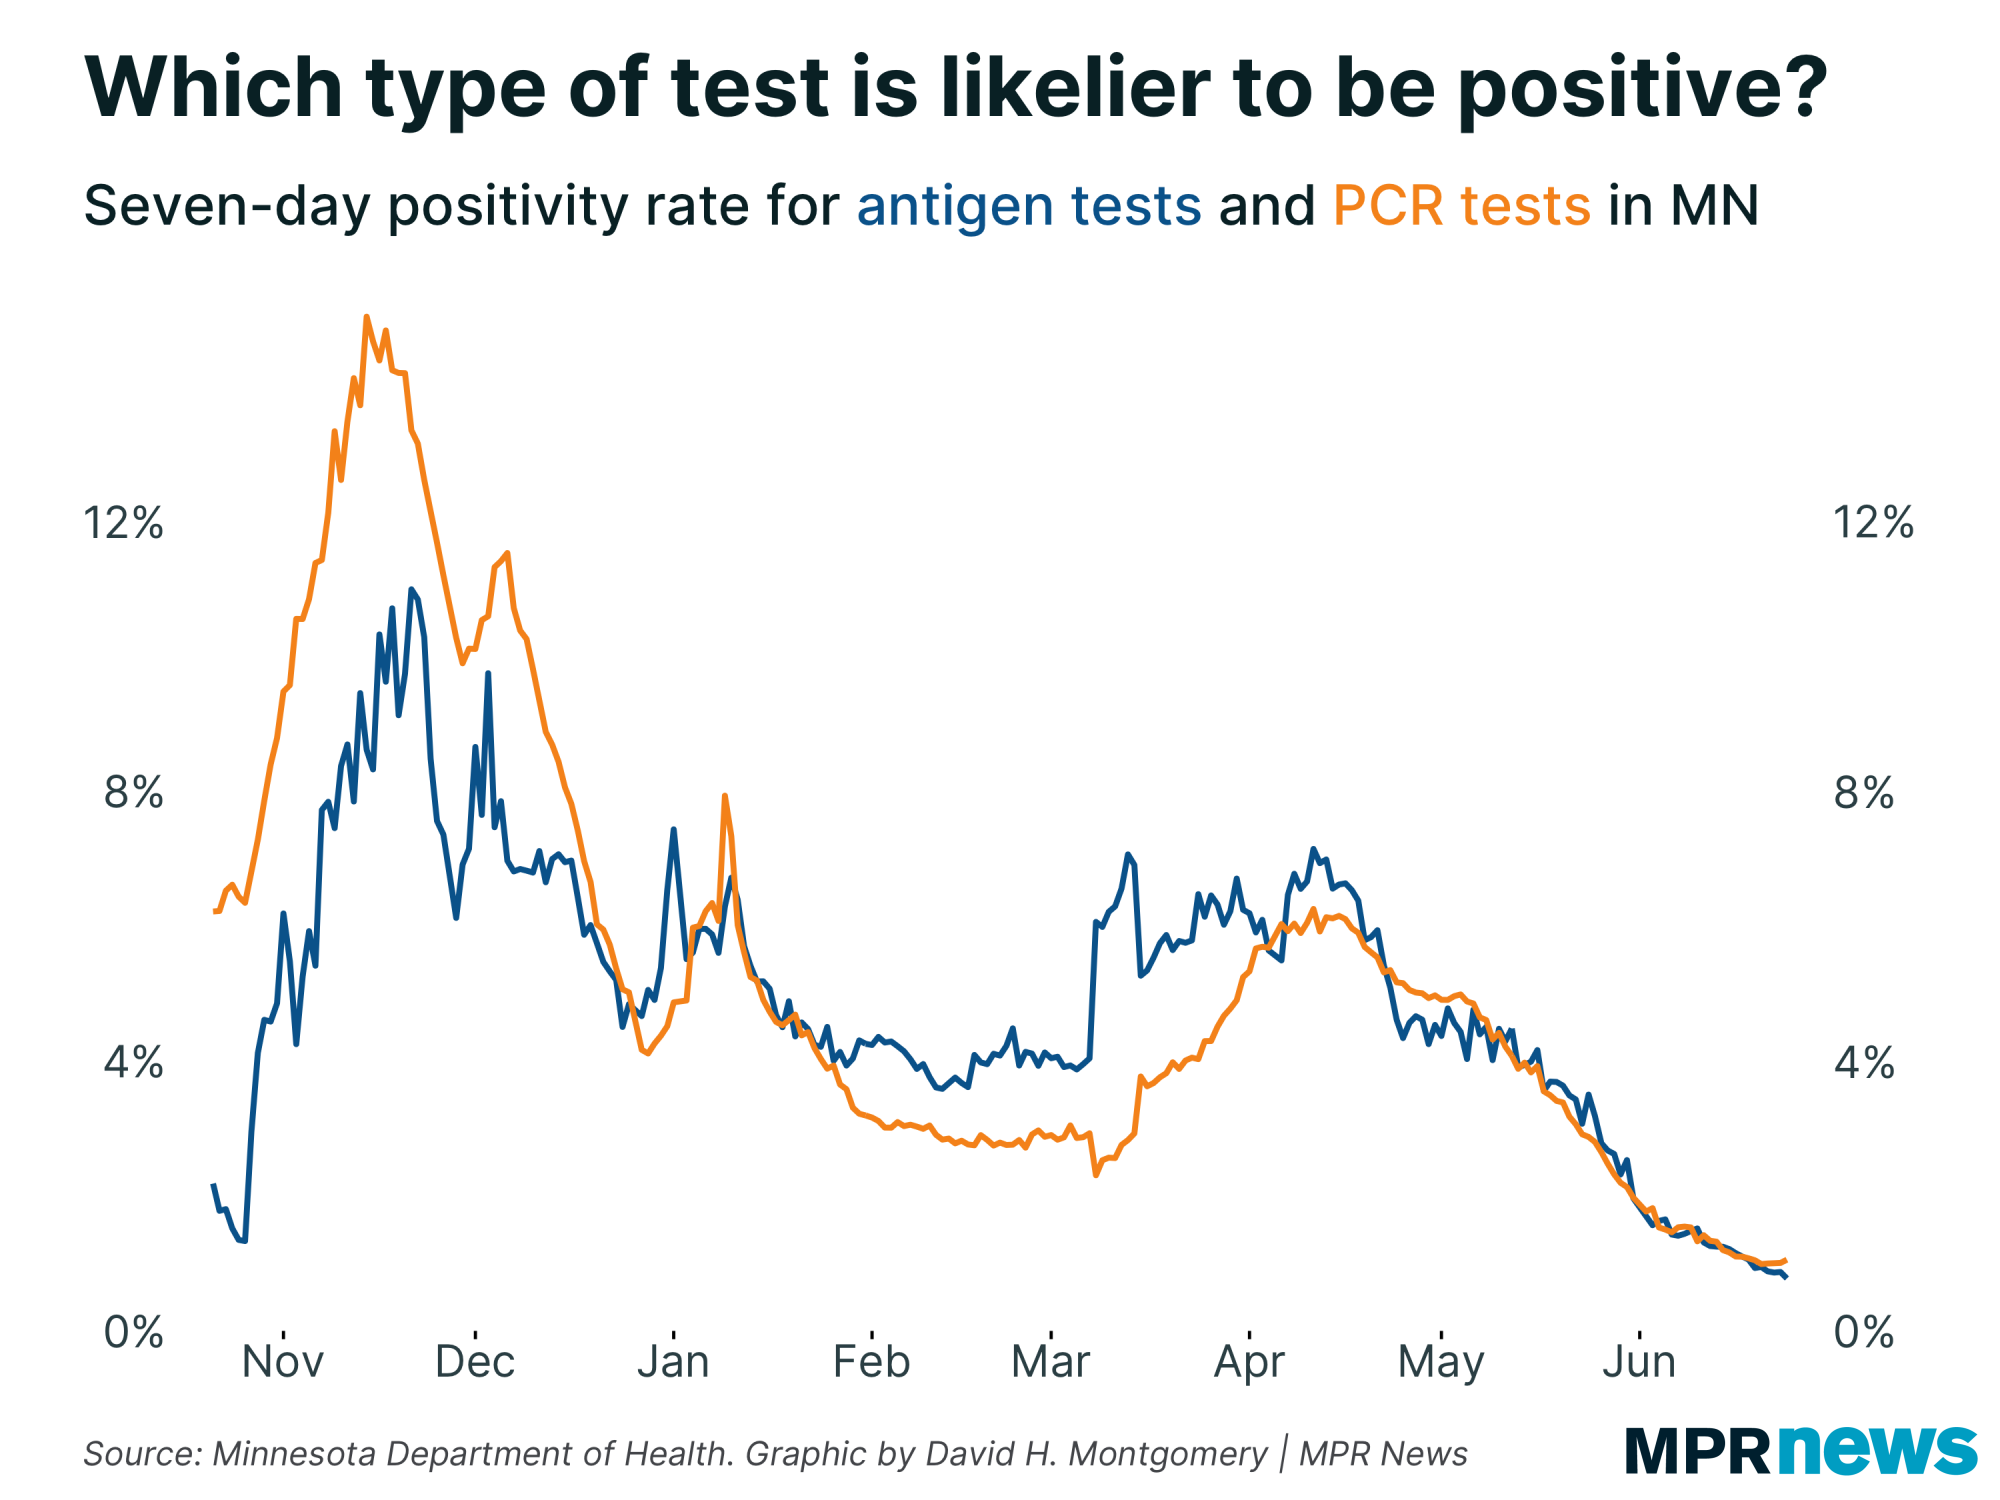
To test what kind of impact these antigen tests were having, I compared the positivity rate from antigen tests to that from PCR tests. (I used 7-day averages, of course, to smooth out daily variation.) Our data on antigen tests goes back to late October 2020 — the early stages of the fall wave. |
| |
|
|
As you can see, early on, antigen tests were much less likely to be positive than PCR tests. It’s possible this reflects the fact that antigen tests are much less sensitive than PCR tests — more likely to produce false negatives. It’s also possible this reflects the different ways that rapid tests were used, including mass testing of asymptomatic people before entering events.
But near the end of December, the two tests’ positivity rates came together.
In February, as the second wave receded, PCR positivity dropped, while antigen positivity stayed flat.
Finally, around the peak of the third wave in mid-April, the two positivity rates synced up again and have moved more or less in lockstep ever since. (The antigen positivity rate has dipped below the PCR positivity rate a little in recent days, but I'm not sure how significant this is yet.)
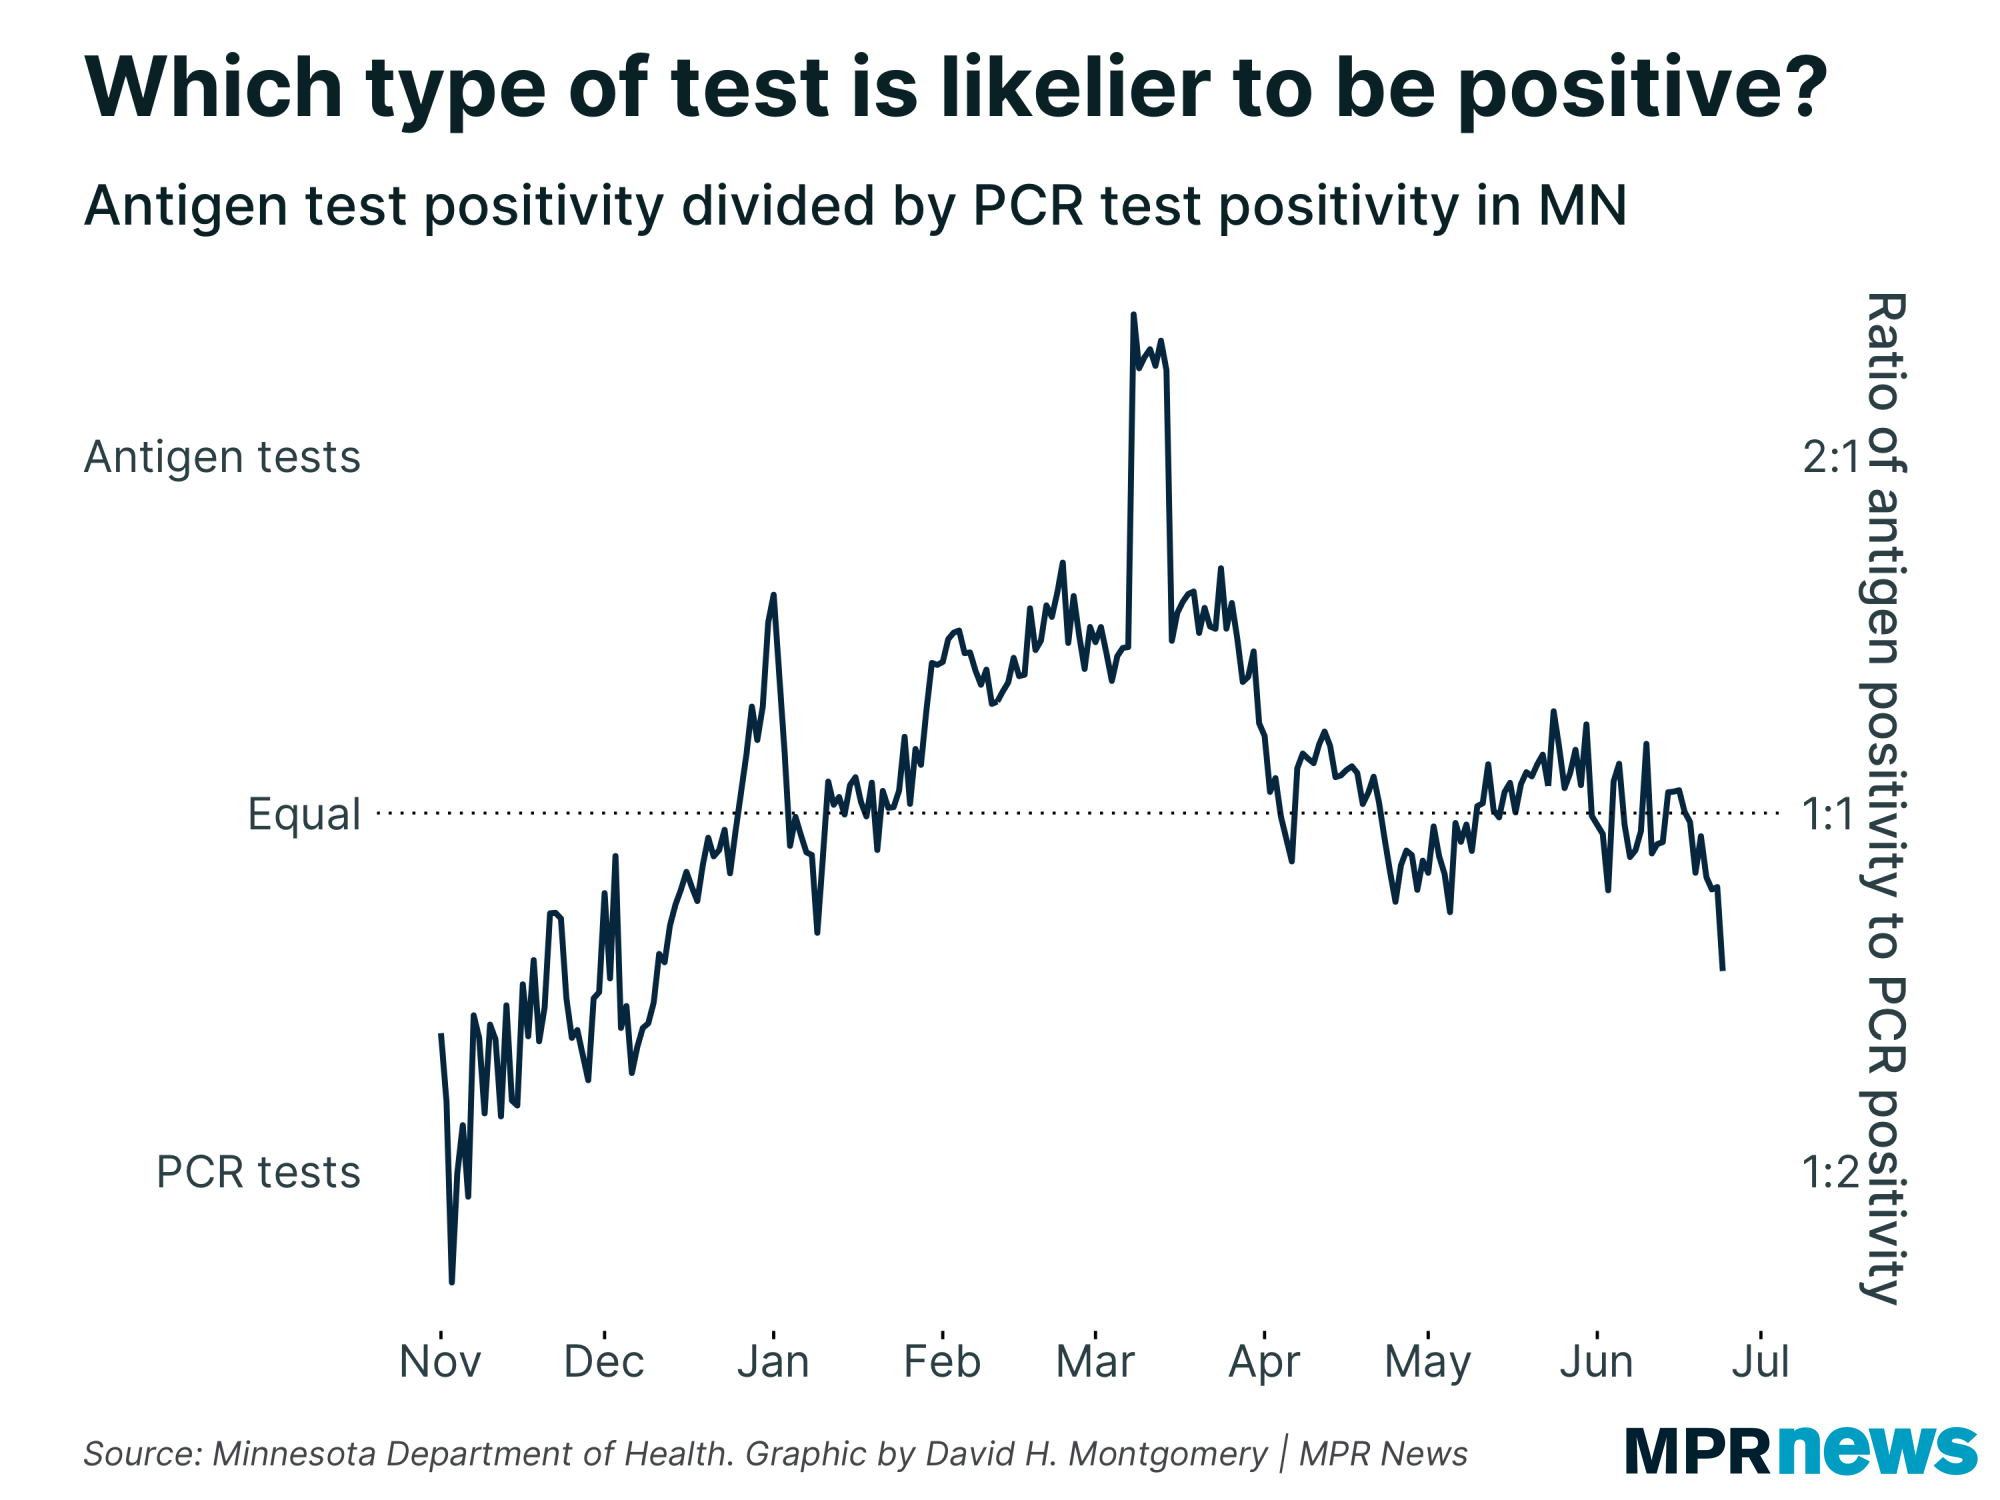
Here’s another version of that same chart, showing the ratio between these two values. Values greater than 1:1 mean antigen tests have a higher positivity rate, values around 1:1 mean they’re similar, and values below mean PCT tests have higher positivity. |
| |
|
|
(You’ll note in late March a data anomaly skews the ratio. Just ignore this spike, caused by some backlogged data working through the seven-day average.)
Let’s take a step back. My hypothesis was that when case prevalence becomes really low, as it is now, antigen tests would start to show higher positivity rates than PCR tests, as they began producing a higher share of false positives.
We sort of saw that happening back in February, when the second wave receded. At that time, PCR positivity dropped while antigen positivity didn’t.
But that’s not happening right now. So what’s up?
I don’t have any solid answers here, and I’m somewhat out on a limb. But here are a few guesses:
- This metric just isn’t telling us what I want it to tell us; perhaps it’s mostly measuring changes in how these tests are administered, not catching false positives
- Perhaps the prevalence of the disease in Minnesota right now isn’t low enough yet to create a meaningful distortion here
- Most intriguingly: Perhaps the prevalence of COVID-19 is really low in Minnesota — but not among the population of people at risk for COVID-19
I want to take each of those three in turn. |
| |
|
|
What the bleep do we know?
|
Our minds are really good at noticing patterns — even if patterns aren’t really there. That’s why I’m constantly cautioning people about over-interpreting apparent trends in the data, and especially against assuming that the disease responds simply and directly to human policy decisions.
So the very first answer we should keep in mind when seeing something odd in the data is, “It’s probably nothing.”
(This advice does not apply, by the way, if you are a character in an action or horror movie, where weird sounds or radar blips are never nothing. But real life does not have screenwriters trying to streamline drama.)
So let’s consider what’s going on here. I’m comparing the positivity rates of two different types of tests and trying to ascertain something about the tests from the differences. But there are potential confounding variables, including differences in when the two types of tests are conducted. It’s not like people go in for a COVID-19 test and are randomly assigned one of two different types of tests! So we already have one variable that we know could be affecting the data here, which is worth keeping in mind as we hypothesize other possible explanations.
Also potentially important: sample size. You might notice in the positivity graph above that the PCR line was much smoother than the antigen line. That's because Minnesota conducts many more PCR tests than antigen tests, and by the law of large numbers, we'd expect more variance on the smaller numbers. (That's exactly why case counts, where we have hundreds or thousands per day, are typically much smoother than deaths, where we max out in the dozens.) That antigen line was bumpy even though it's already based on 7-day averages. It's entirely possible that any apparent signal in the data is just random noise. |
| |
|
|
How many Minnesotans actually have COVID right now?
| One of the key factors involved in analyzing false positives is the prevalence of the disease in the broader population. I've used made-up numbers, like one in 1,000 and 30 in 1,000, to examine hypotheticals. But what can we say about the real numbers here?
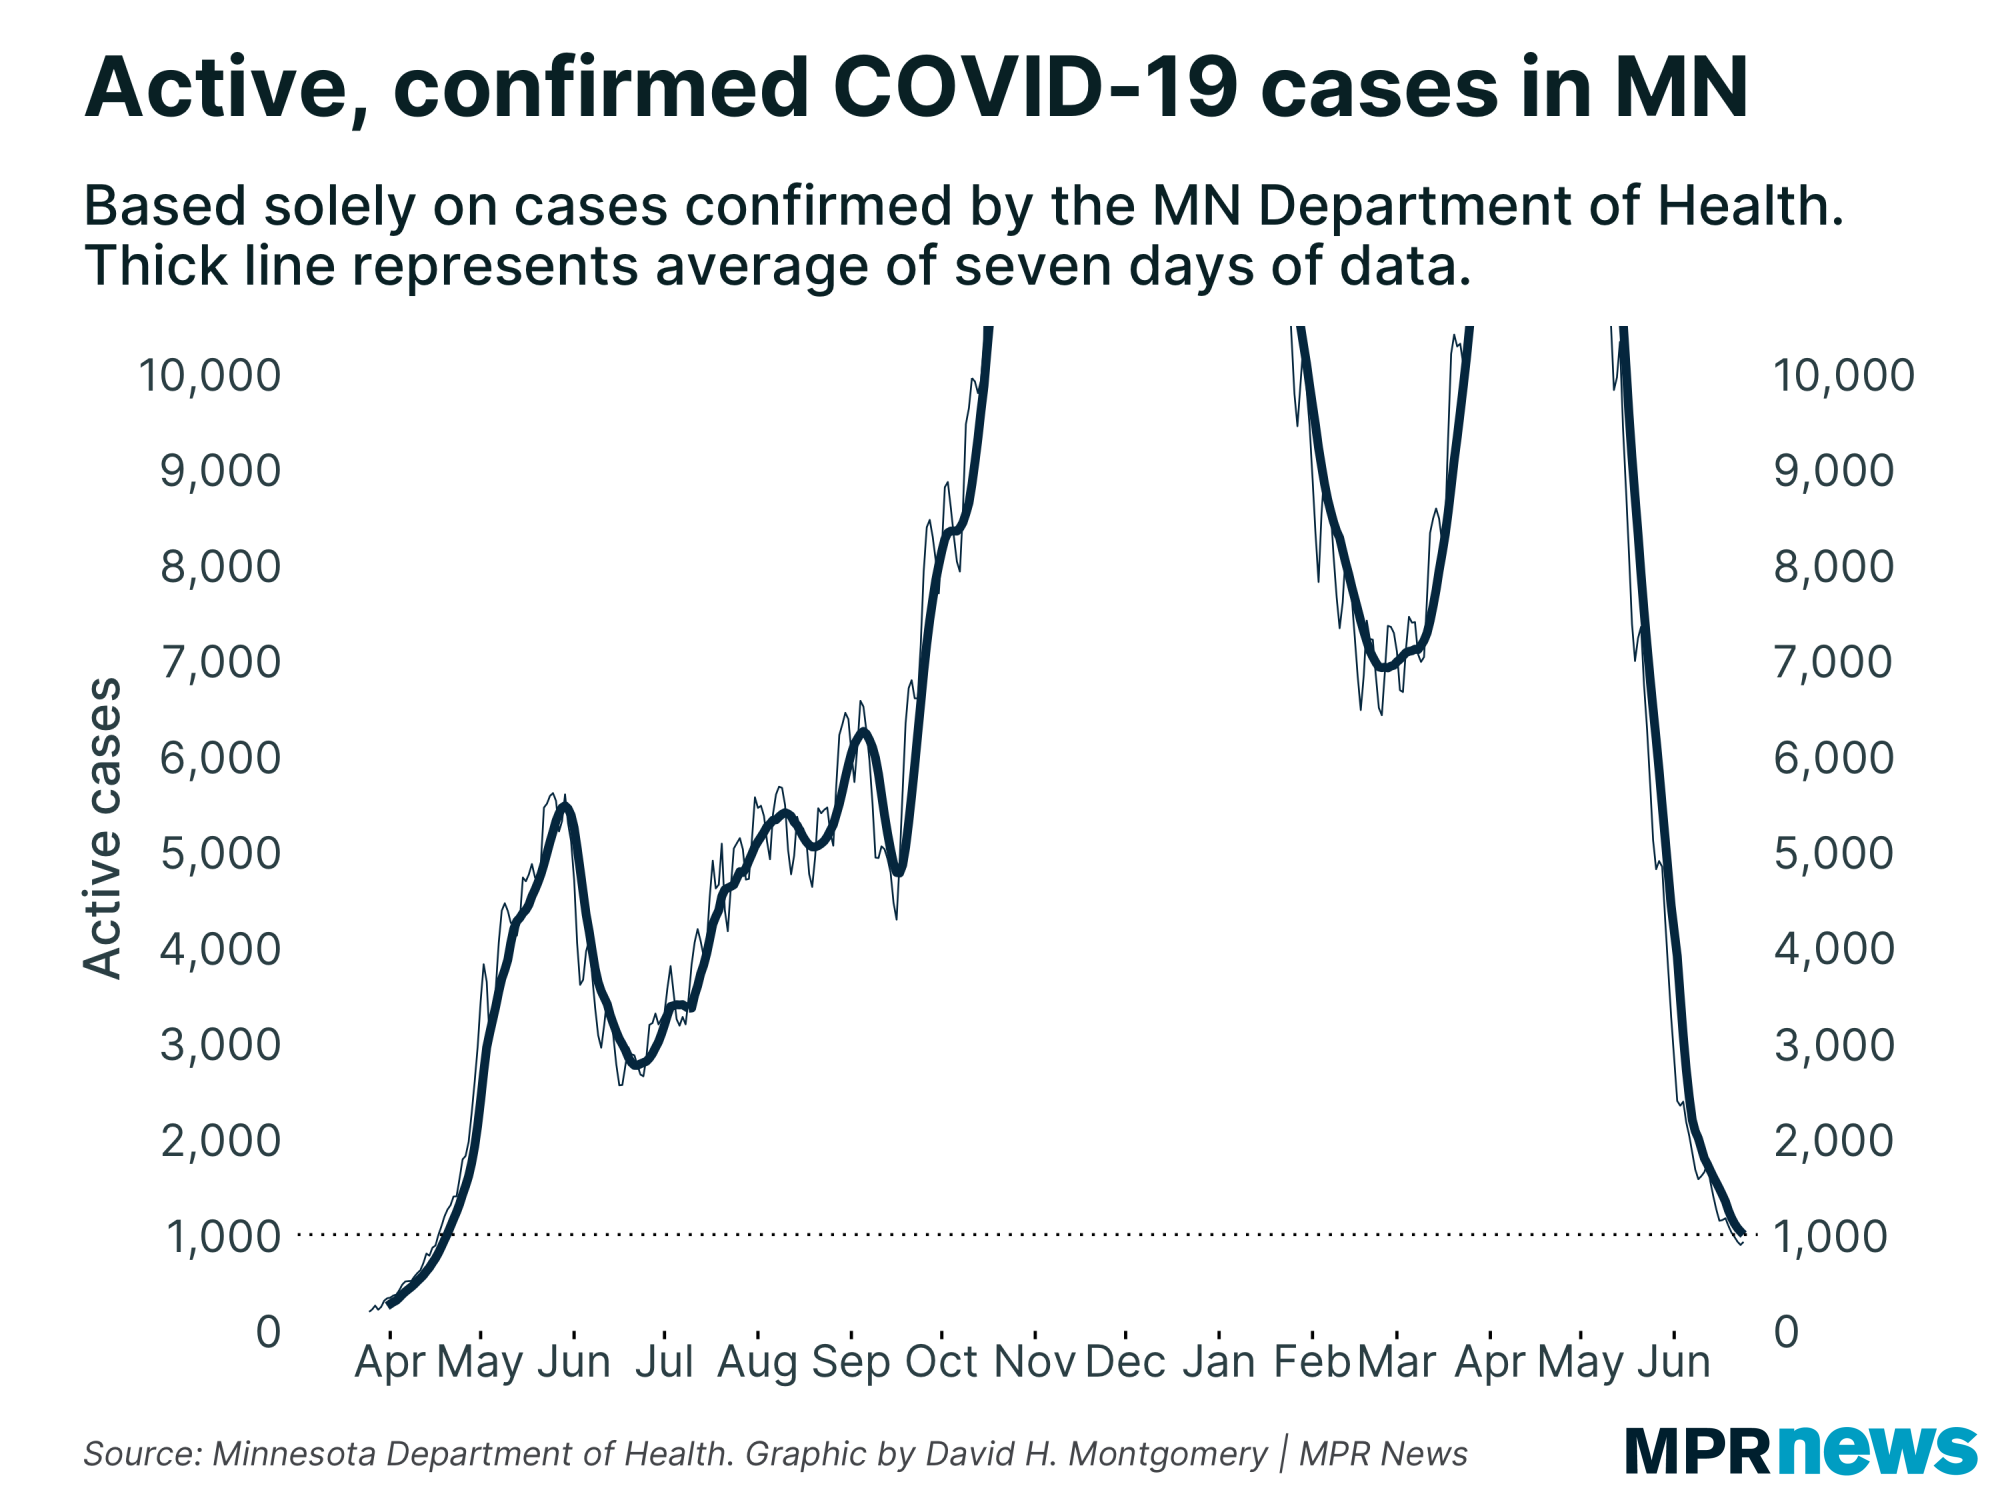
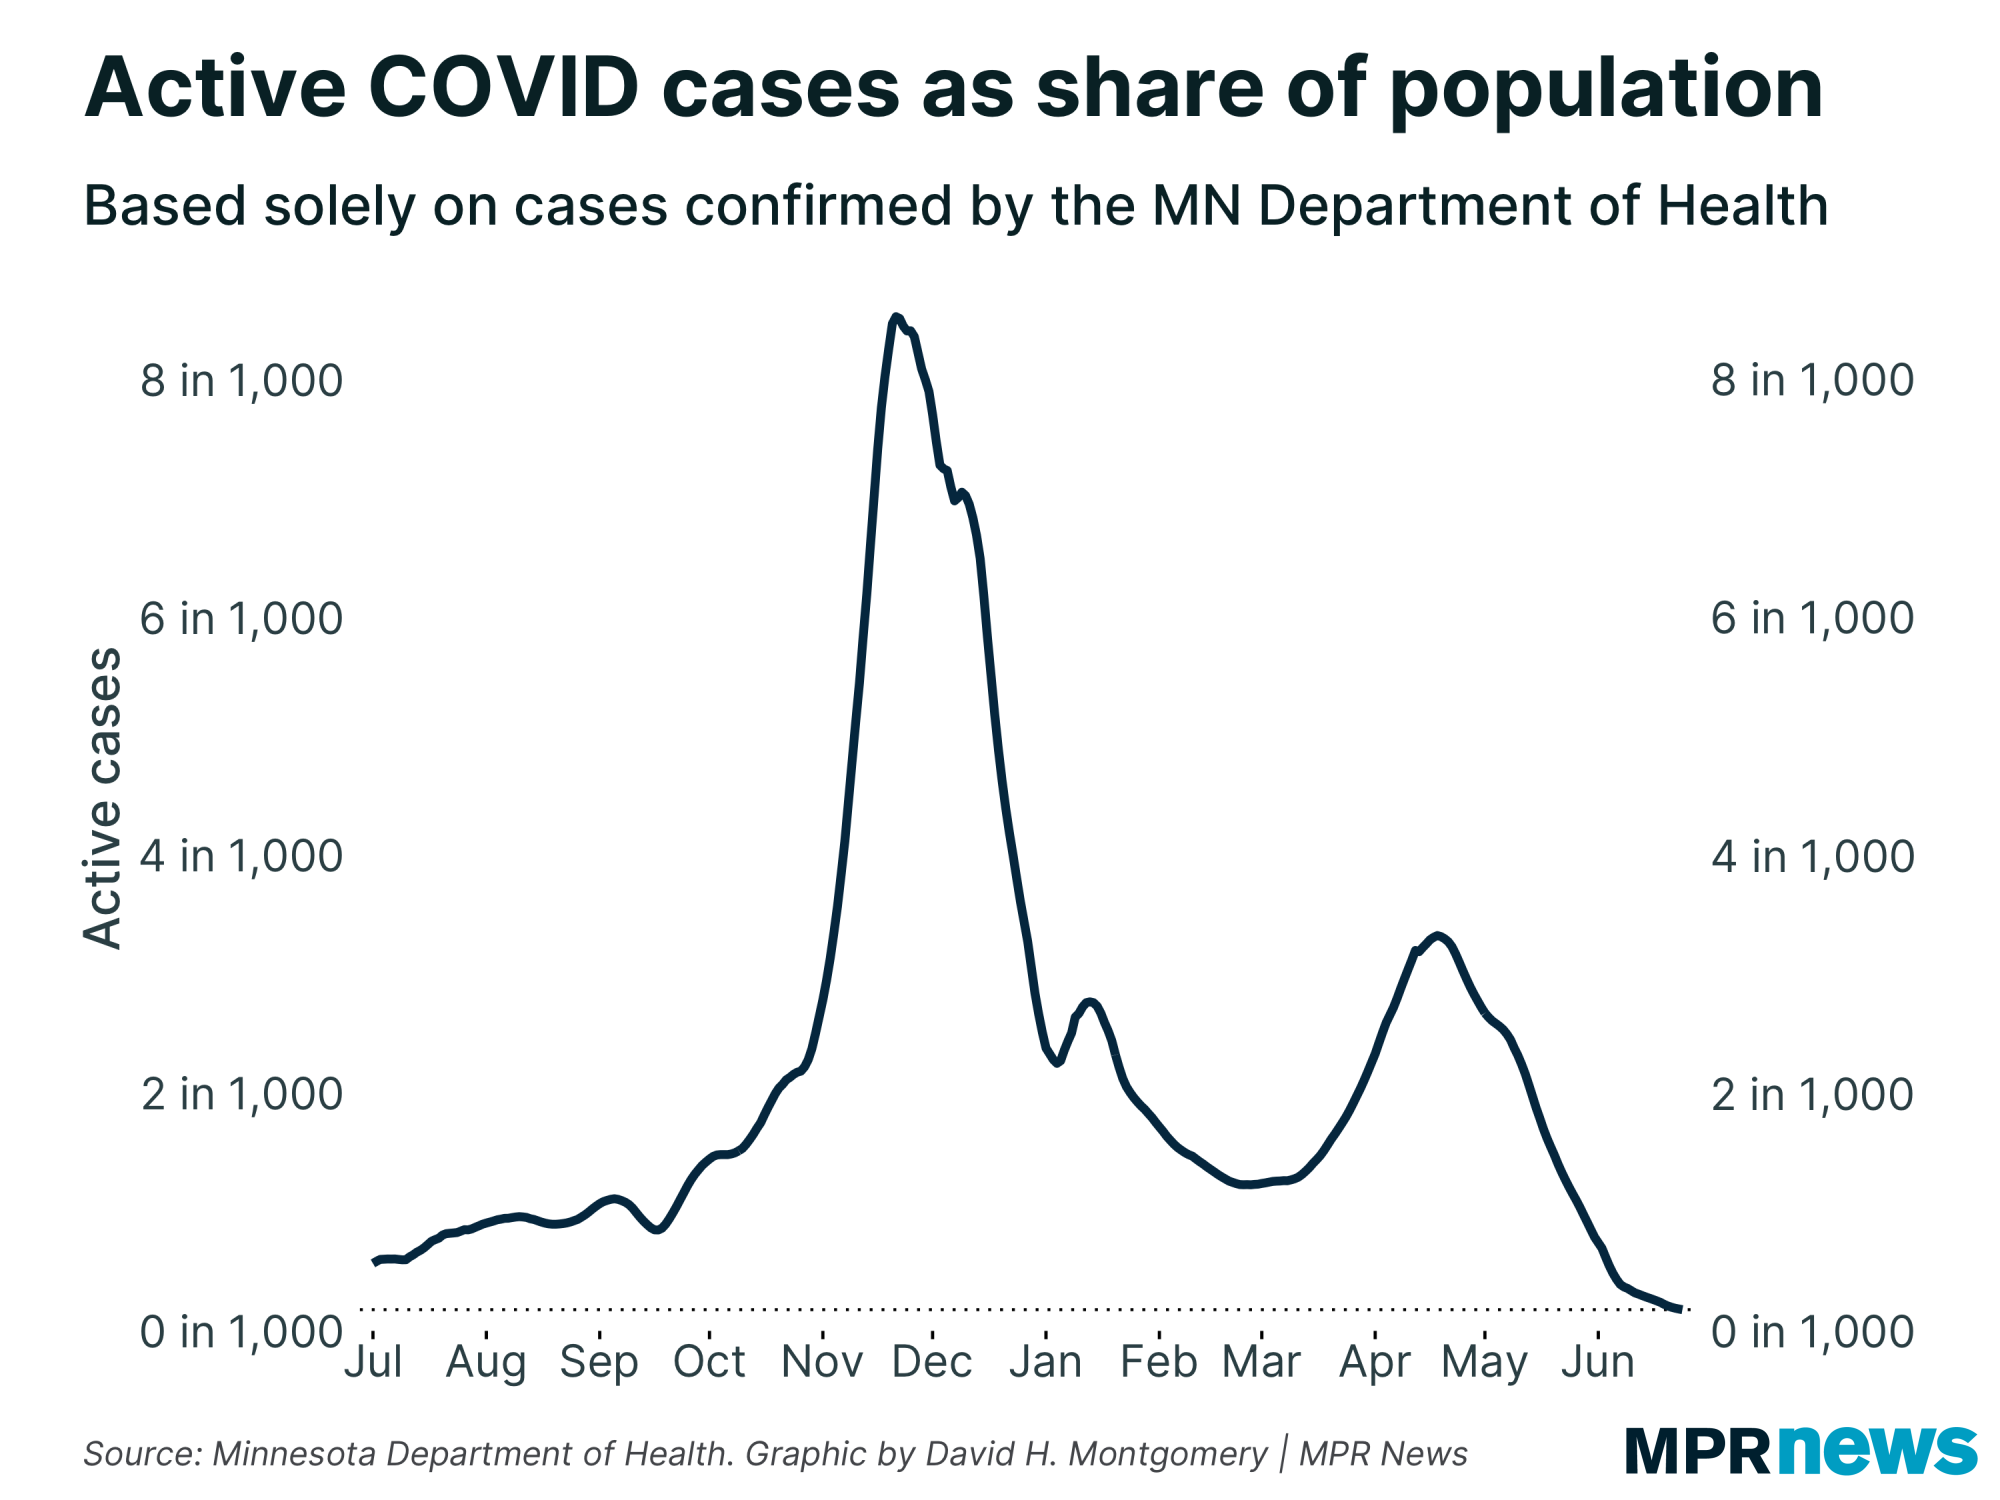
Let's start with one figure we do have: the number of active, confirmed COVID-19 cases in the state right now. Currently, that's just under 1,000. |
| |
|
|
| Those raw figures can be easily reconfigured into shares of the population, just by some simple division. | | |
|
|
Minnesota's current rate is minuscule: less than 0.2 active, confirmed cases per 1,000 people. (Or two per 10,000, if you'd prefer to deal in whole numbers.)
But there's a big caveat here: that "confirmed" label I keep adding. Not every COVID-19 infection is confirmed by a test. Indeed, experts estimate that a majority of COVID-19 infections are unconfirmed. The CDC's models put this figure as slightly less than one in four cases being confirmed.
So if you multiply these figures by a flat four, you get a peak disease prevalence at the November peak of around 32 active cases per 1,000. And if you multiply the current burden by that same value, you'd get around 0.8 cases per 1,000.
(As you can see, my hypothetical examples of 30 in 1,000 as a high figure and one in 1,000 for a low figure were not pulled out of thin air!)
But by these very estimates, Minnesota is actually below the 1 percent threshold at which an 0.4 percent false positive rate would — by the over-simplified Bayesian math — mean an 80 percent chance that a positive test was false.
Except, of course, that we don't actually care that much about how prevalent COVID-19 is among the entire population of Minnesota right now. |
| |
|
|
Rates in the susceptible population
|
So far I've estimated the rate of COVID-19 infections as a share of Minnesota's entire population. But that's not really how this math works.
When calculating the false positive rates for mammograms, for example, we don’t care what share of Americans have breast cancer – we care about things like breast cancer’s prevalence in “women aged 40 to 50.” That’s not to say other demographic groups, like men or younger women, can’t get breast cancer. It’s just that barring unusual circumstances, they’re not usually at risk. So we calculate based on the at-risk population, the population that we’re considering giving the test to in large numbers.
And right now, well over half of Minnesotans are at extremely low risk of getting COVID-19 due to immunity from vaccination or prior infection. Some of these people may still be getting regular COVID-19 tests as part of ongoing “test everyone” policies at workplaces. But it’s at least plausible that we shouldn’t really be considering the entire population of Minnesota as the baseline when calculating the prevalence of COVID-19 in a world where more than half of Minnesotans are vaccinated. |
| |
|
|
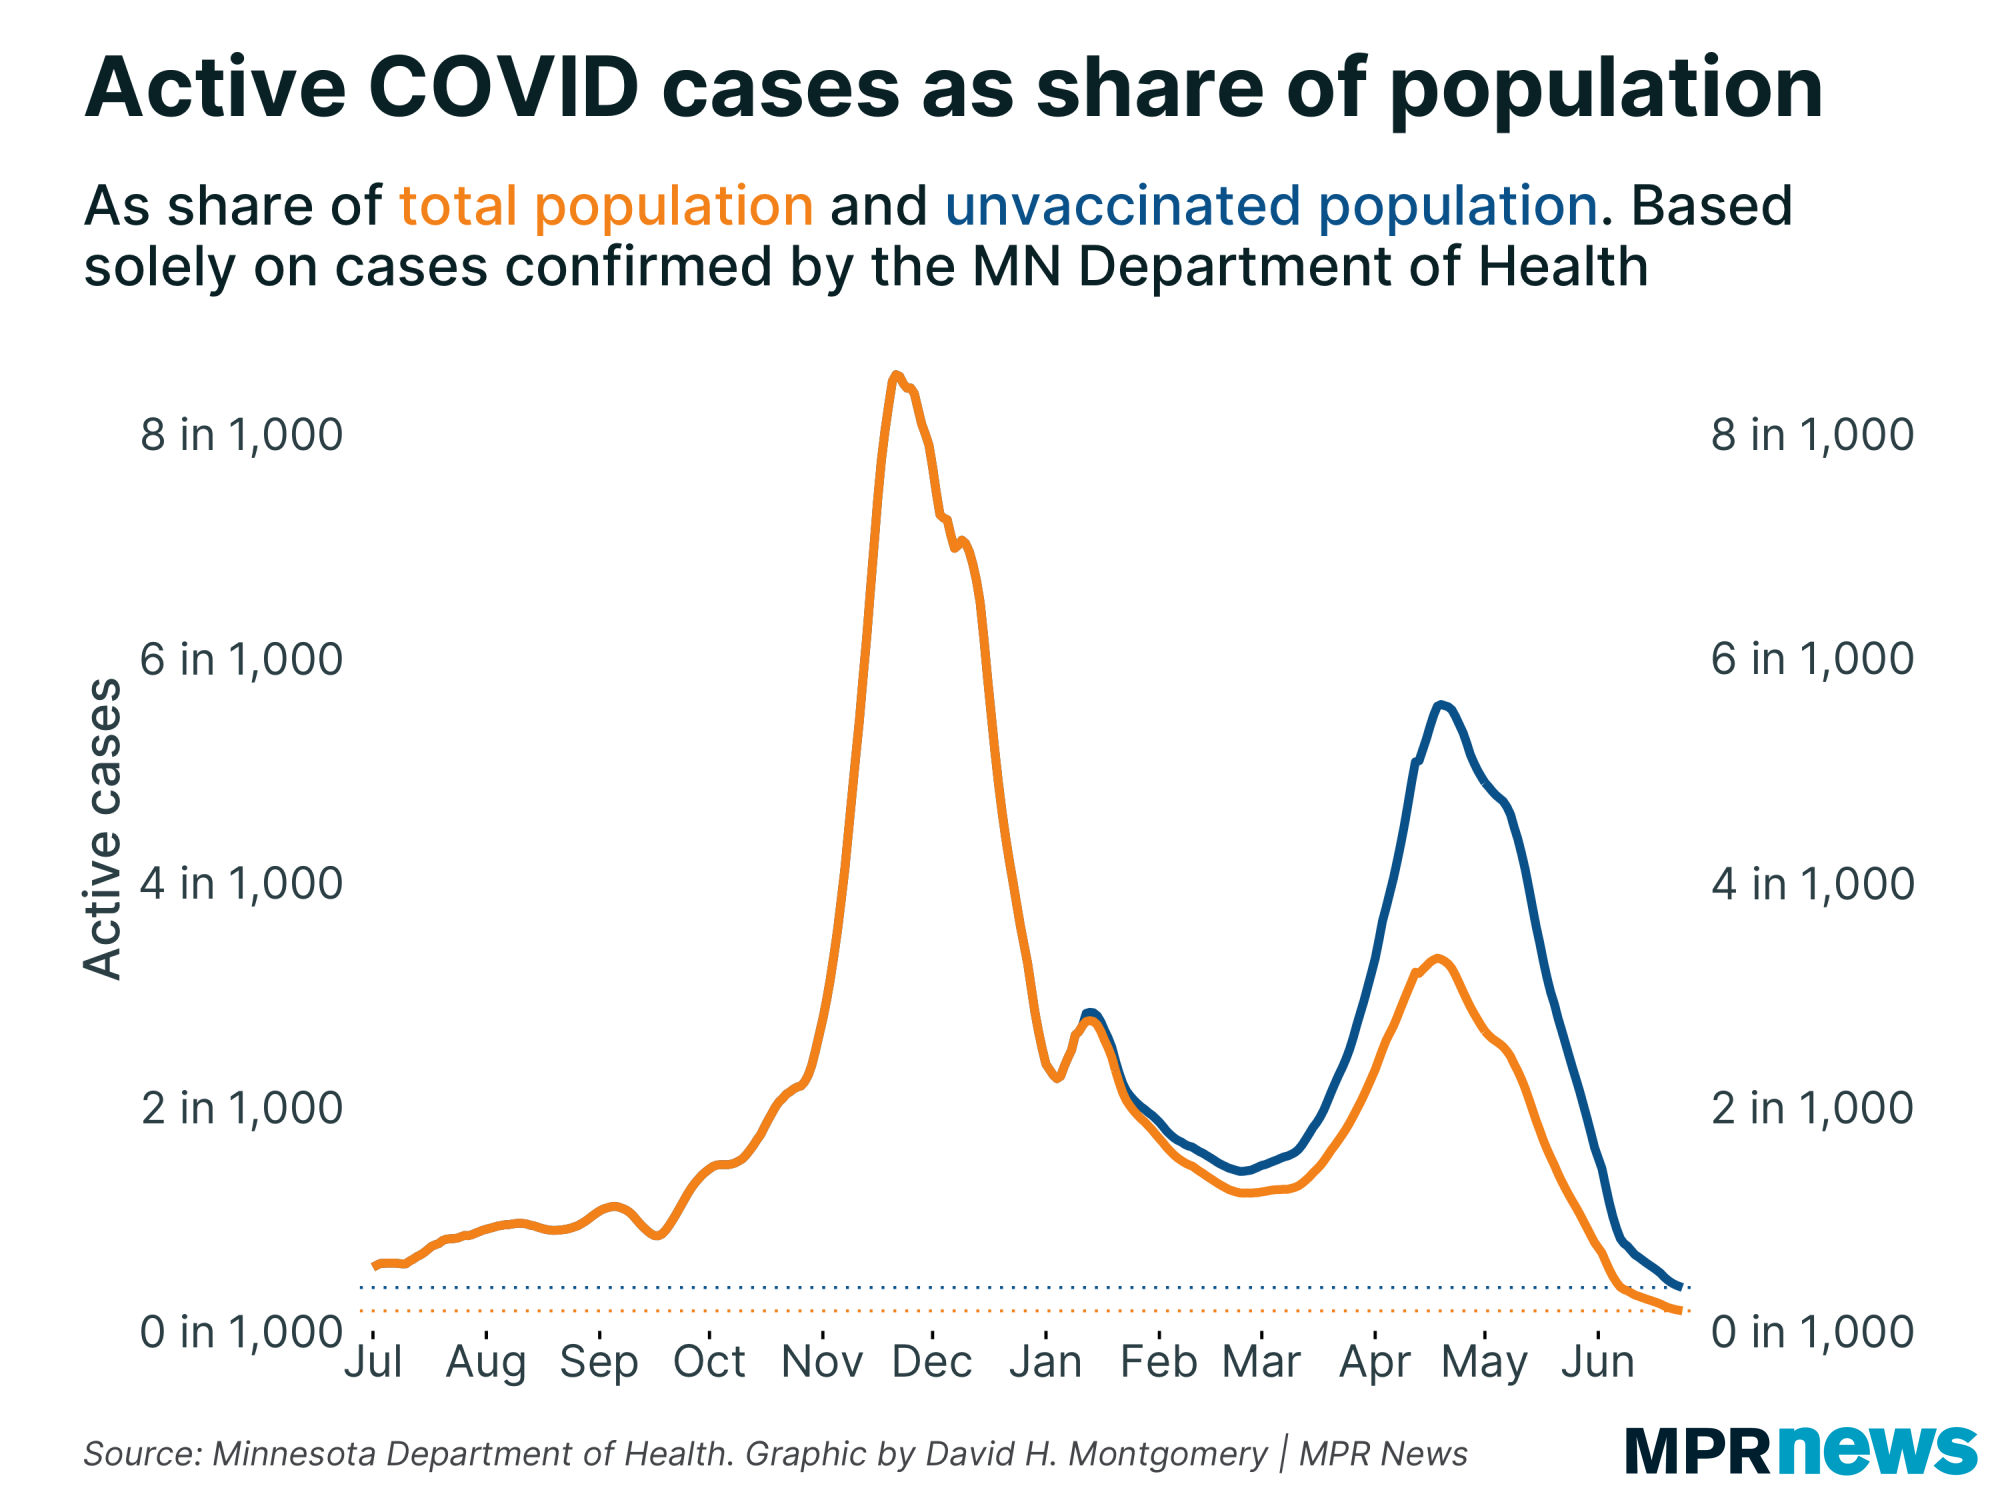
| With just over half of Minnesotans currently vaccinated, we’d need to roughly double all case rates to roughly account for the unvaccinated population. But that alone doesn’t get us to a scenario where COVID-19 is common among the unvaccinated — Minnesota right now is averaging about 0.2 active, confirmed COVID-19 cases per 1,000 people, and doubling that just gets you to 0.4 per 1,000 unvaccinated people. Multiply that by four and you're still below two in 1,000 — a far cry from the 30 in 1,000 level where false positives were a nonfactor. |
| |
|
|
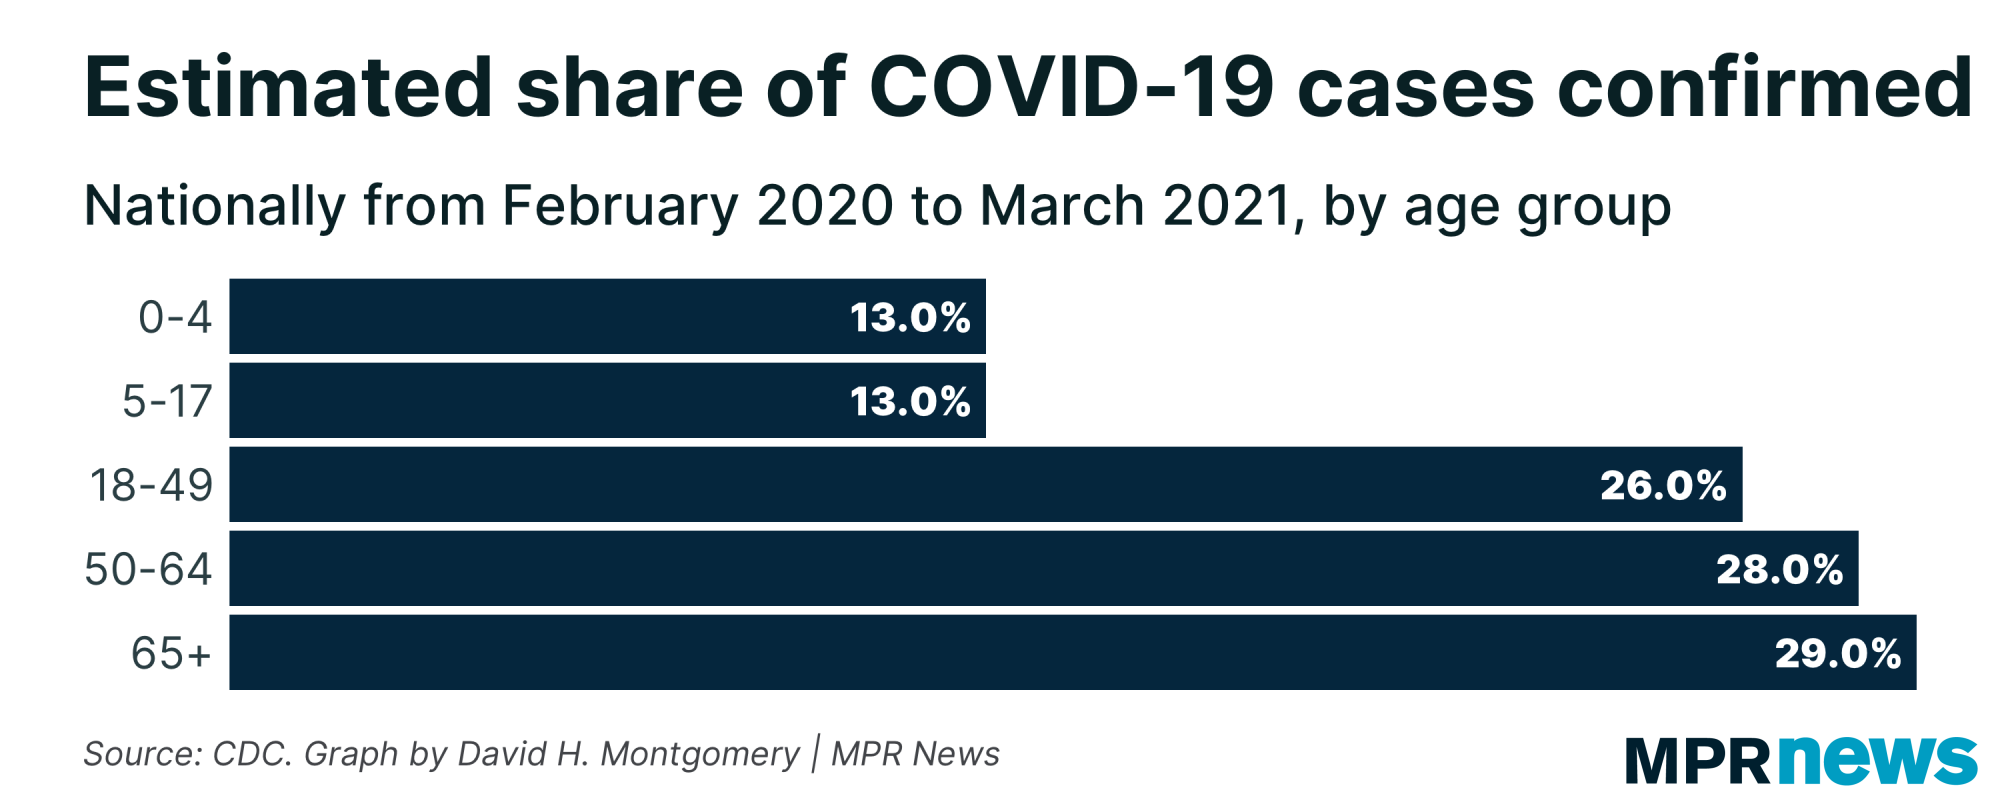
Earlier, I mentioned how the CDC estimated that only around one in four COVID-19 infections in the U.S. have actually been confirmed. But that's oversimplified. For one, the ratio varied over time — doubtless much higher in the first wave in March through May 2020, when testing was extremely limited, and somewhat lower later.
But willingness to get tested after being exposed or developing symptoms isn't the same in all populations. To give one simple example, over the course of the pandemic, the CDC estimates that one in four cases were confirmed — but for children, the estimate is closer to one in eight. |
| |
|
|
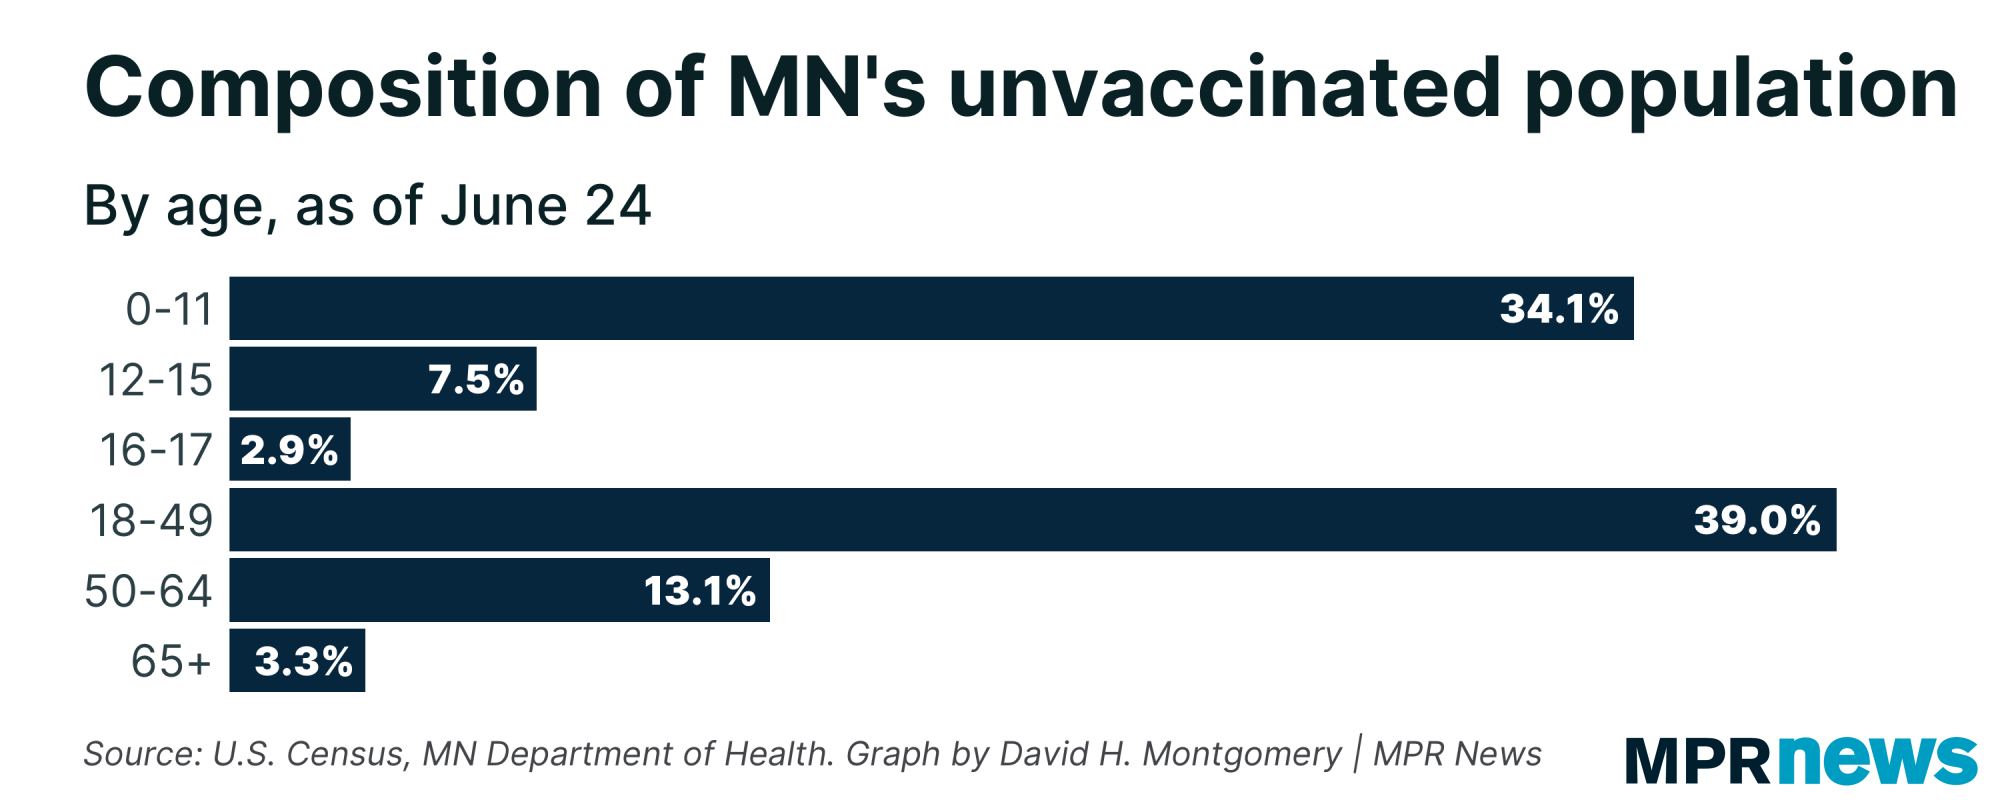
| With children under 12 ineligible to be vaccinated, and children 12 to 17 having become eligible relatively recently, children under 17 represent around 40 percent of unvaccinated Minnesotans (with around one-third of unvaccinated Minnesotans being ineligible children under 12). | |
|
|
|
I have certainly encountered anti-vax activists who also made arguments against testing — that more people getting tested will just find more cases and give government officials ammunition to impose mask mandates and other restrictions that they consider both offensive and useless. And people who are unvaccinated because they are concerned about cost or lack the transportation or time off to travel to a clinic, also seem like they might be less likely to go get tested.
So there's ample reason to hypothesize that the unvaccinated population — the population we care about here — is particularly unlikely to go get tested if they develop symptoms or are exposed to someone with COVID-19. How unlikely? Who knows. For the sake of argument, I'll pick an arbitrary number — let's say we're currently confirming not one in four infections among the current unvaccinated population, but one in 10.
So here's our back-of-the-envelope math:
- Take the current confirmed active case rate of 0.2 in 1,000 Minnesotans
- Double it to get to 0.4 in 1,000 unvaccinated Minnesotans
- Multiply it by 10 to estimate the number of unconfirmed infections, too — we're now at four infections per 1,000 unvaccinated Minnesotans
- Finally, let's remember the estimate above that maybe half of unvaccinated Minnesotans have a prior infection. If we take that at face value, we double our estimate again to around eight infections per 1,000 non-immune Minnesotans
So with that new figure, let's go back to Bayes. With a 0.4 percent false positive rate and a disease prevalence of eight in 1,000, then somewhere between one-third and one-half of antigen positives would be false (depending on the test's false-negative rate, which in turn depends on whether someone is symptomatic or not).
So what to make of all this? Remember that we're not seeing antigen tests' positivity being higher than PCR tests right now (if anything, it's the opposite in recent days). But with differences in how the different tests are administered, we can't say for certain that false positives are affecting our data in a significant way. My back-of-the-envelope math suggests that the false positivity rate of antigen tests probably is affecting the results to a certain degree, given what we know about the prevalence of COVID-19 in Minnesota. But it doesn't appear to be a major factor.
And you might find this reassuring: I'm not the only one looking at this. The Minnesota Department of Health is also tracking these kind of metrics, and in an email, a spokesperson told me that they're prepared to change their recommendations if circumstances warrant.
The reason, to digress again, that mammograms are often the go-to example for false positives, is because it's a real, concrete example. The risk of false positives if you test a population where breast cancer is rare is so high that doctors have generally adopted a strategy of only giving mammograms to high-risk patients, to minimize the risk of false positives. With COVID-19 testing, we have (eventually) adopted a very different strategy, of testing as many people of possible. But if Minnesota gets to the point where false positives are a significant distorting factor, the state might change its recommendations about who gets tested or start recommending using a PCR test to confirm any antigen positives.
This has been a giant rabbit hole, and I thank you for following me down it! |
| |
|
|
Below, I'll explore a few more stats about Minnesota's COVID-19 outbreak. If you want to learn more, I also recommend these other articles:
| | |
|
|
| Right here is where I'd ordinarily share a couple of bonus sections, but I've already written so much (and am so far past my deadline!) that I'm just going to skip it this time. | | |
|
|
What's happening next?
|
I'll be back next week, before the Fourth of July weekend, to take a big picture look at where we are on the verge of what's probably going to be — prematurely or not — a big national celebration of beating the virus.
Thanks for subscribing to this newsletter and for all of you who've sent me your feedback. As always, if you like this newsletter, please share it and the sign-up link with others who you think might enjoy it.
— David |
| |
|
|
Preference Center ❘ Unsubscribe You received this email because you subscribed or it was sent to you by a friend. This email was sent by: %%Member_Busname%%
%%Member_Addr%% %%Member_City%%, %%Member_State%%, %%Member_PostalCode%%
  |
|
|
| | |