| Welcome back to COVID in Minnesota TODAY, an email newsletter from MPR News about understanding the latest developments in Minnesota's COVID-19 outbreak. | | |
|
|
Look: I've burned myself before, so I'm going to be cautious here. But the numbers over the last few days have looked pretty encouraging that at long last, Minnesota's fourth wave might have peaked.
I'll want to see at least a few more days of good data before I feel confident about this. But we now have multiple metrics all heading down. This isn't a case of extrapolating a trend into the future — metrics are already going down; the question is whether this is a real trend, or just a temporary blip in the data. |
| |
|
|
Three things to know
| - After a scare the last two weeks, most metrics suggest Minnesota's long fourth wave may finally be peaking
- It's too early to say for sure — continued sustained declines are what we need to see
- Booster shots are far outpacing first doses now, but even boosters are at low levels compared to vaccination paces we saw earlier this year
|
| |
|
|
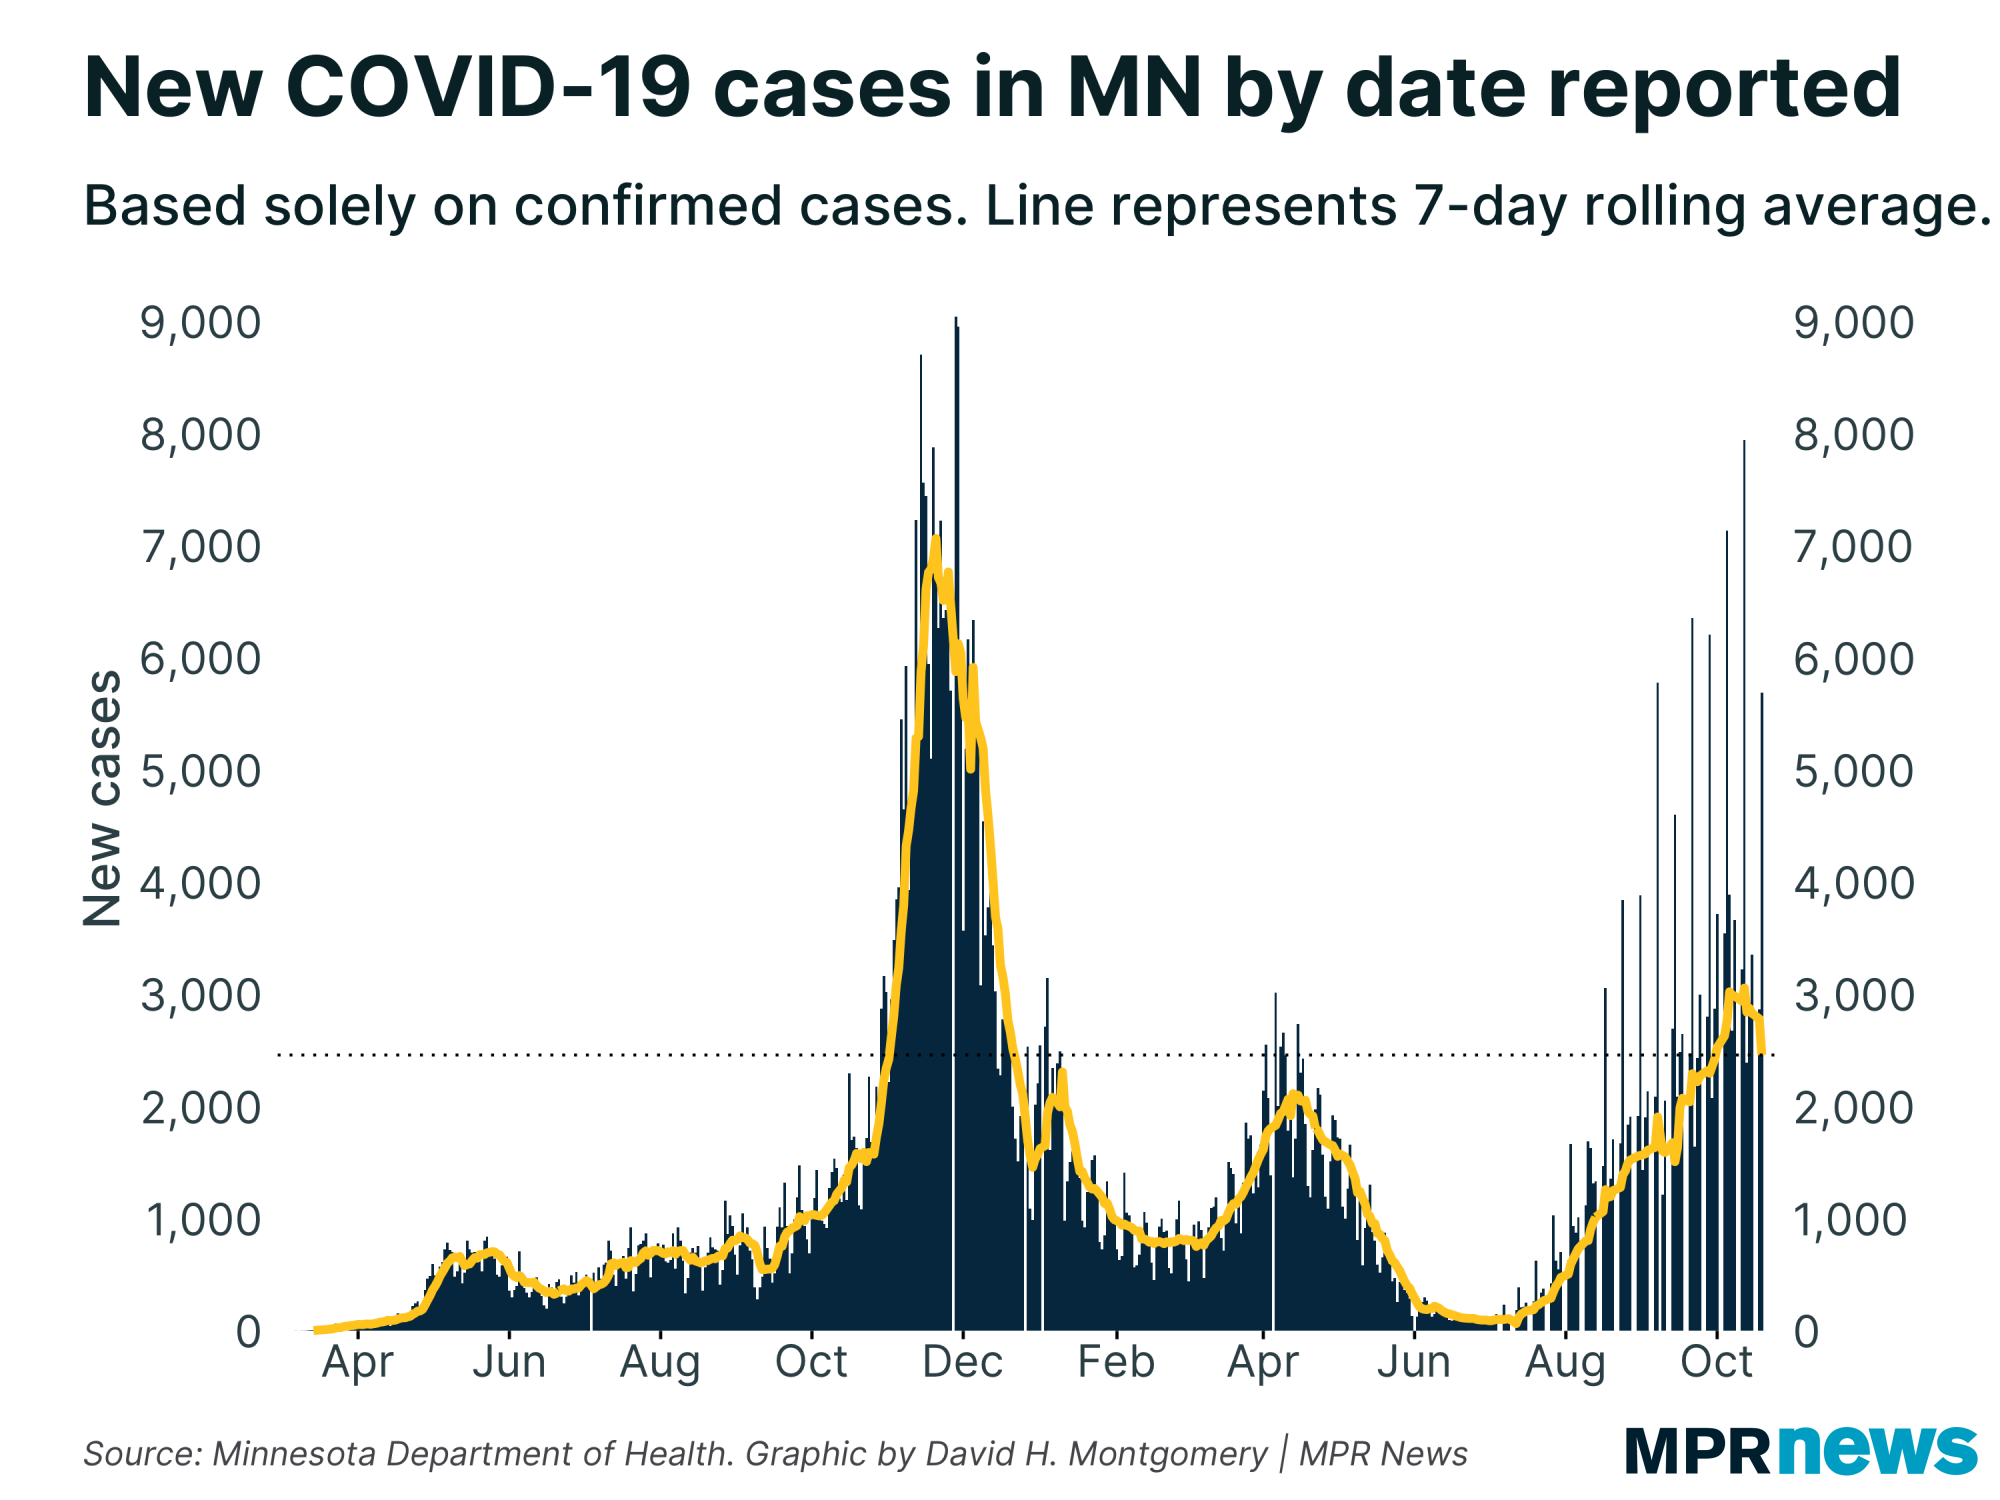
| The most encouraging data right now is case totals, which are down 20 percent from last Tuesday's average, including multiple consecutive days of decline. (Those are both things we want to see when judging if something is real — a single freak day of low cases can skew the data, but sustained decline is more indicative of a trend.) | |
|
|
|
Now, the single biggest drop in this was Tuesday's data, which is a sign to be cautious. Sometimes a big drop or spike in one day's report just means a big batch of cases didn't get processed in time, getting artificially boosted to the next day. It's possible that's what's happening here, and tomorrow's report will see a big uptick. But if cases continue falling, that will suggest what we're seeing is real.
Another cause for caution with case data is that testing volume has been falling, too. There's a complex chicken-and-egg relationship between testing volume and case counts, but sometimes declines in case counts can actually be artifacts of less testing going on.
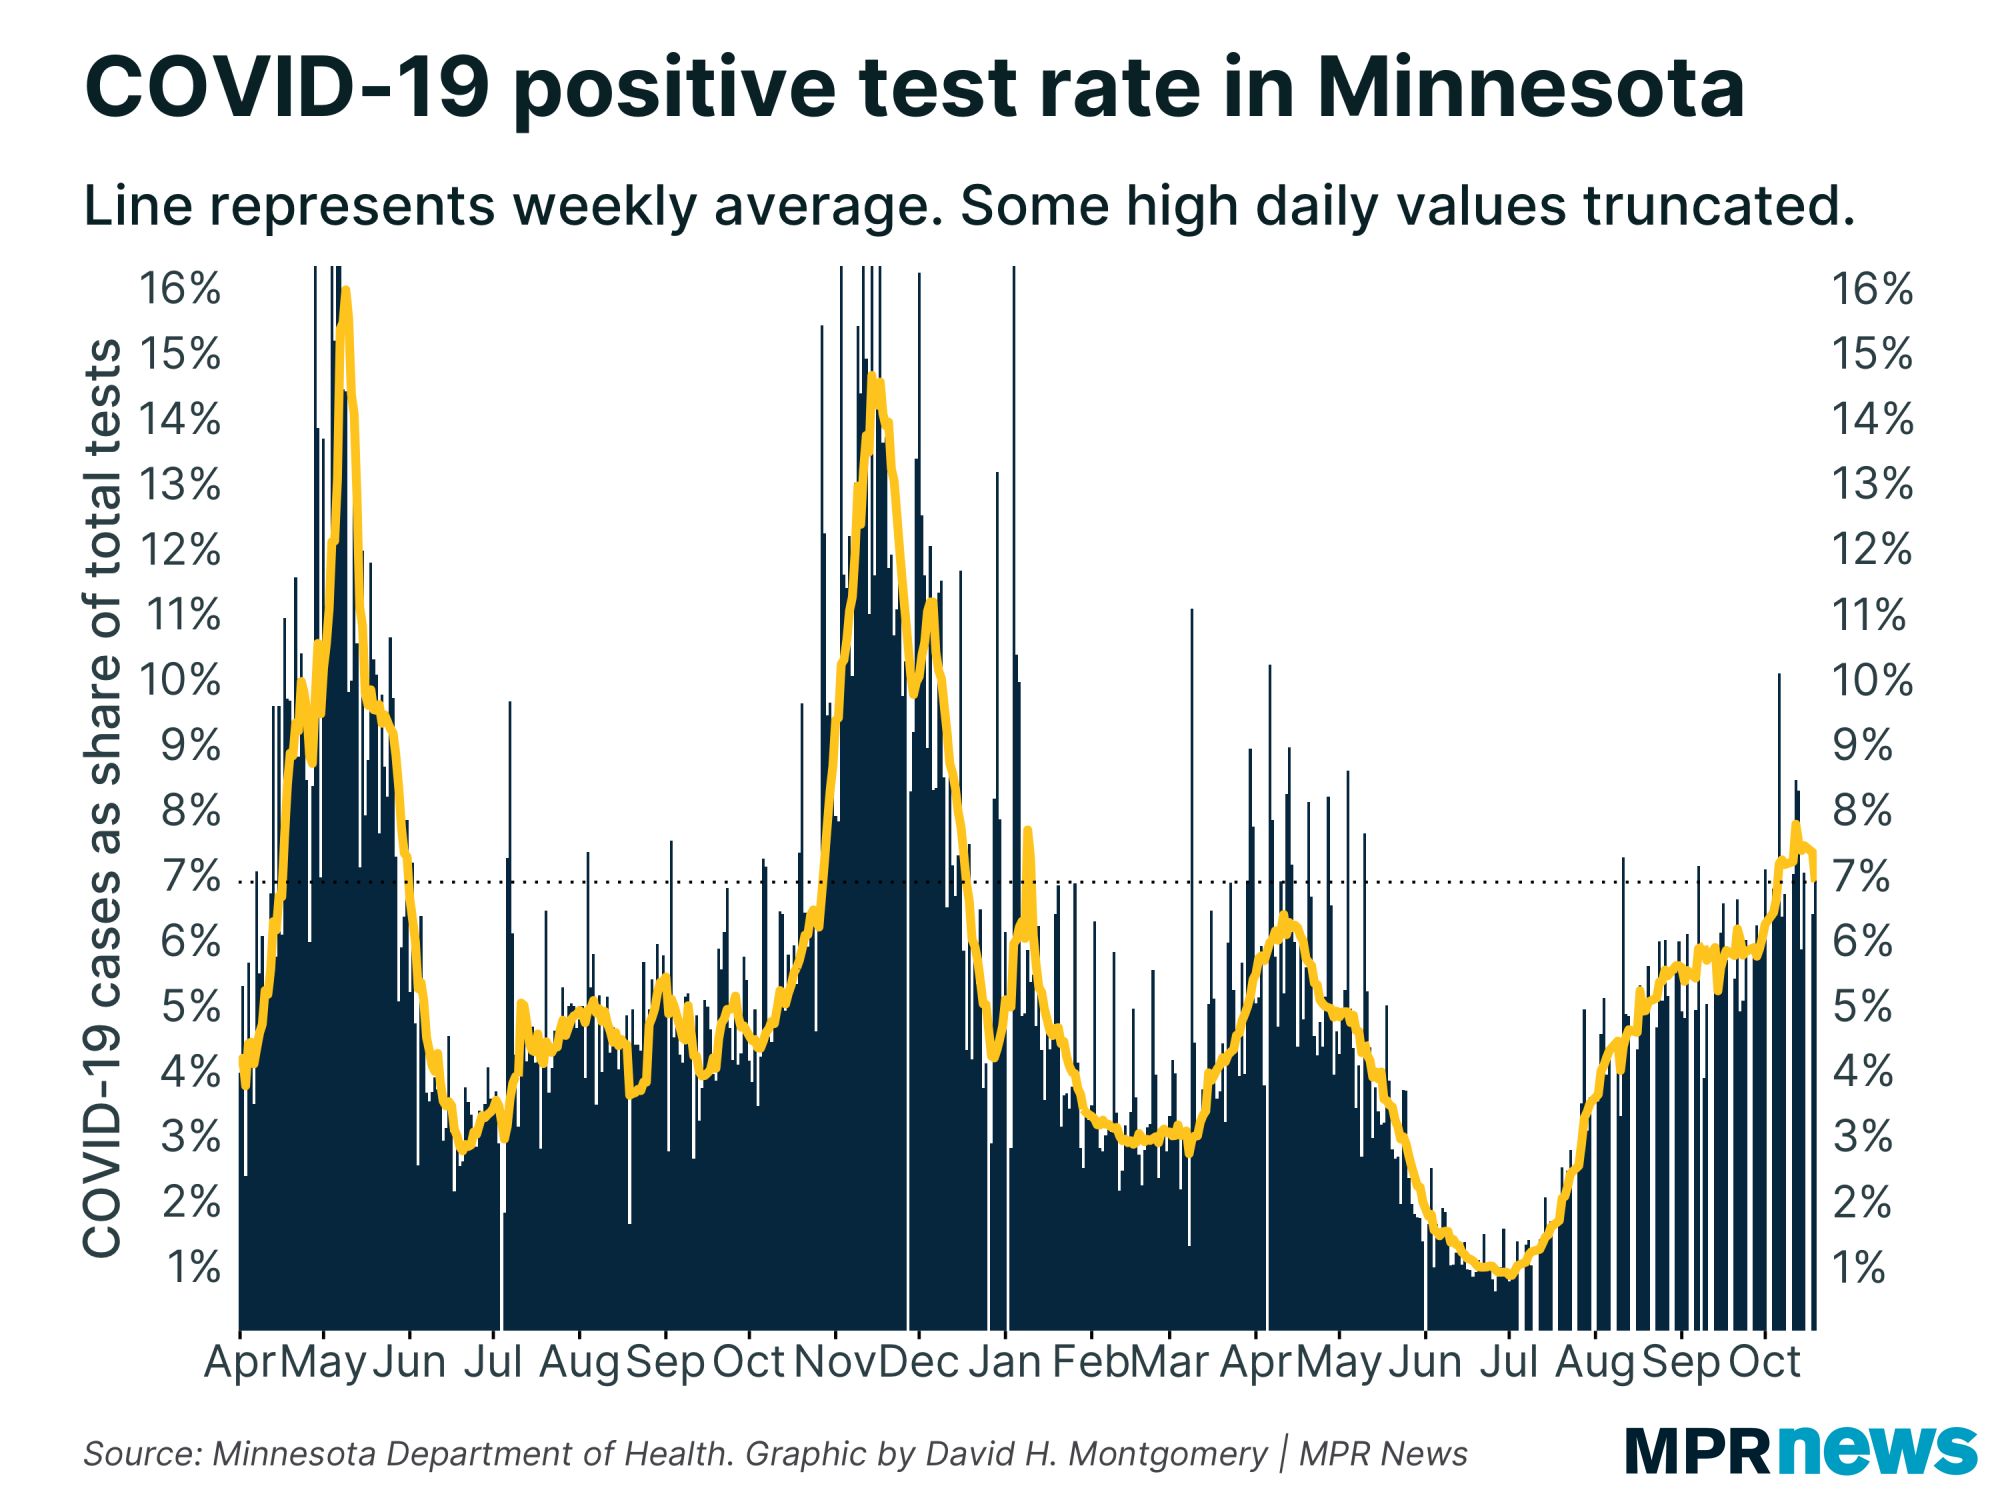
That's why it's such good news that positivity rate — which controls for testing volume — has been declining, too. |
| |
|
|
Positivity fell below the 7 percent threshold today for the first time since Oct. 5. It has declined less drastically than cases, but it's still heading in the right direction.
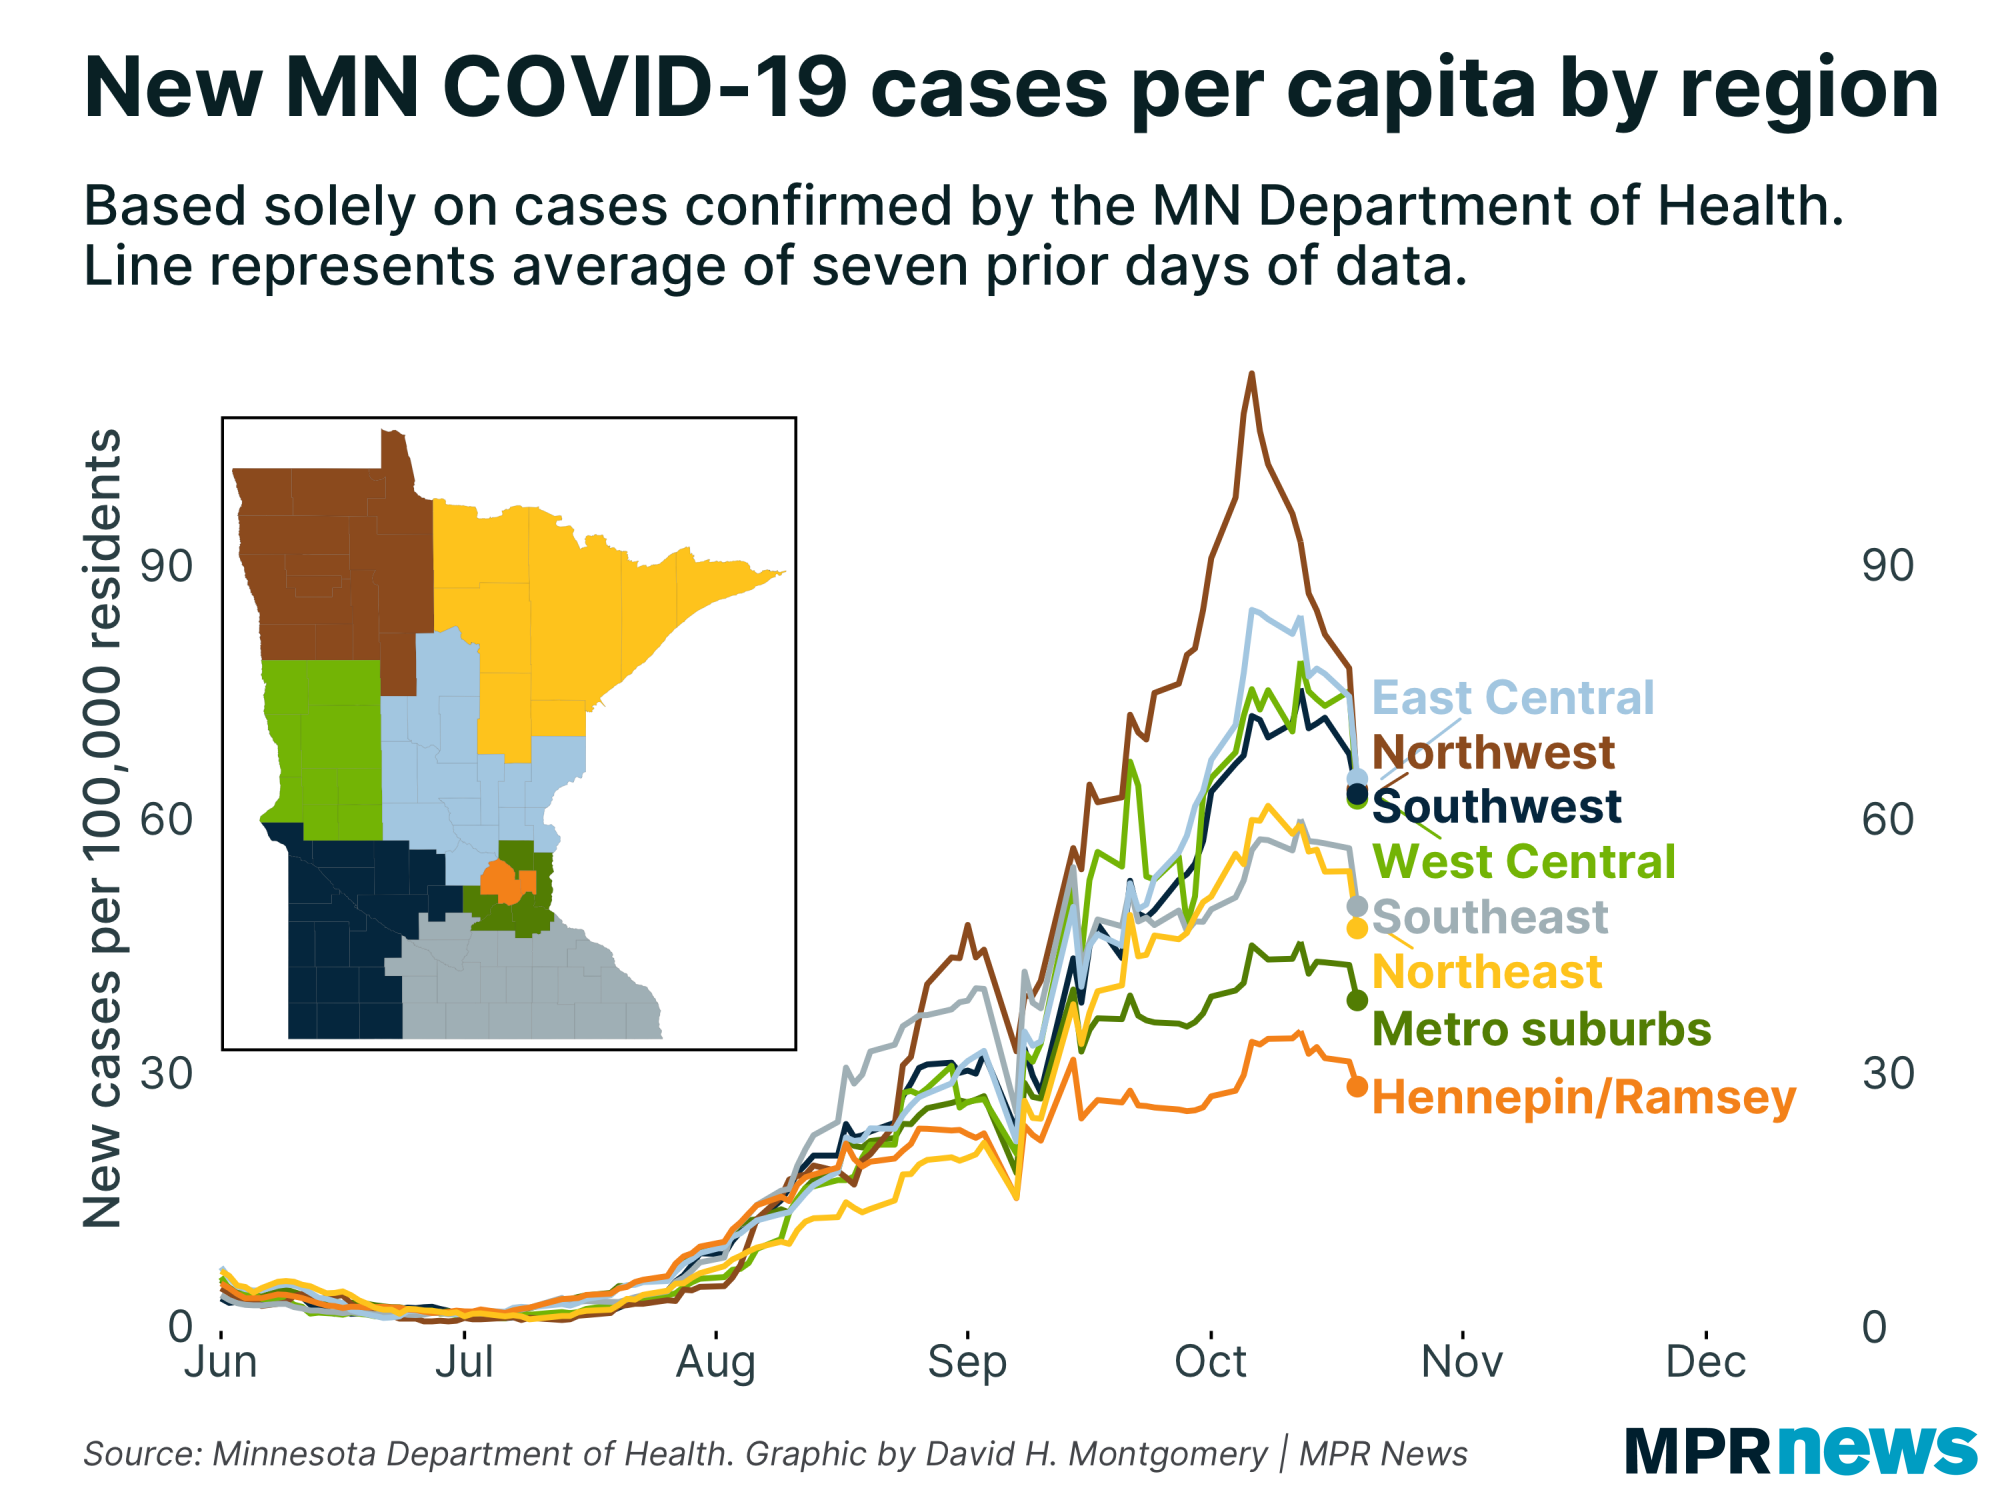
When we dive a little deeper, there are also consistent good signs. Cases are falling in every region of the state, and especially in hard-hit northwestern Minnesota. | |
|
|
|
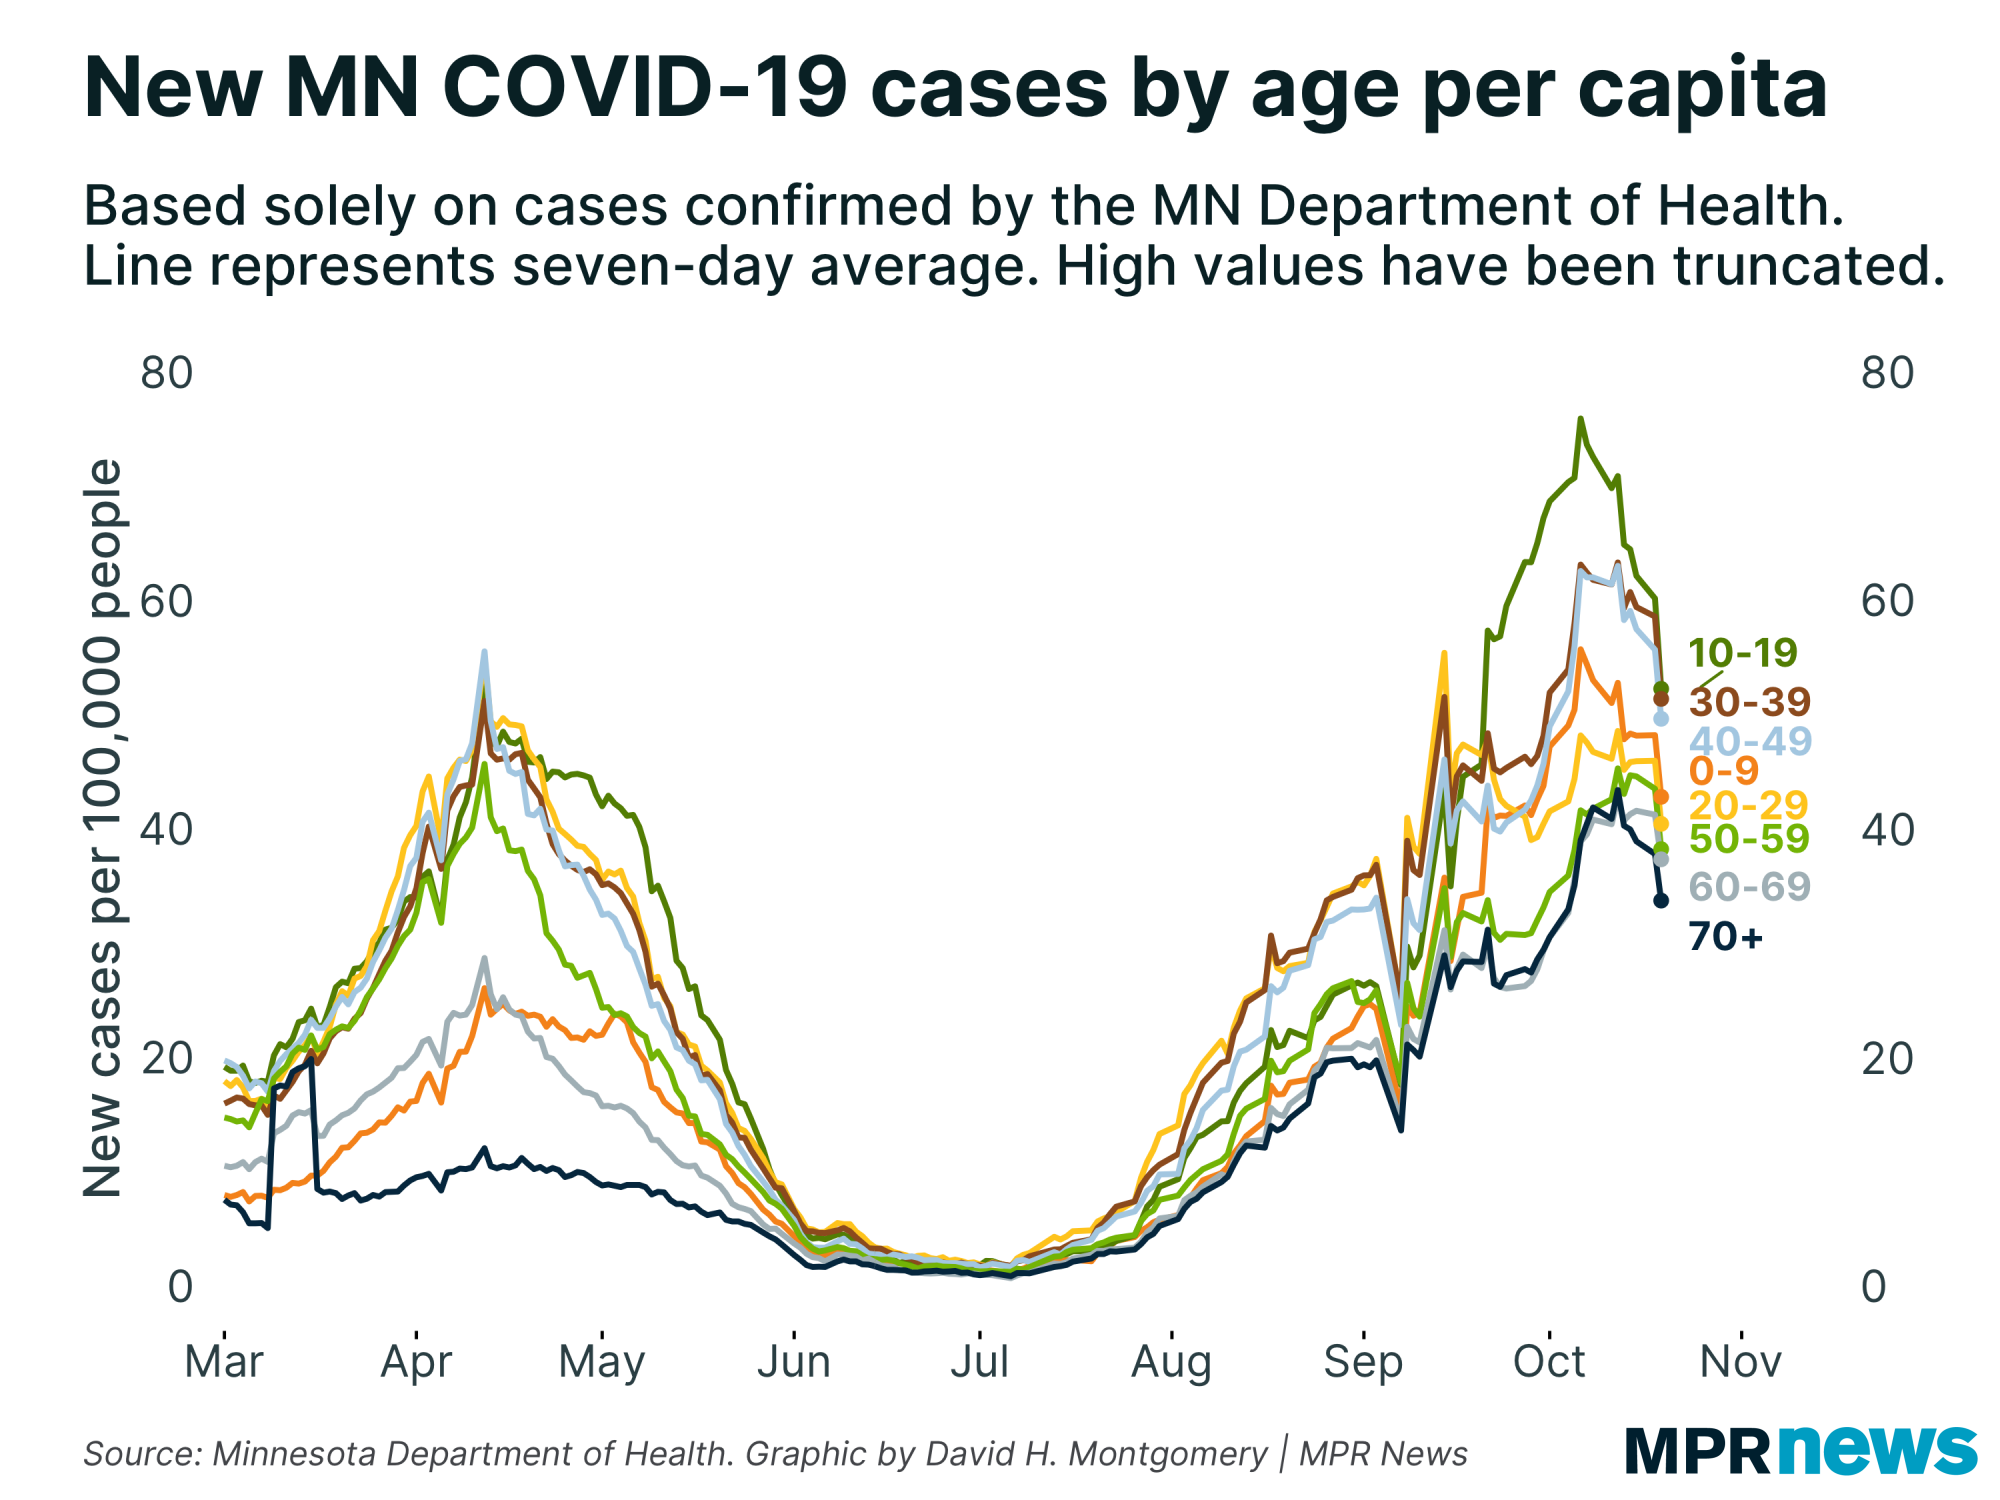
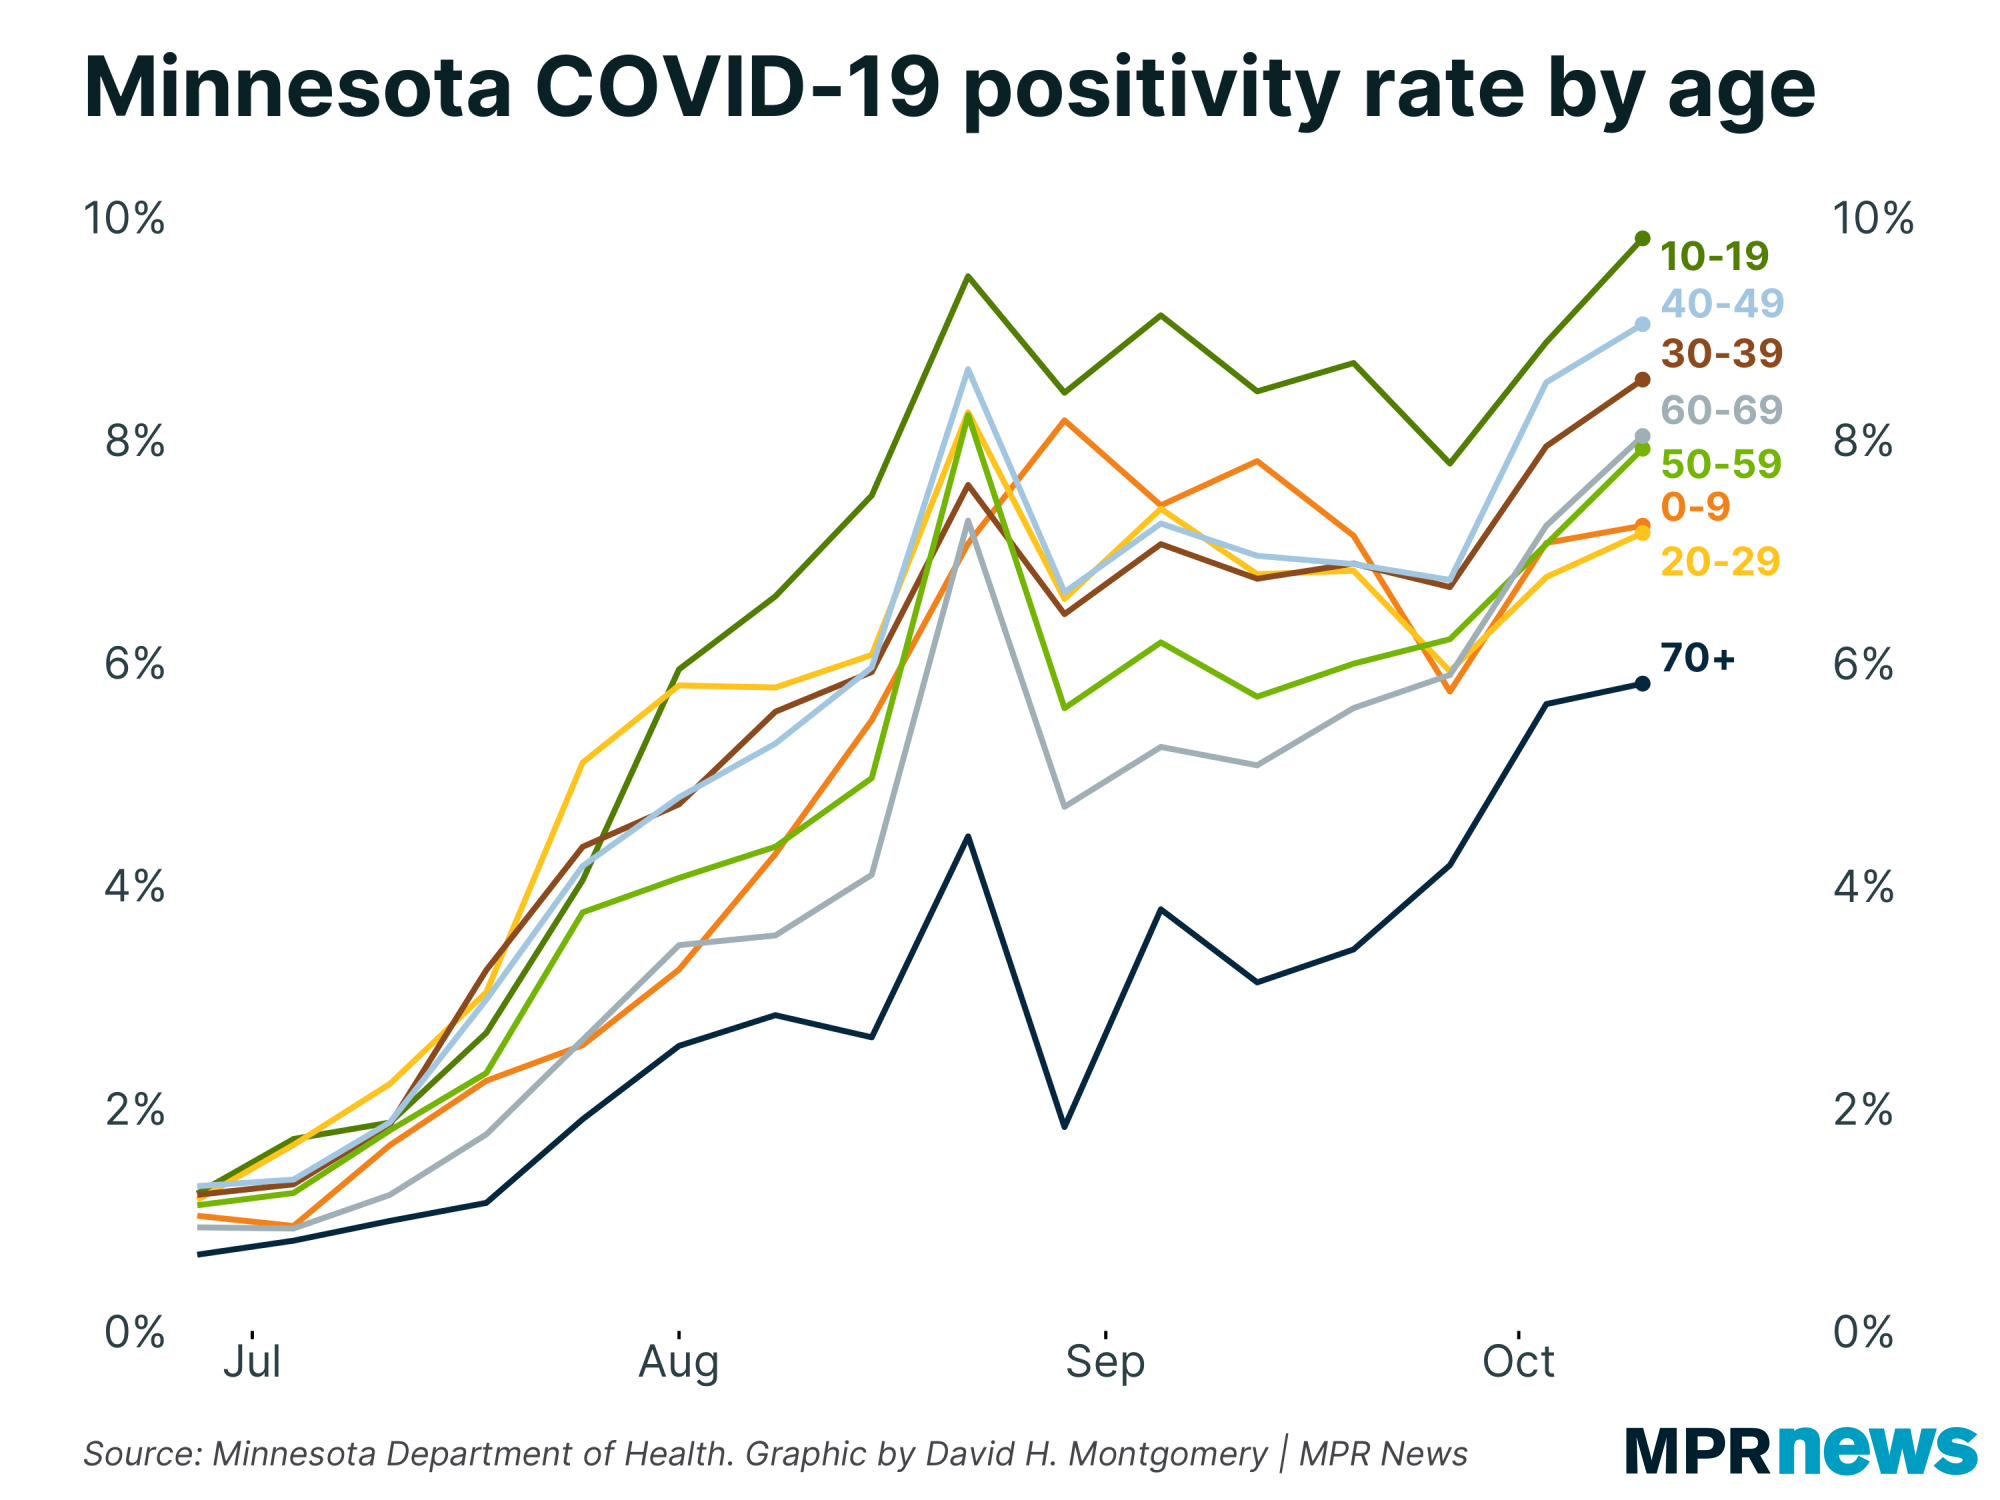
| And cases are also falling in every age group, including teenagers. | | |
|
|
| Now, some of this may be driven by testing, which has fallen particularly sharply in the 10-19 age bracket. Data last week showed positivity rate continuing to rise in this group. | | |
|
|
We'll see what the updated data we get this Thursday will say here. I wouldn't be surprised if we see these positivity rates tick down. But even if they don't, it may be more "reason to take case declines with a grain of salt" than proof that they're wrong.
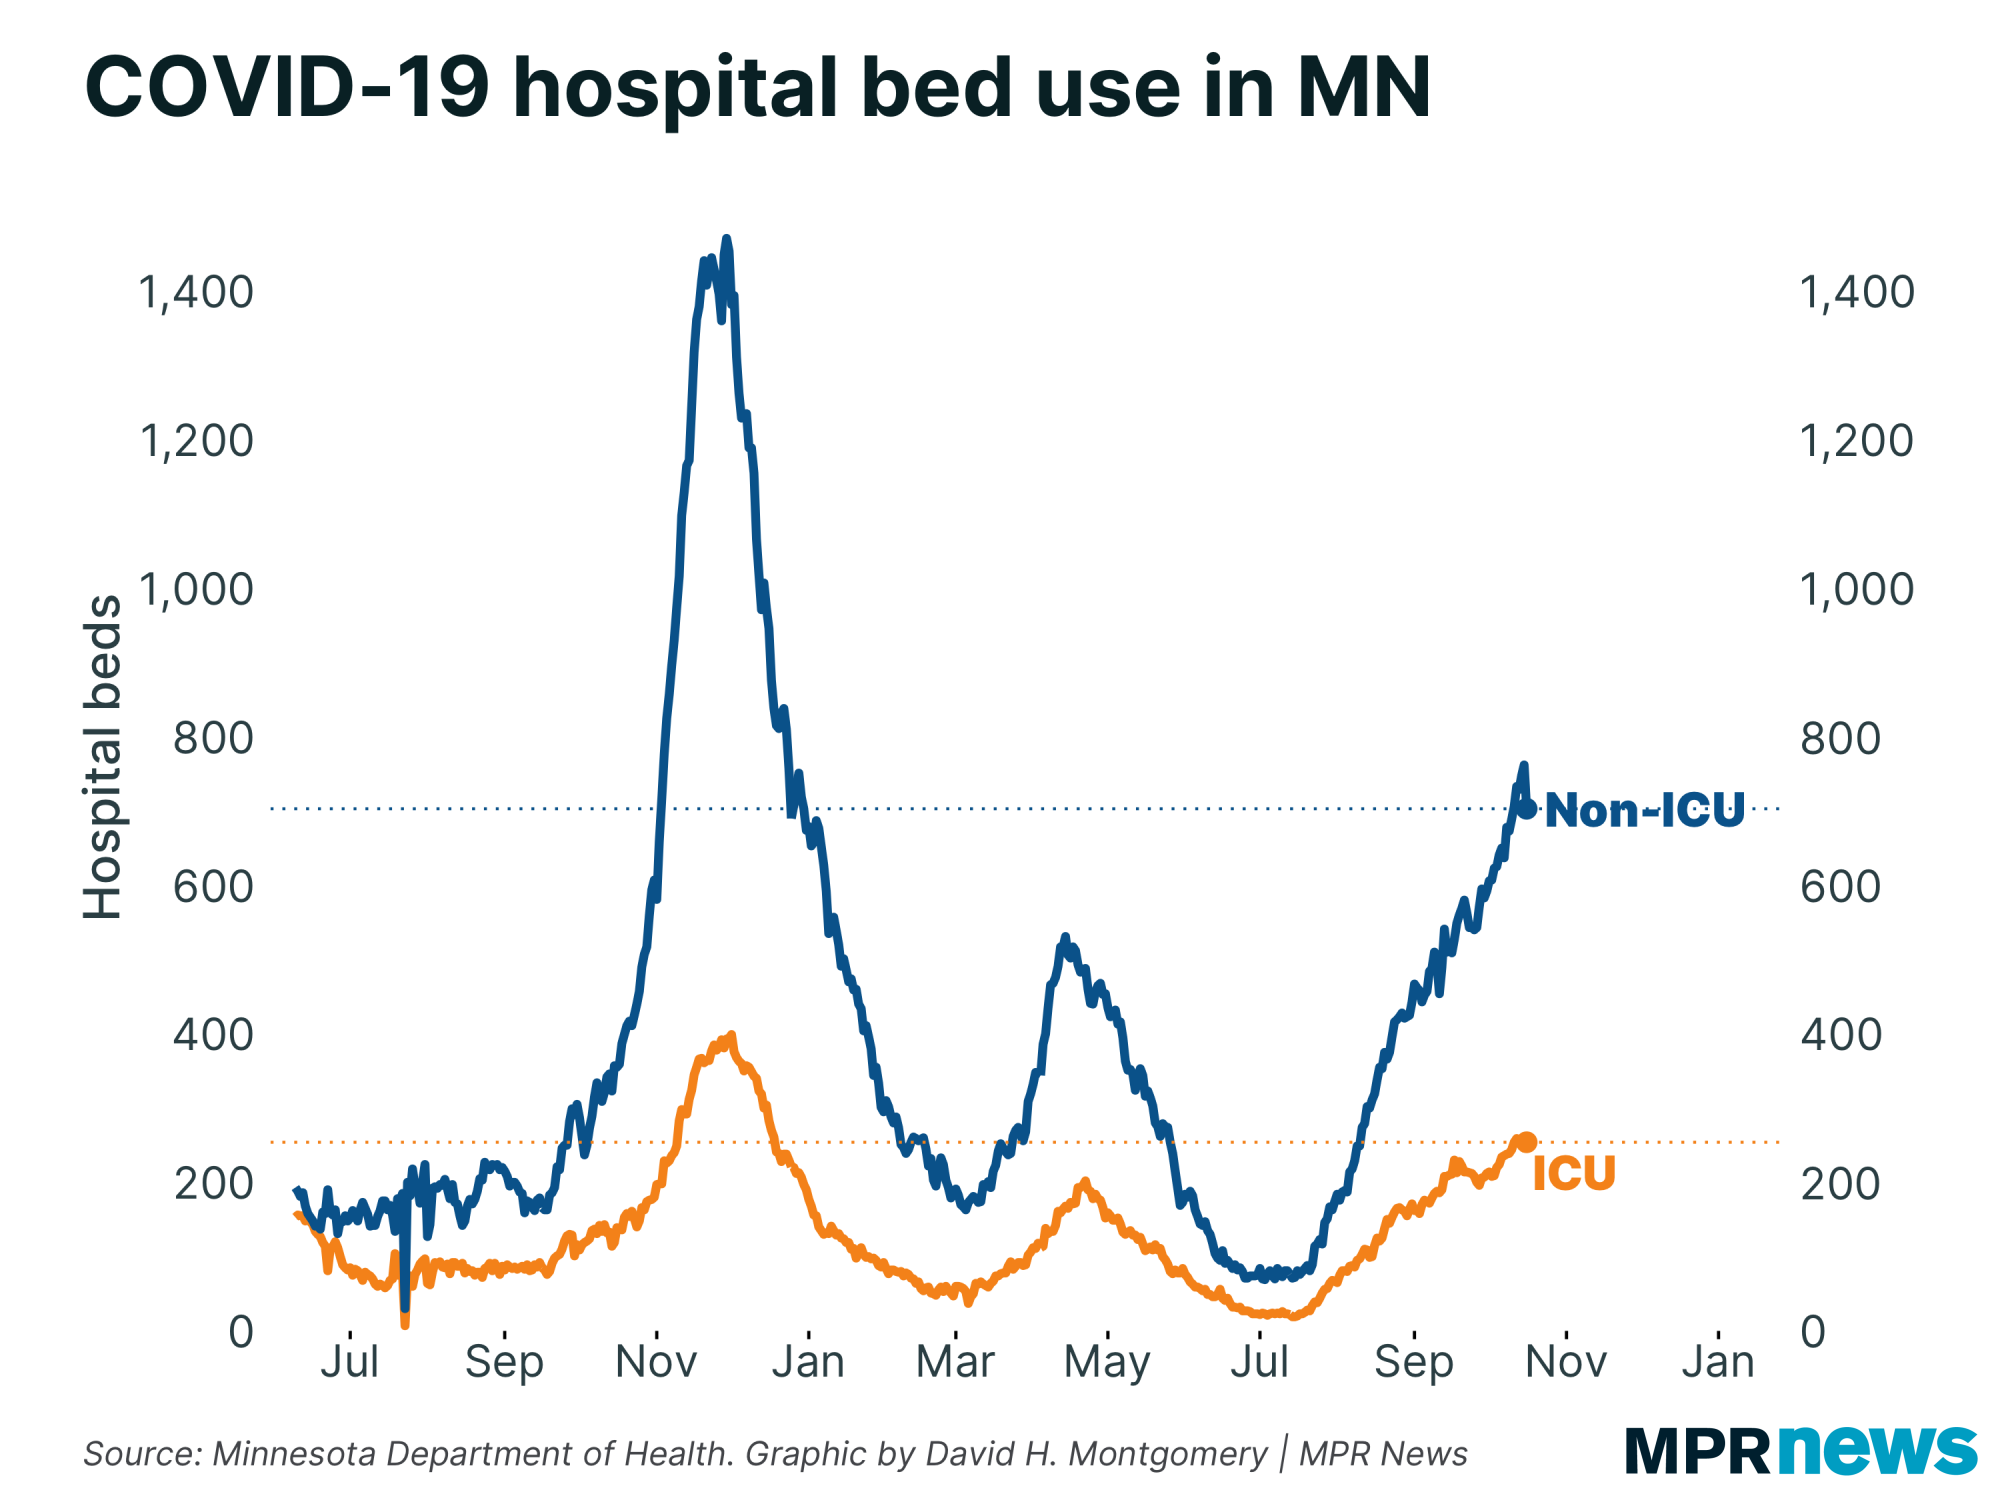
Today also saw a drop in reported COVID-19 hospital bed admissions, though this was abrupt and sudden and we should wait for more data before making any conclusions here. In any case, we should expect hospitalizations to lag behind case data by at least a few days. |
| |
|
|
| The big picture: after a nerve-wracking bump in Minnesota's COVID-19 outbreak the past two weeks, growth rates have petered off or reversed themselves. Case counts are actually down over the last two weeks, and positivity rate has almost reversed. Even hospitalizations are showing slower growth. | |
|
|
|
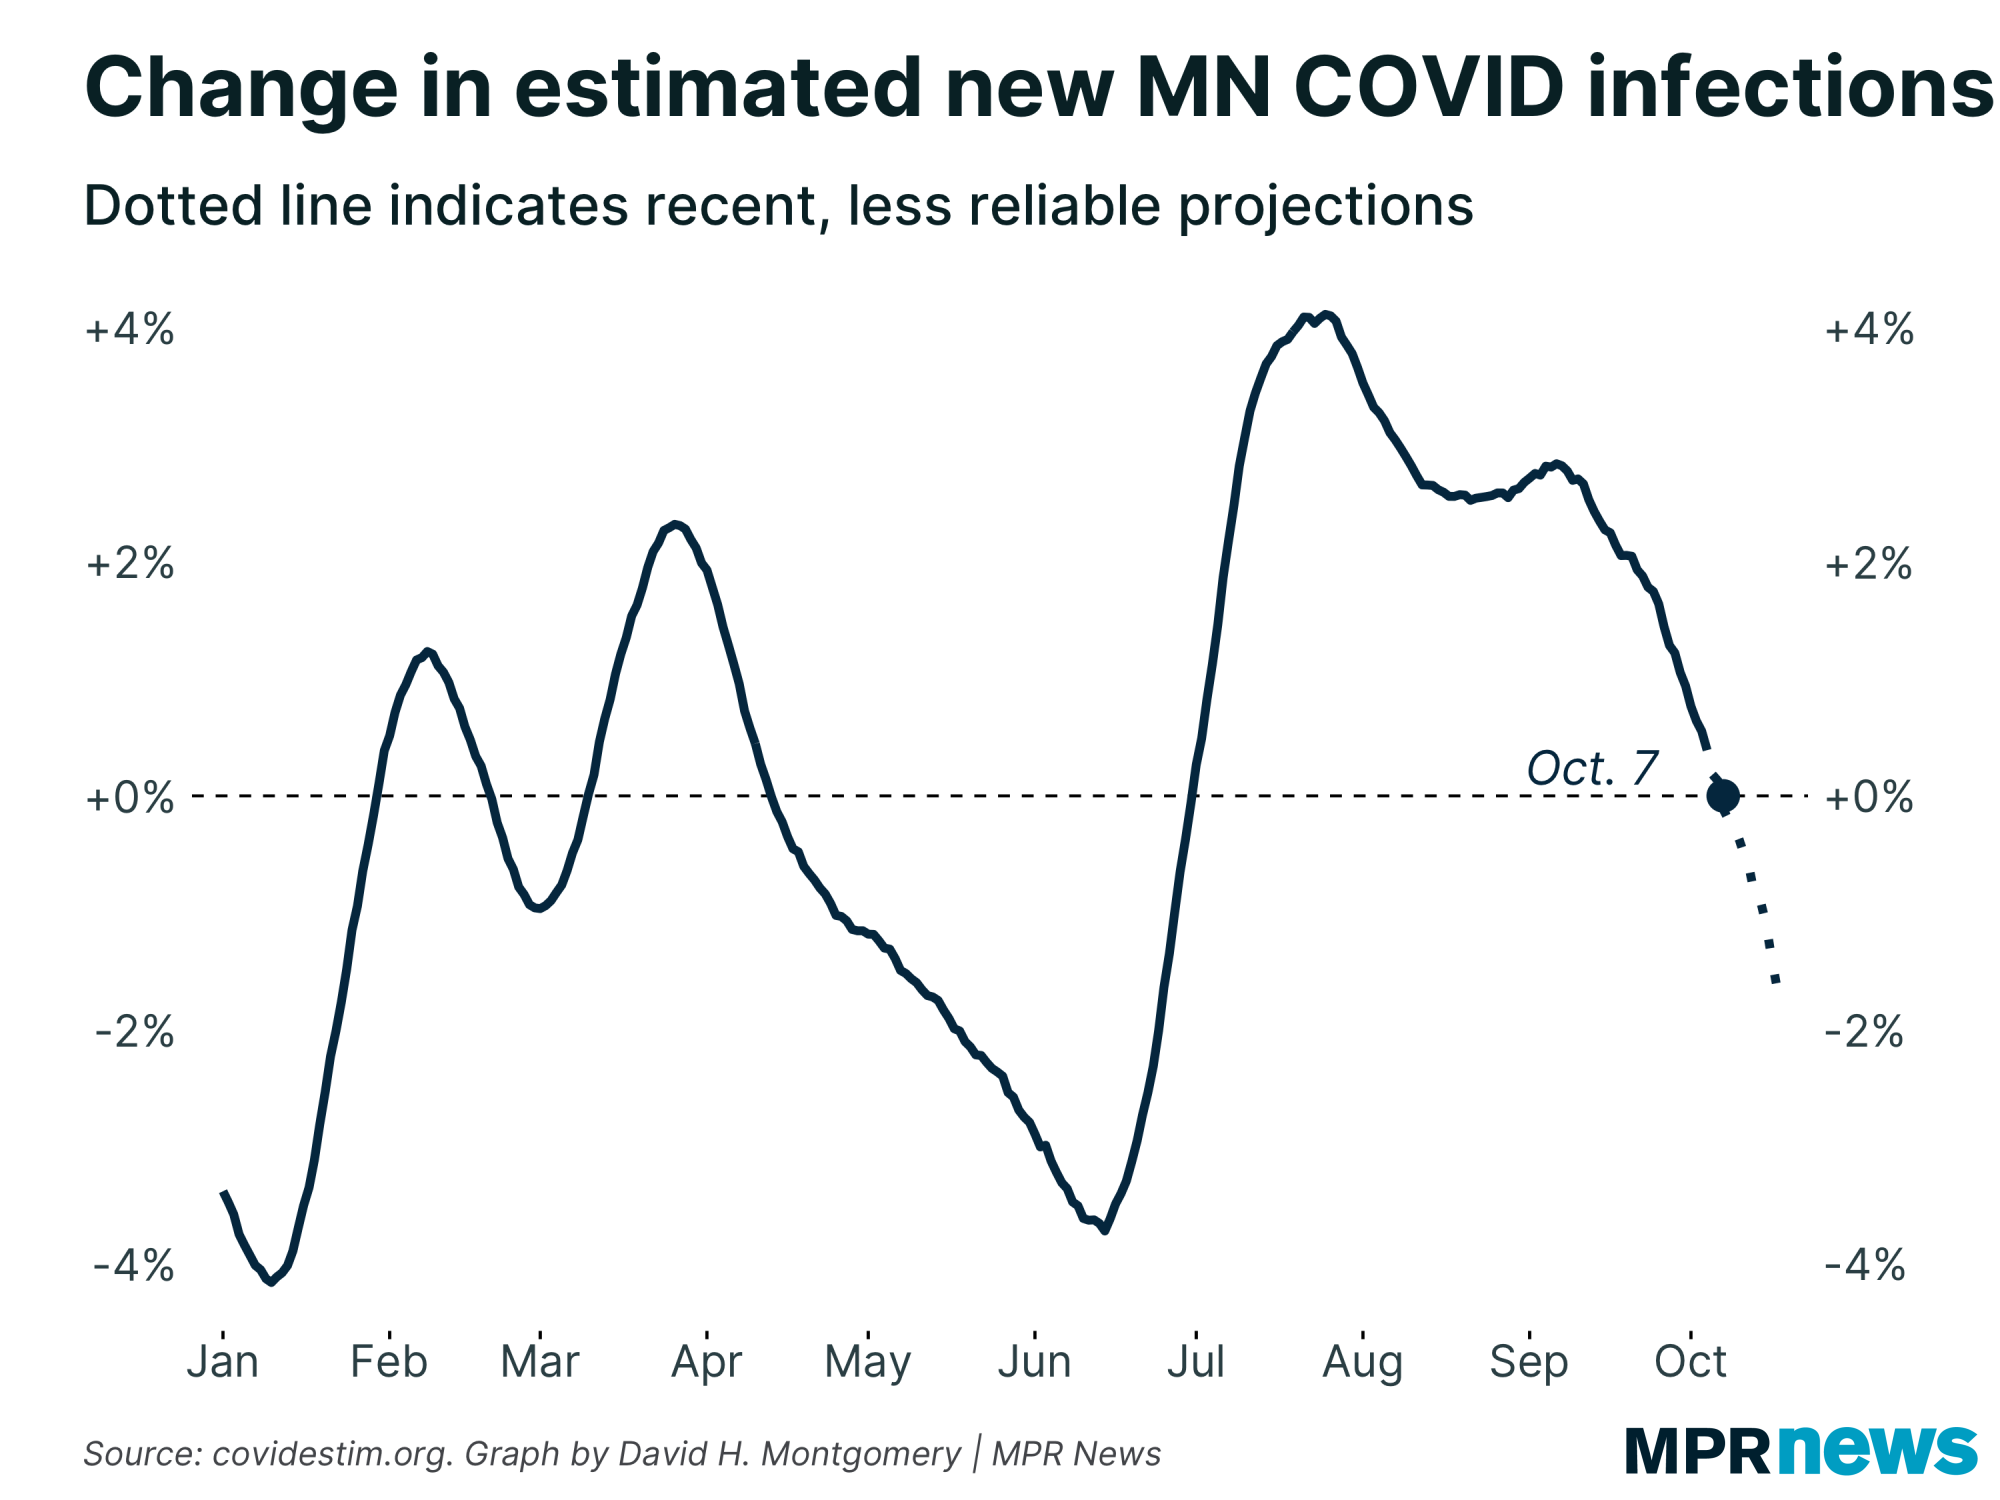
| But we don't need to just take my word for it. For some confirmation, I checked the models produced by covidestim.org. They show the rate of "effective production" of COVID in Minnesota falling below 1 — which means each sick person, on average, is infecting less than one additional person, which in turn means cases are likely to decline shortly. They also estimate that total new infections in Minnesota — both confirmed and unconfirmed — have already peaked, back in early October. |
| |
|
|
Even if the decline we've seen over the past few days is just a temporary blip, it's still better than the acceleration we were seeing a week or two ago. But we know this wave won't last forever, even if most of us thought this would have ended by now. (Some of us more embarrassingly publicly than others!) So on the basis of all this evidence, I'm cautiously optimistic that this is the long-awaited peak.
Of course, the peak of the fourth wave does not mean we won't have a fifth wave! We all hope we won't — or that if we do it's more like the mild Spring 2021 wave than what we've seen now. But we've now had three or more different times where a wave receded and most of us let ourselves think that maybe this was the end of all that. I think it's best to take a wait-and-see attitude. |
| |
|
|
Below, I'll explore a few more stats about Minnesota's COVID-19 outbreak. If you want to learn more, I also recommend these other articles:
|
| |
|
|
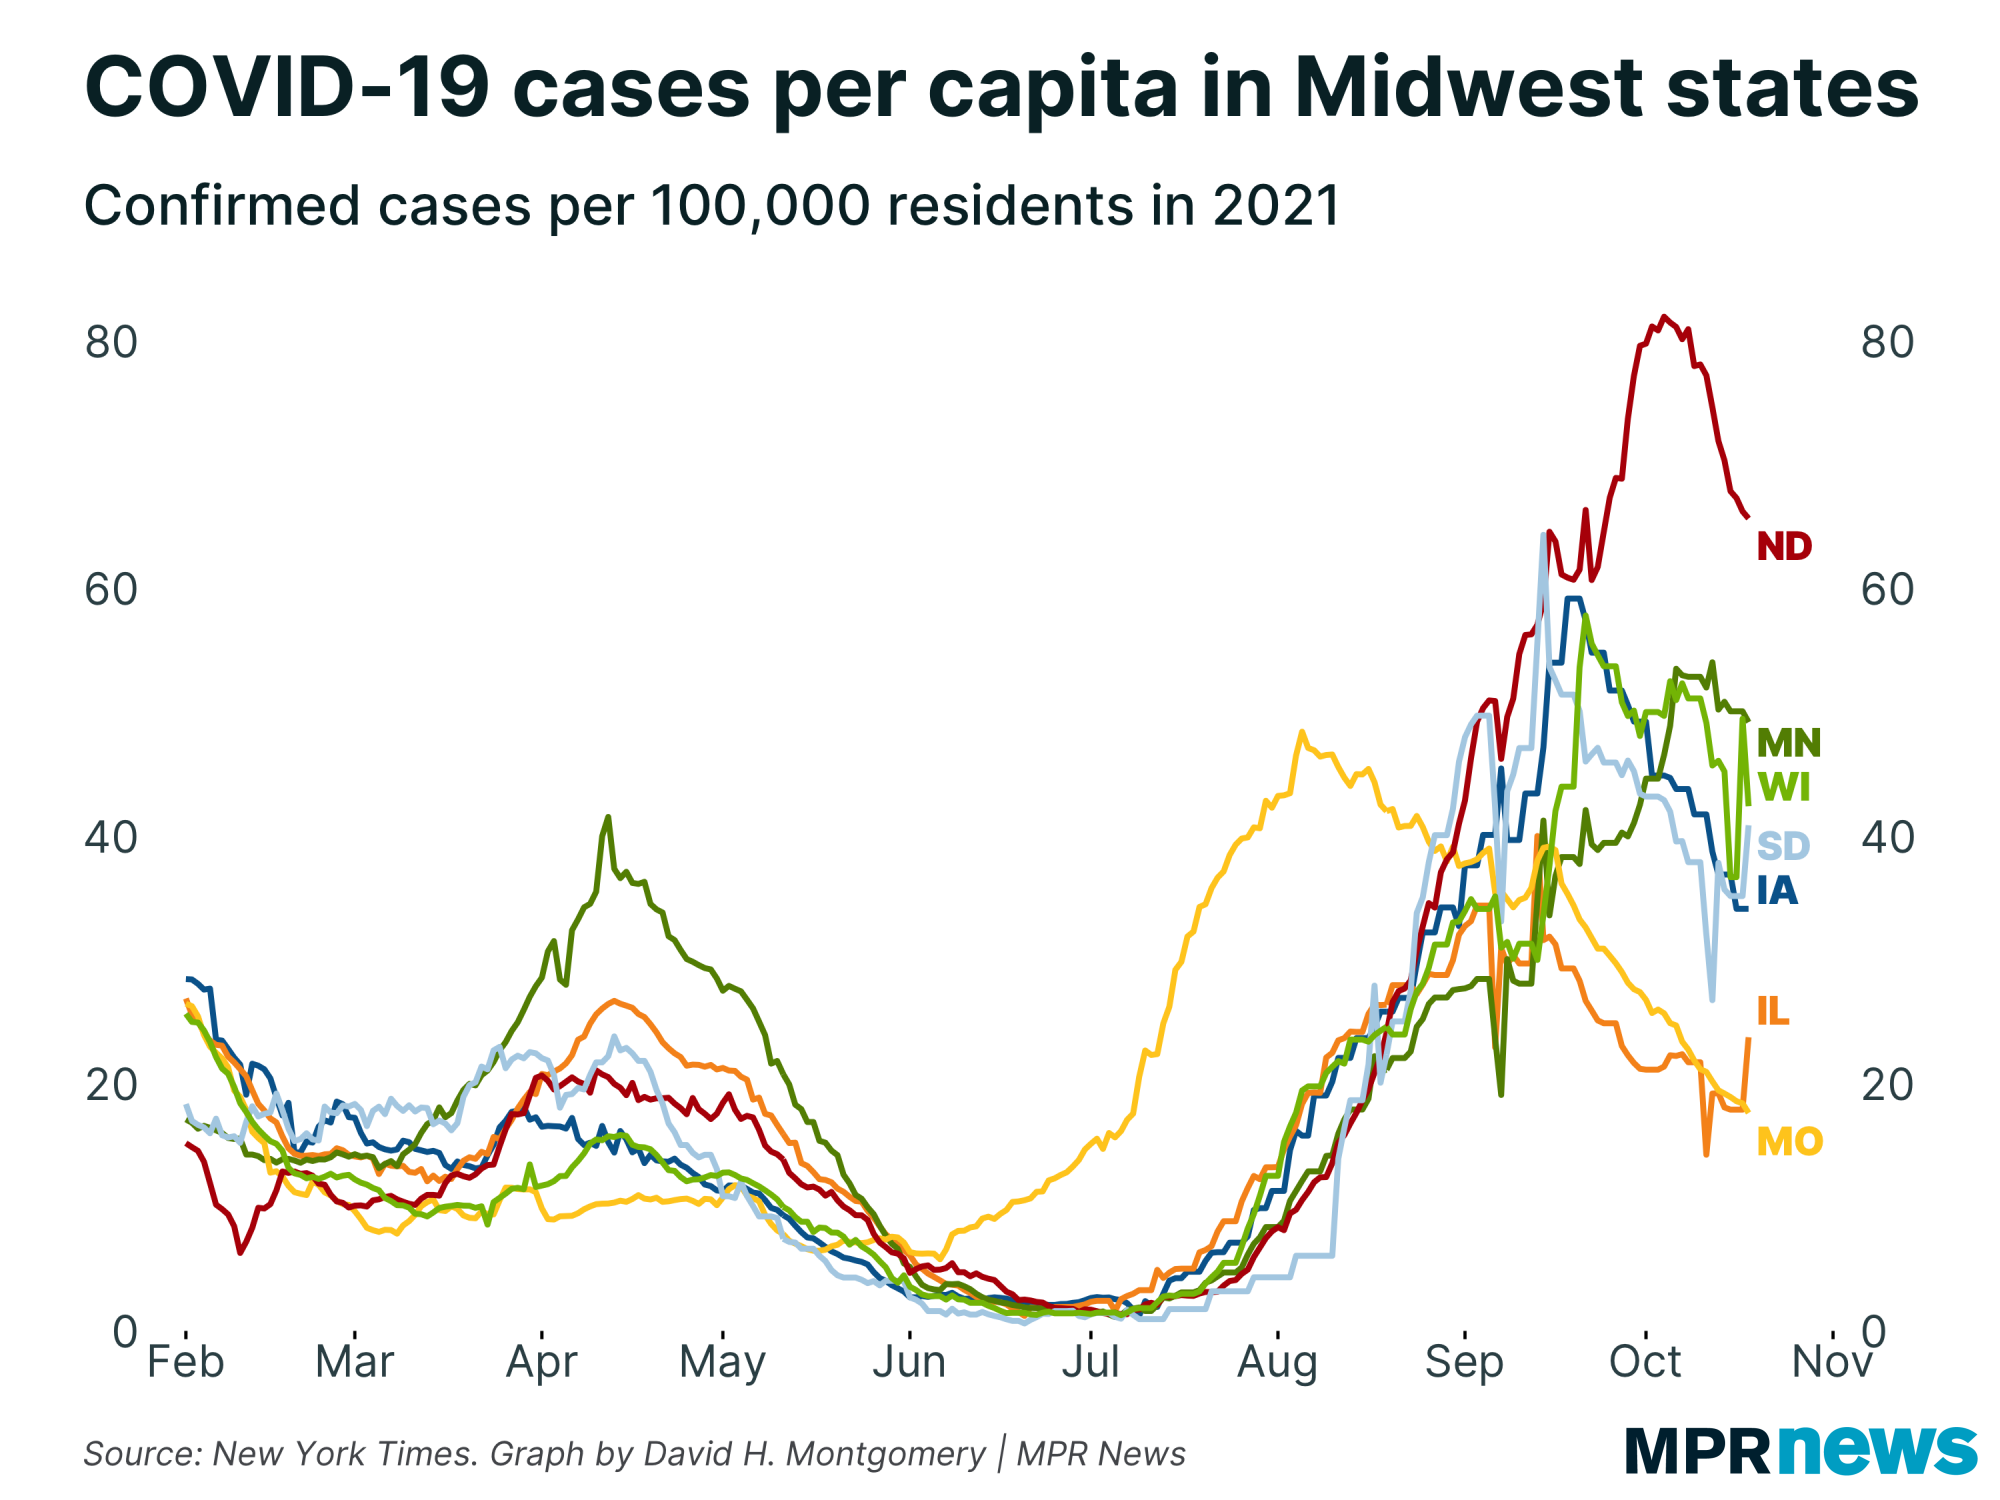
| Minnesota now outpaces most of the region | | Until around Labor Day, Minnesota consistently had the lowest rates of new COVID-19 cases in the Midwest, despite steady increases. Then our wave hit a new gear while most of Minnesota's neighbors saw their own waves peak. Now Minnesota has the second-highest rate of confirmed cases in the region. |
| |
|
|
Note that this doesn't account for some differentials in testing volume — South Dakota, despite having fewer confirmed cases per capita, has a positivity rate double Minnesota's.
But the downward trend here is encouraging. COVID can spread from state to state, so fewer infections in our neighbors means less of a chance that they'll spread the disease back to us. |
| |
|
|
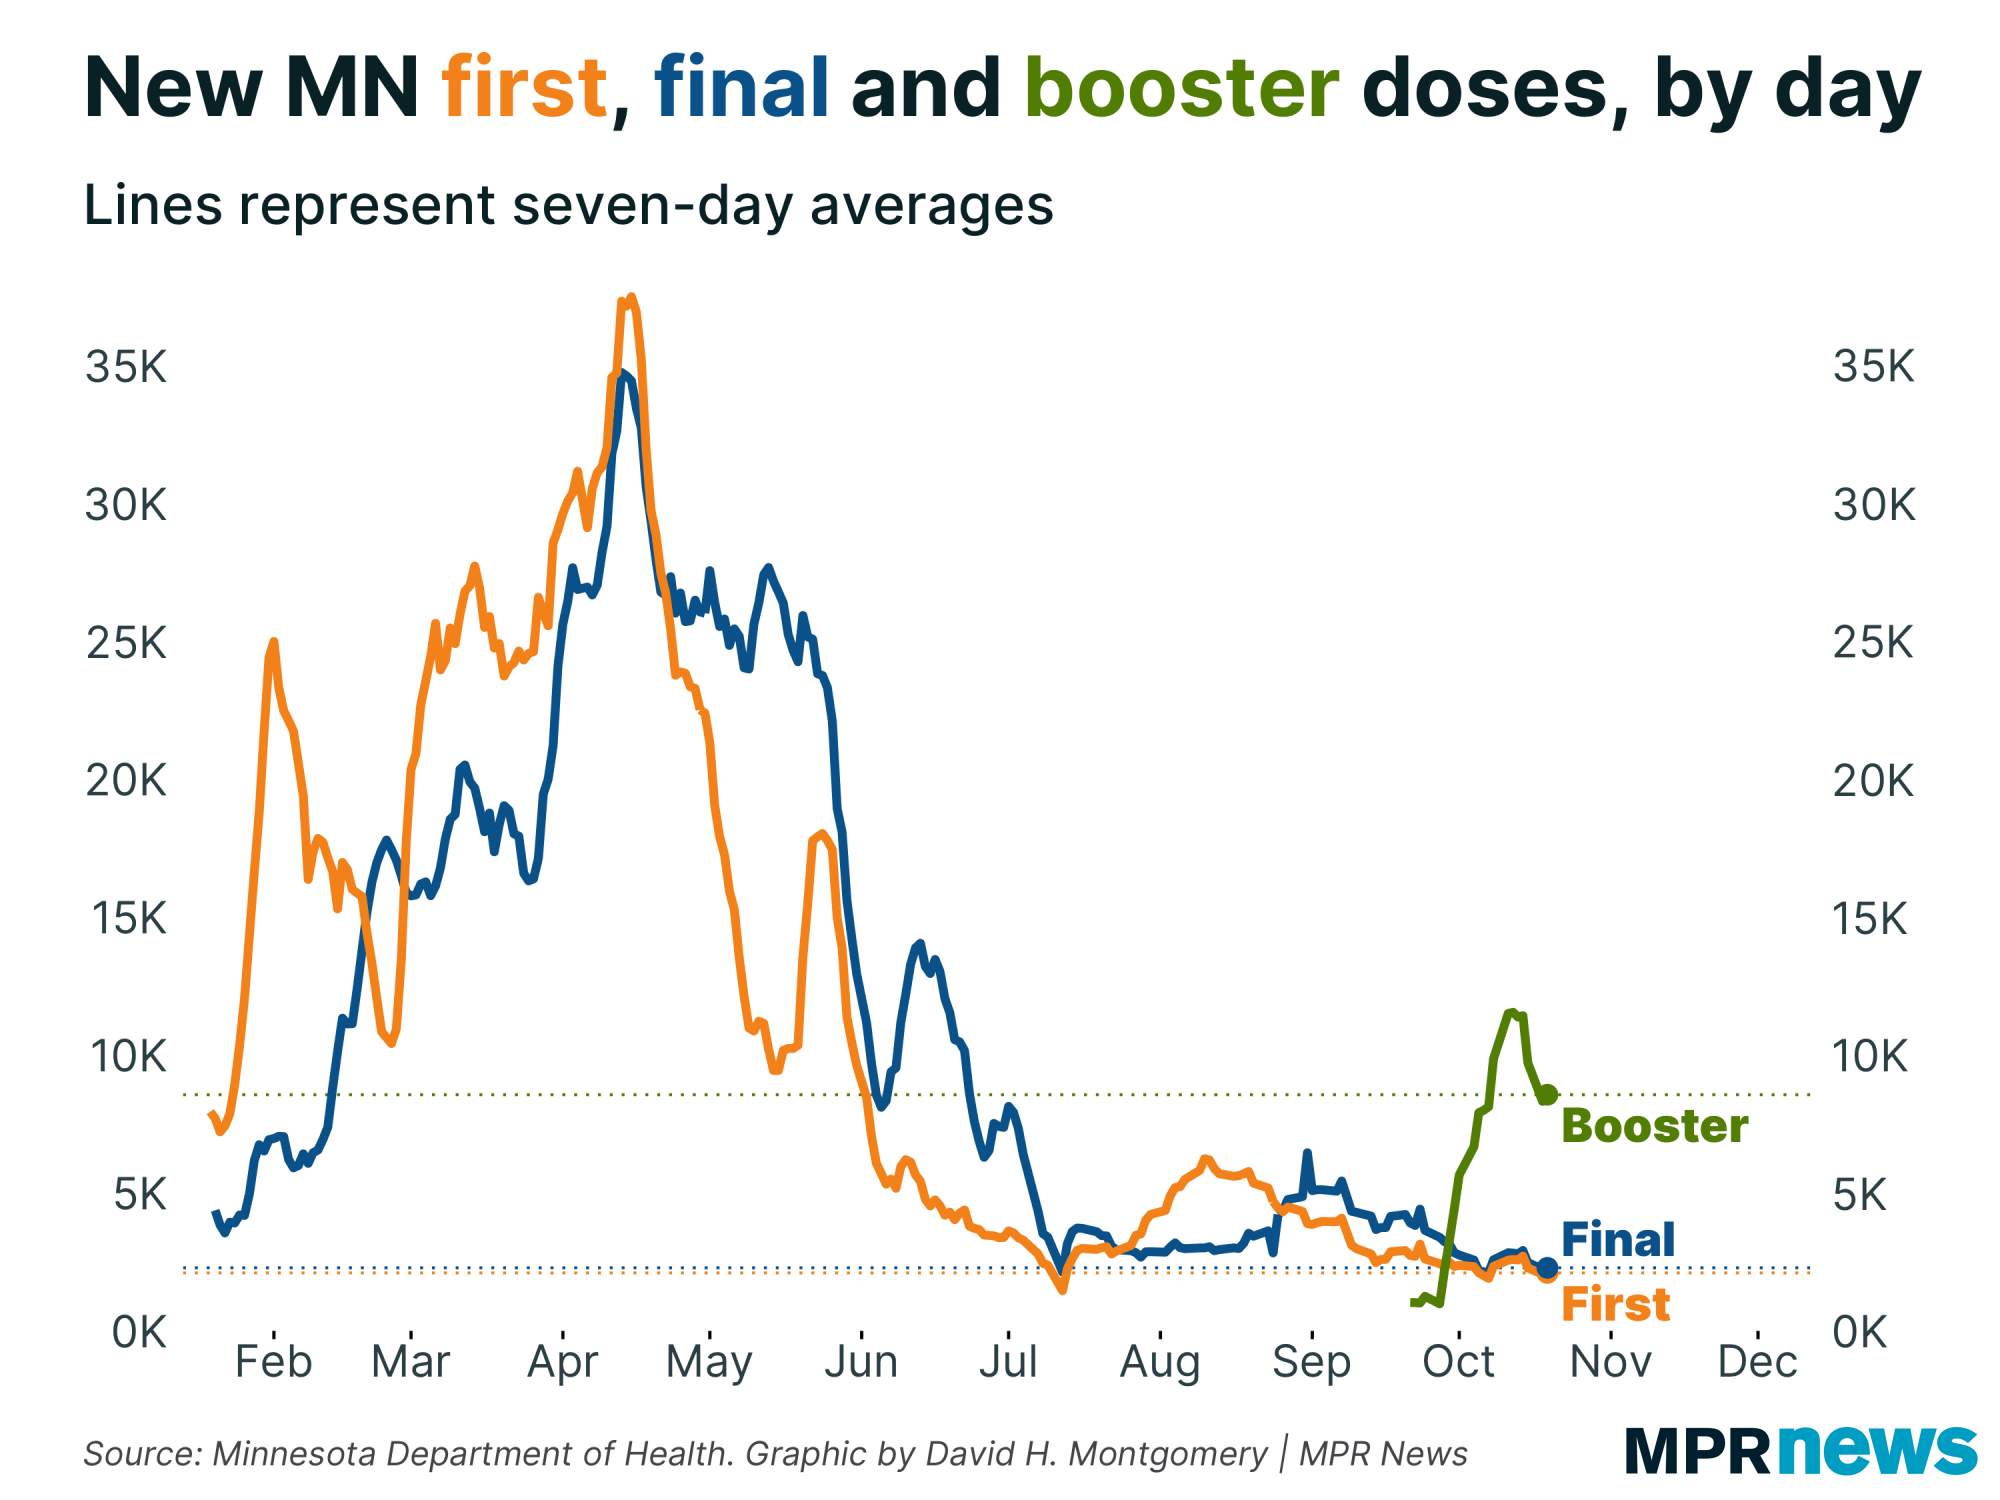
Modest pace for boosters as first doses stay slow
| Minnesota is averaging just under 10,000 booster shots administered per day, a slight decline from a peak earlier in the month.
But new first and second doses remain at very low levels. And even booster shots are far below the pace of first doses we saw earlier this spring, when the people currently eligible for boosters got their initial shots. |
| |
|
|
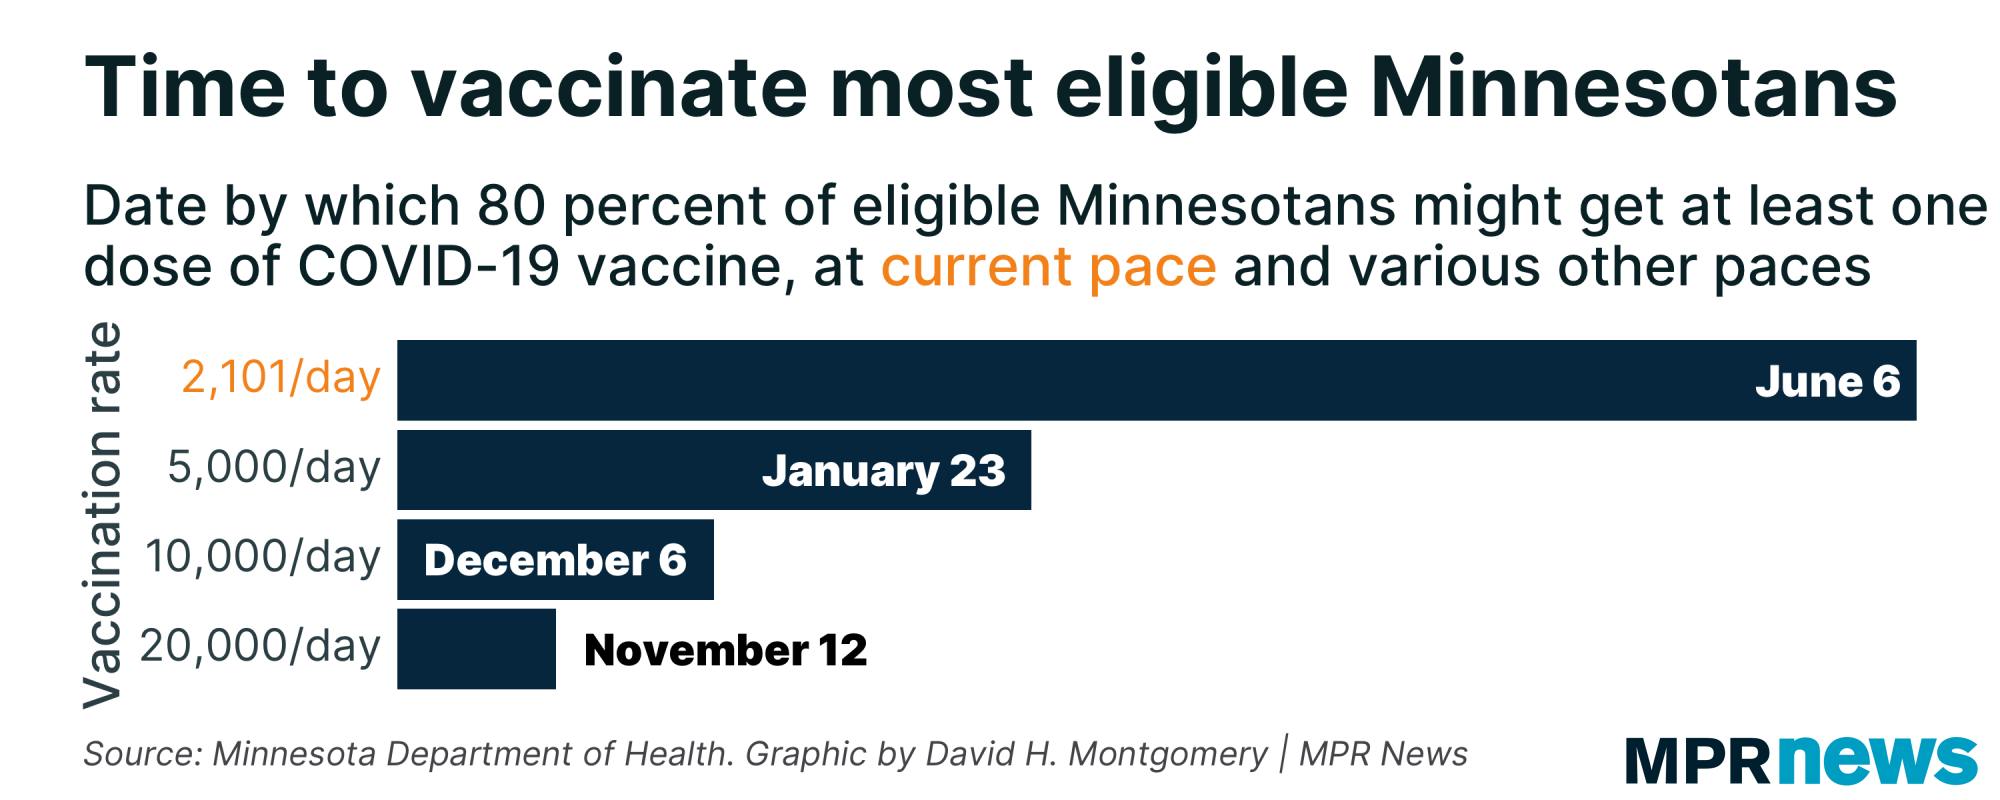
| At the current pace, it'll take until next summer for 80 percent of currently eligible Minnesotans to get at least one dose. At even 10,000 doses per day, we'd get there by early December. | | |
|
|
What's happening next?
| Hopefully, I'll be back in less than a week to confirm that our peak is, in fact, real!
Thanks for subscribing to this newsletter and for all of you who've sent me your feedback. As always, if you like this newsletter, please share it and the sign-up link with others who you think might enjoy it.
— David |
| |
|
|
Preference Center ❘ Unsubscribe You received this email because you subscribed or it was sent to you by a friend. This email was sent by: %%Member_Busname%%
%%Member_Addr%% %%Member_City%%, %%Member_State%%, %%Member_PostalCode%%
  |
|
|
| | |