%%[ SET @ViewURL = view_email_url
SET @ListID = ListID SET @SubChecker = _subscriberkey SET @EmailName = EmailName_ if @SubChecker == "rbrawley@mpr.org" then insertde('ENT.newsletter_archive_2','VAWPURL',@ViewURL,'SubscriberKey',
@SubChecker,'EmailName',@EmailName,'Date',NOW(),'ListID',@ListID) ELSE endif ]%% |
%%[ if _MessageContext != "VAWP" then ]%% %%[ endif ]%% |
| Welcome back to COVID in Minnesota TODAY, an email newsletter from MPR News about understanding the latest developments in Minnesota's COVID-19 outbreak. | | |
|
|
Minnesota's first COVID-19 death happened on March 19, 2020, and was reported to the public on March 21.
Yesterday, 636 days after that first death, Minnesota reported its 10,000th COVID death — an average of nearly 16 deaths per day for the better part of two years.
Amid that reminder of COVID's grim cost, however, Wednesday's report also provides reasons to hope. We're in the middle of a sustained decline in new cases, and may even be starting to see hospitalizations fall. If this continues — not guaranteed at all! — we could finally see an end to the elevated case levels we've seen since the summer.
I'll go into both more below. |
| |
|
|
Three things to know
| - Minnesota's brief post-Thanksgiving spike has turned into consistent declines in case counts
- 10,000 Minnesotans have died from COVID-19, most — but not all — of them elderly
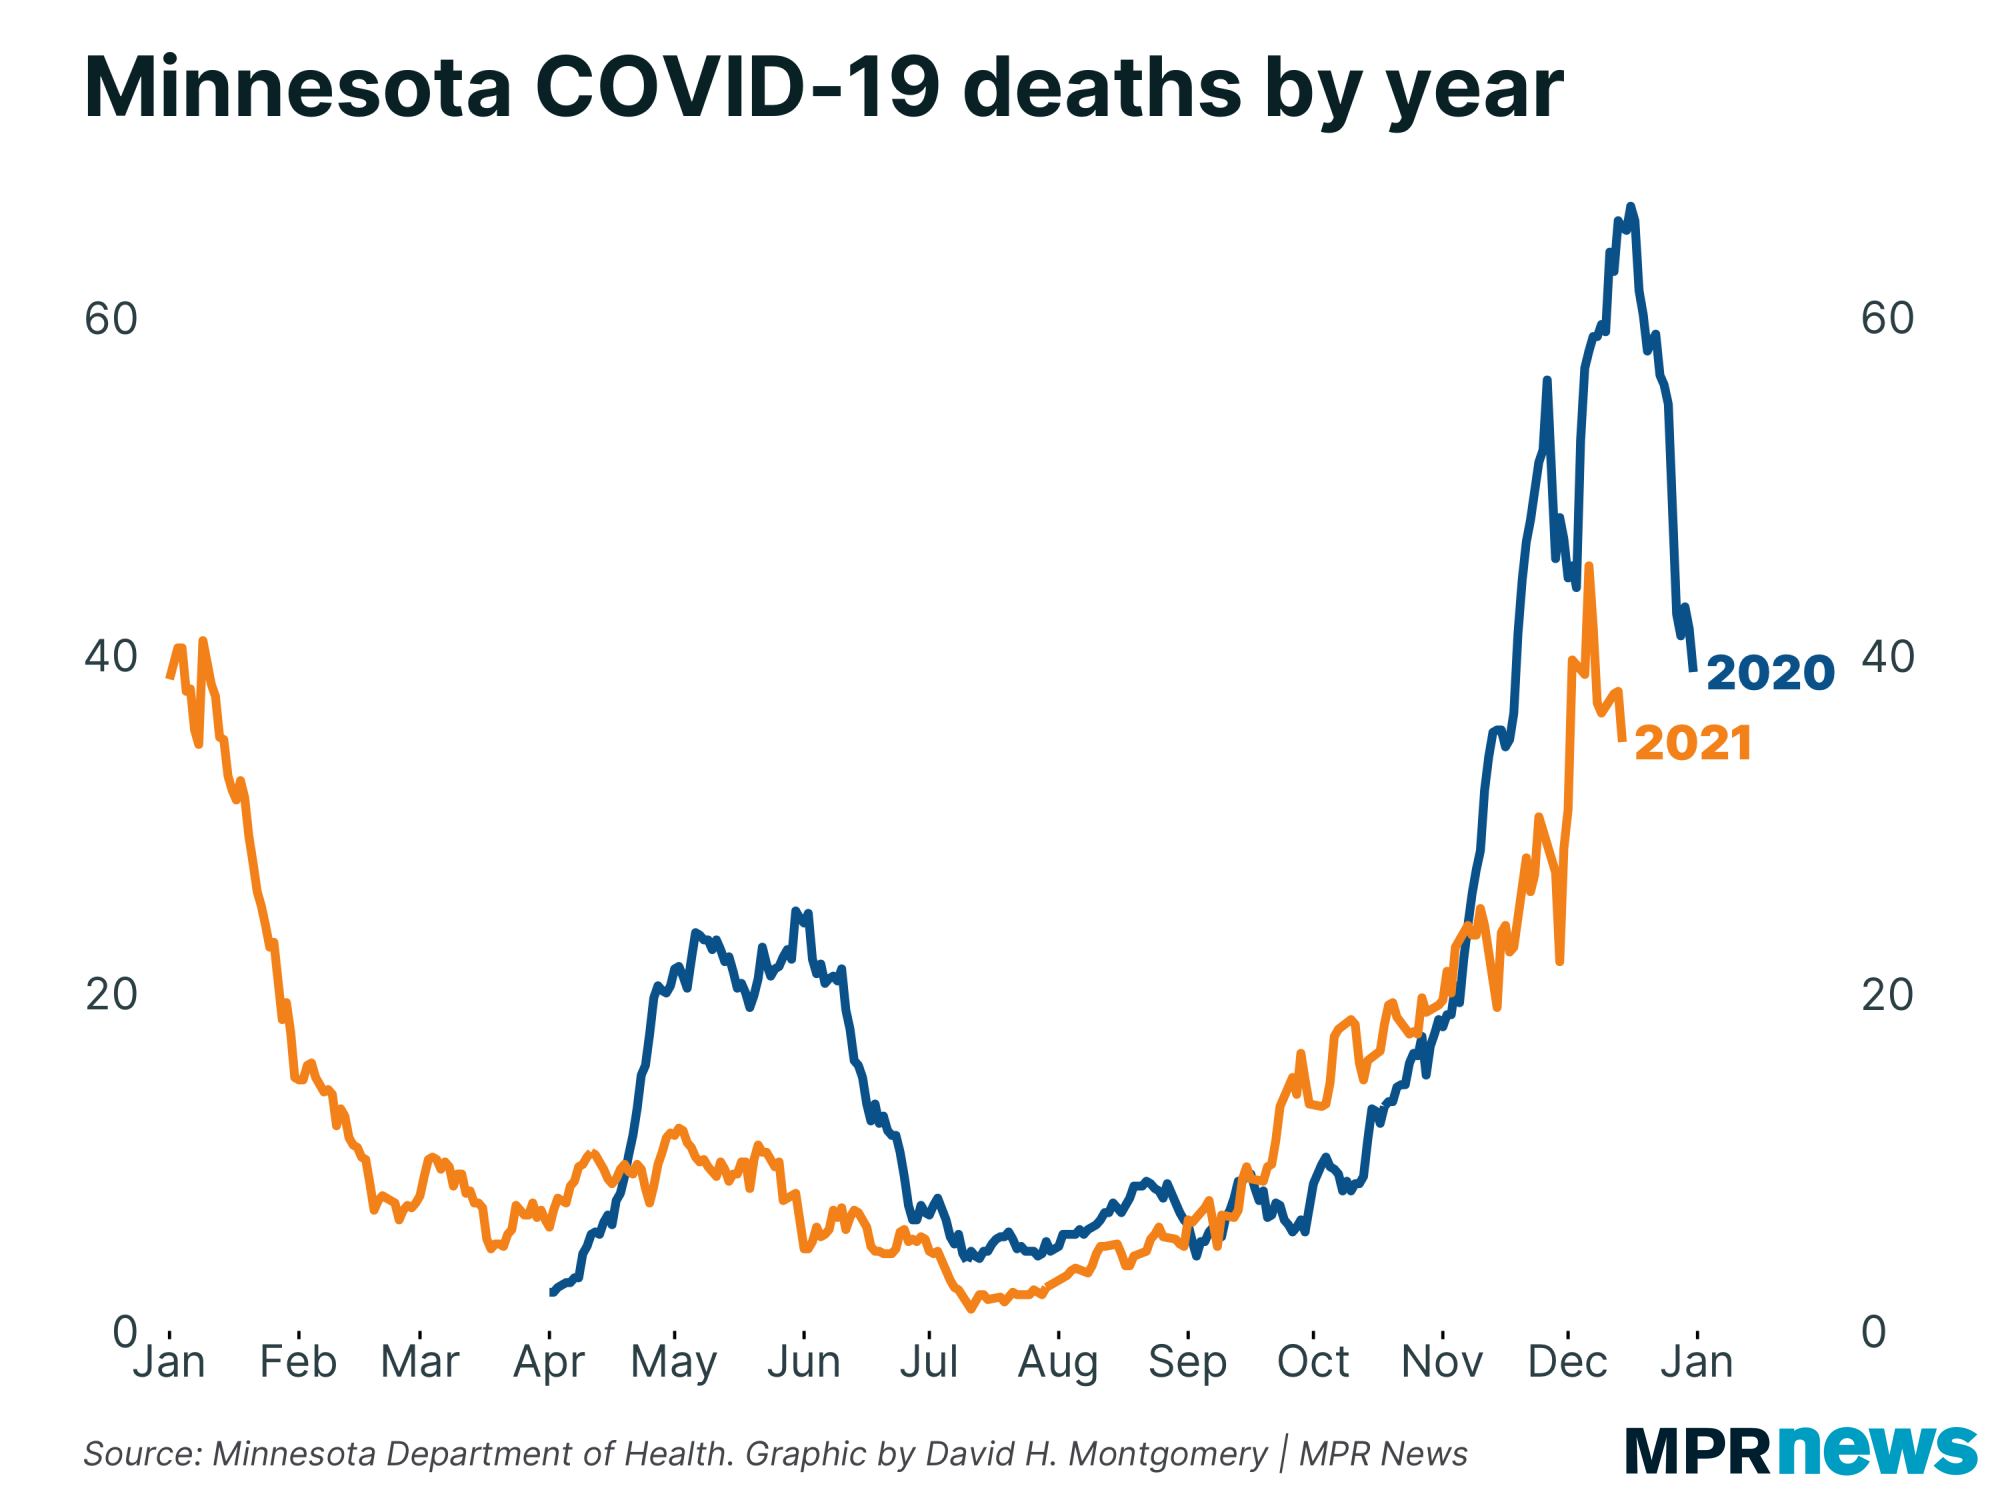
- 2021 is on pace to be almost as deadly a year as 2020 was
|
| |
|
|
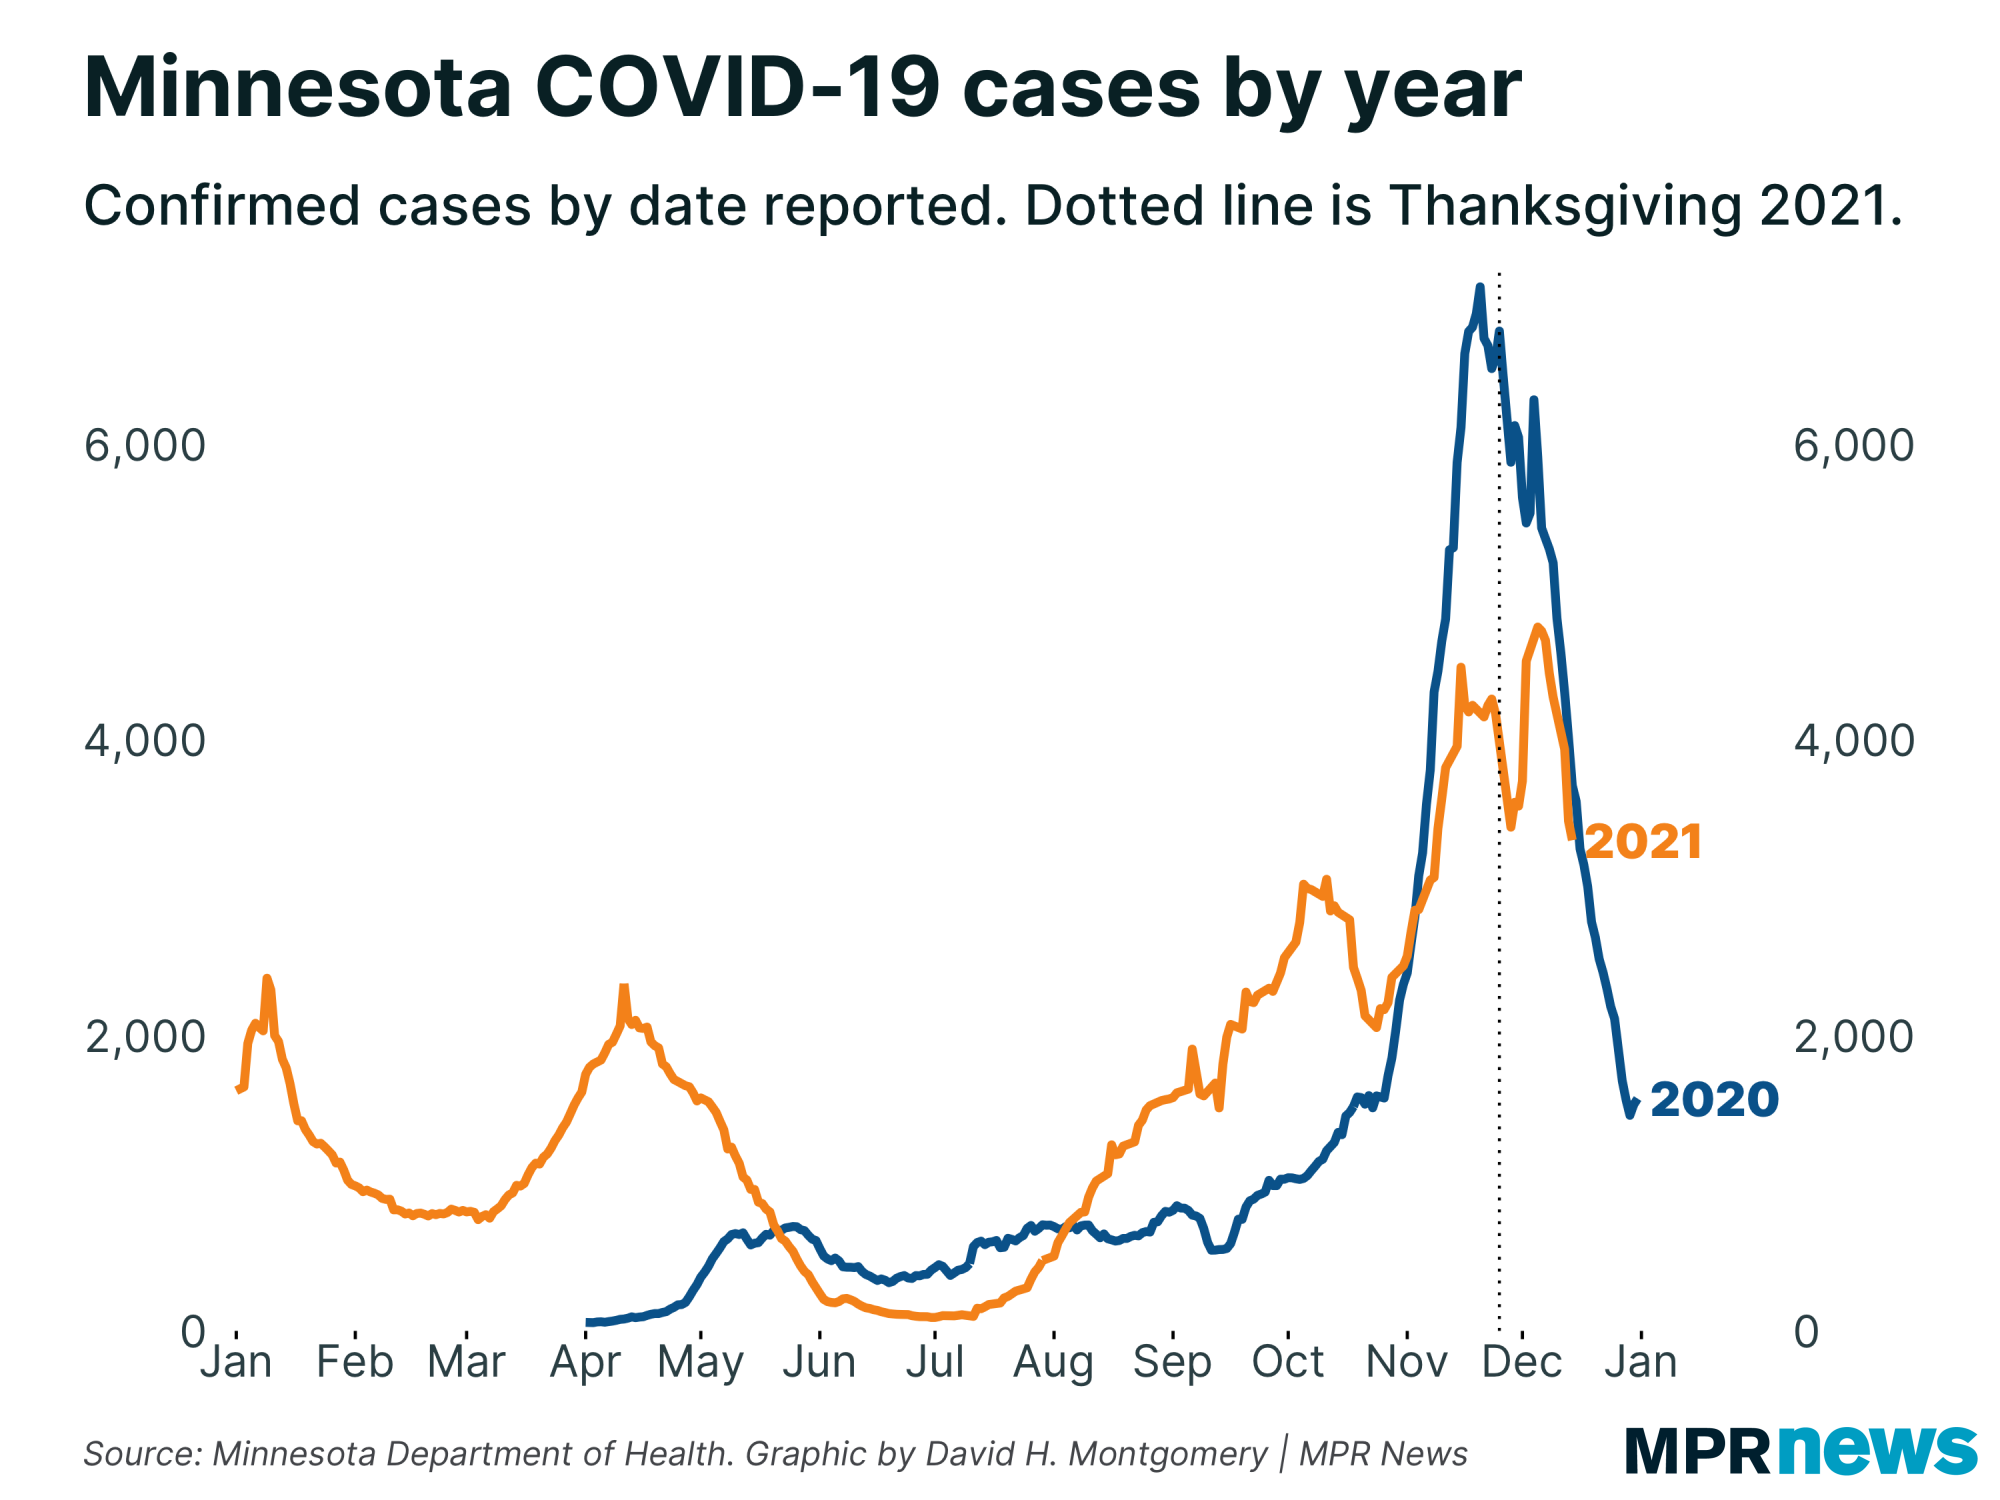
Last week the data was suggesting that we might have peaked. This week so far has confirmed that impression.
Not only have the declines been consistent, they've been dramatic. We've gone from an average of just under 4,300 cases per day on Friday to just over 3,300 yesterday. | |
|
|
|
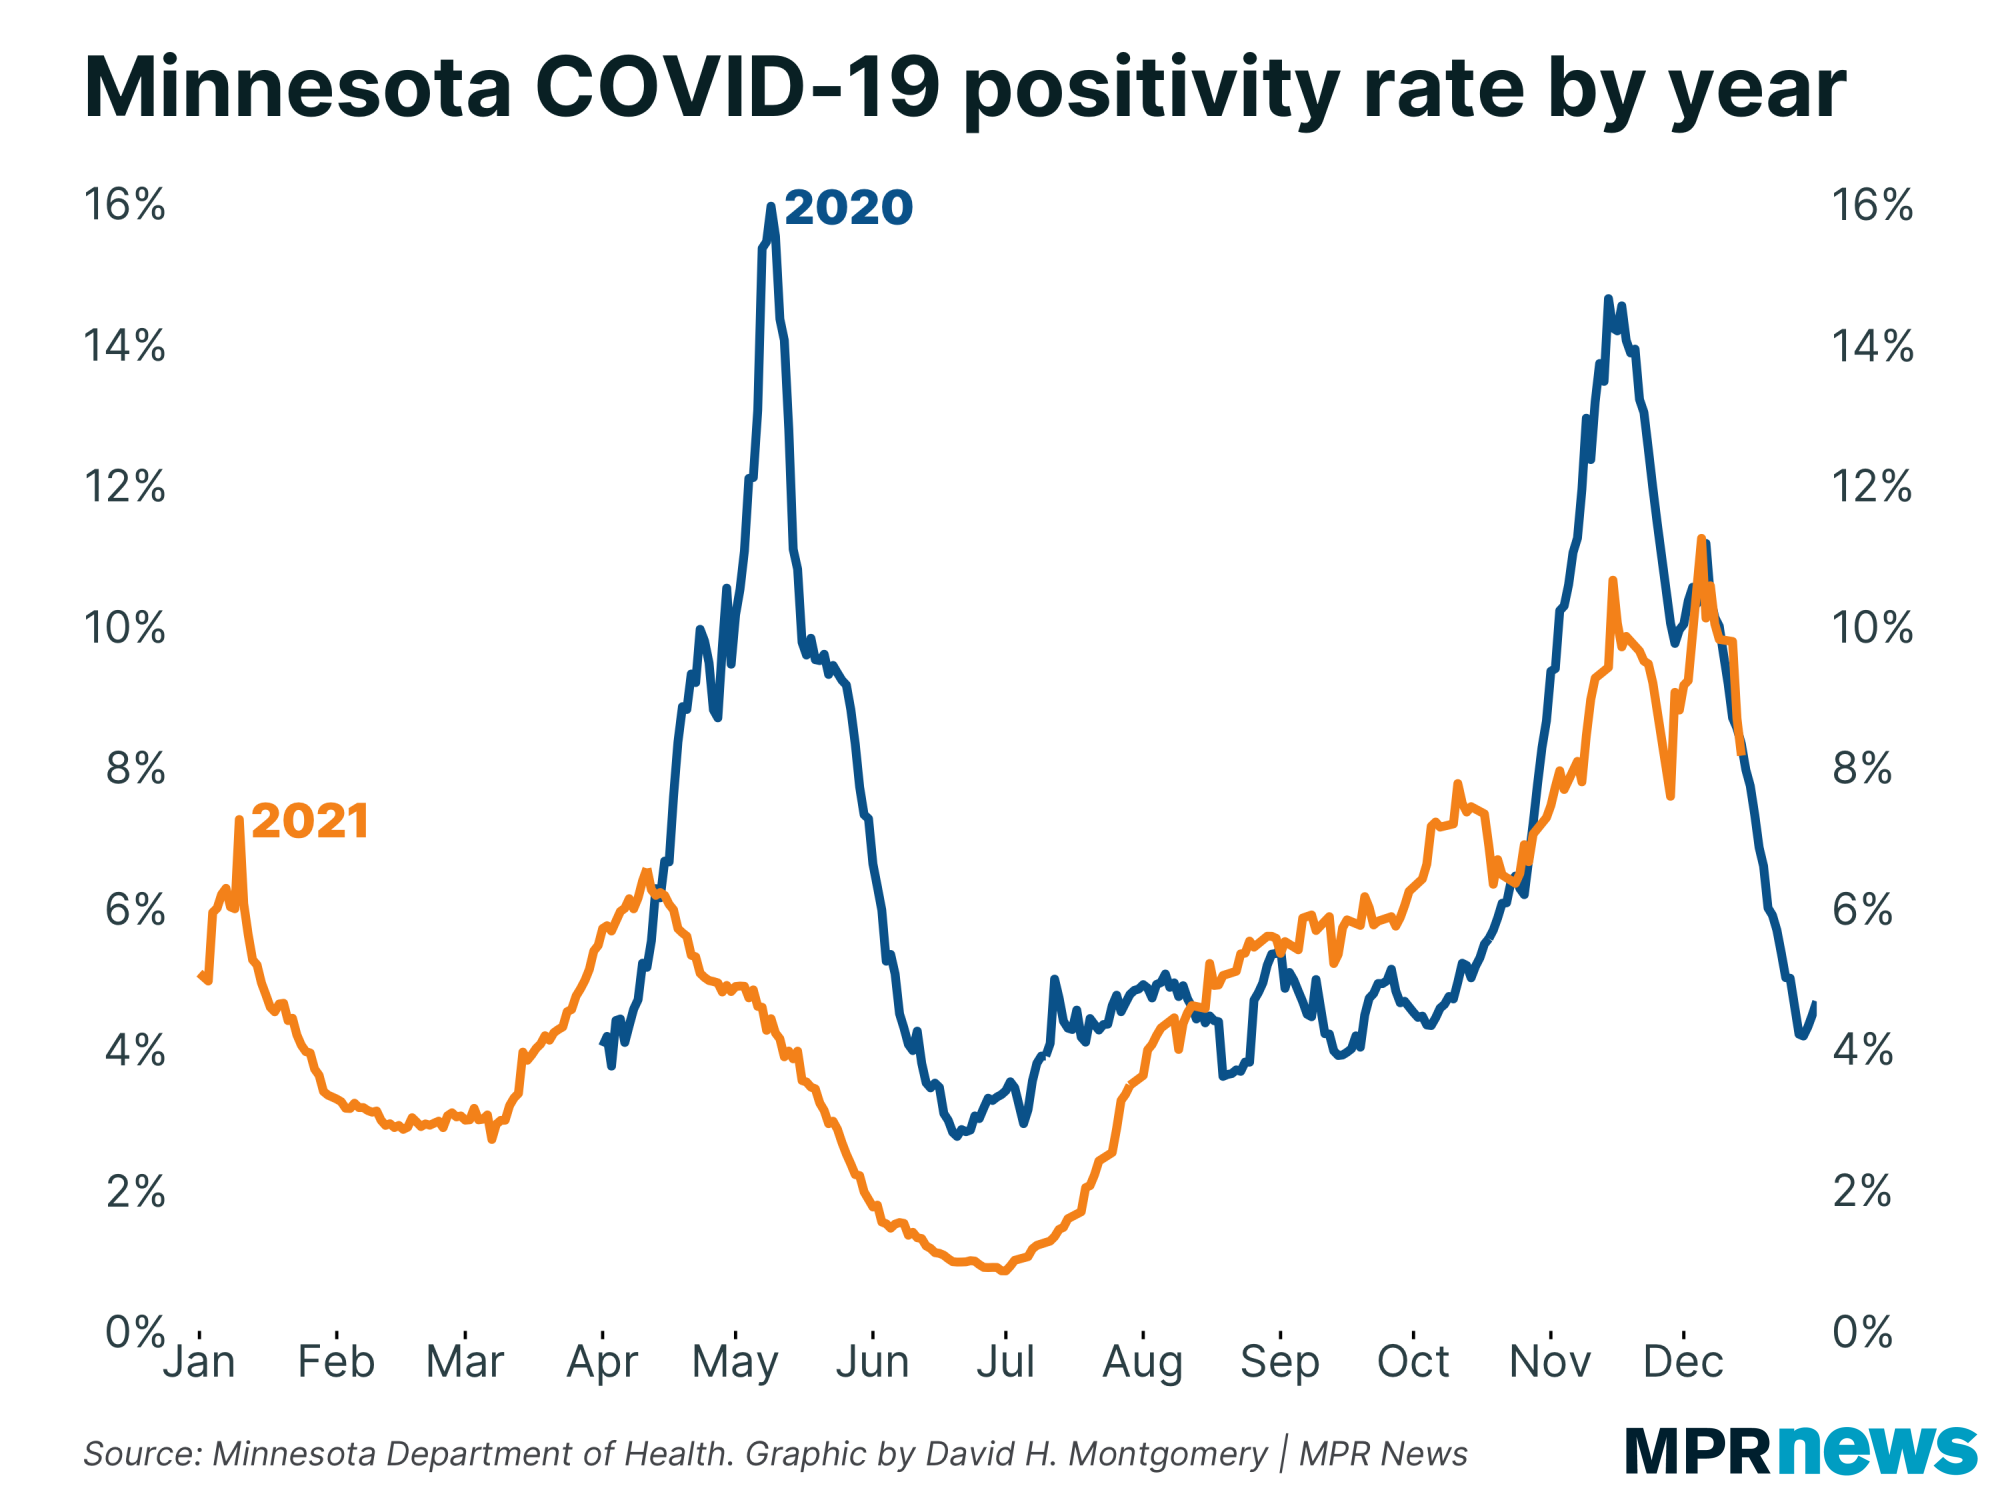
| Positivity rate has fallen from 9.8 percent to 8.2 percent in that same span of just a few days. | | |
|
|
Even more striking than the drops here is how closely these drops mirror what happened last year at this exact time.
That is to a degree encouraging, since case counts in late December 2020 did everything we want them to now. If there's some seasonal factor driving cases down now, replicating last December's plunge, it gives us hope this drop will continue and not suddenly reverse like happened to our last two drops.
Of course, the past is not guaranteed to repeat itself. The delta variant is different from the virus at large a year ago, and so is the nascent omicron variant. A year ago vaccinations were just beginning; today well over half of Minnesotans are inoculated. Similarly changed are people's behavior, both because we no longer have a mask mandate and because many people who were most worried about the disease last year are now vaccinated and less concerned.
Our week-and-a-half improvement could continue straight on past Christmas (though if the past is any guide we'll get a moderate post-New Years bump). Or it could reverse tomorrow. So far, at least, everything is moving in the right direction.
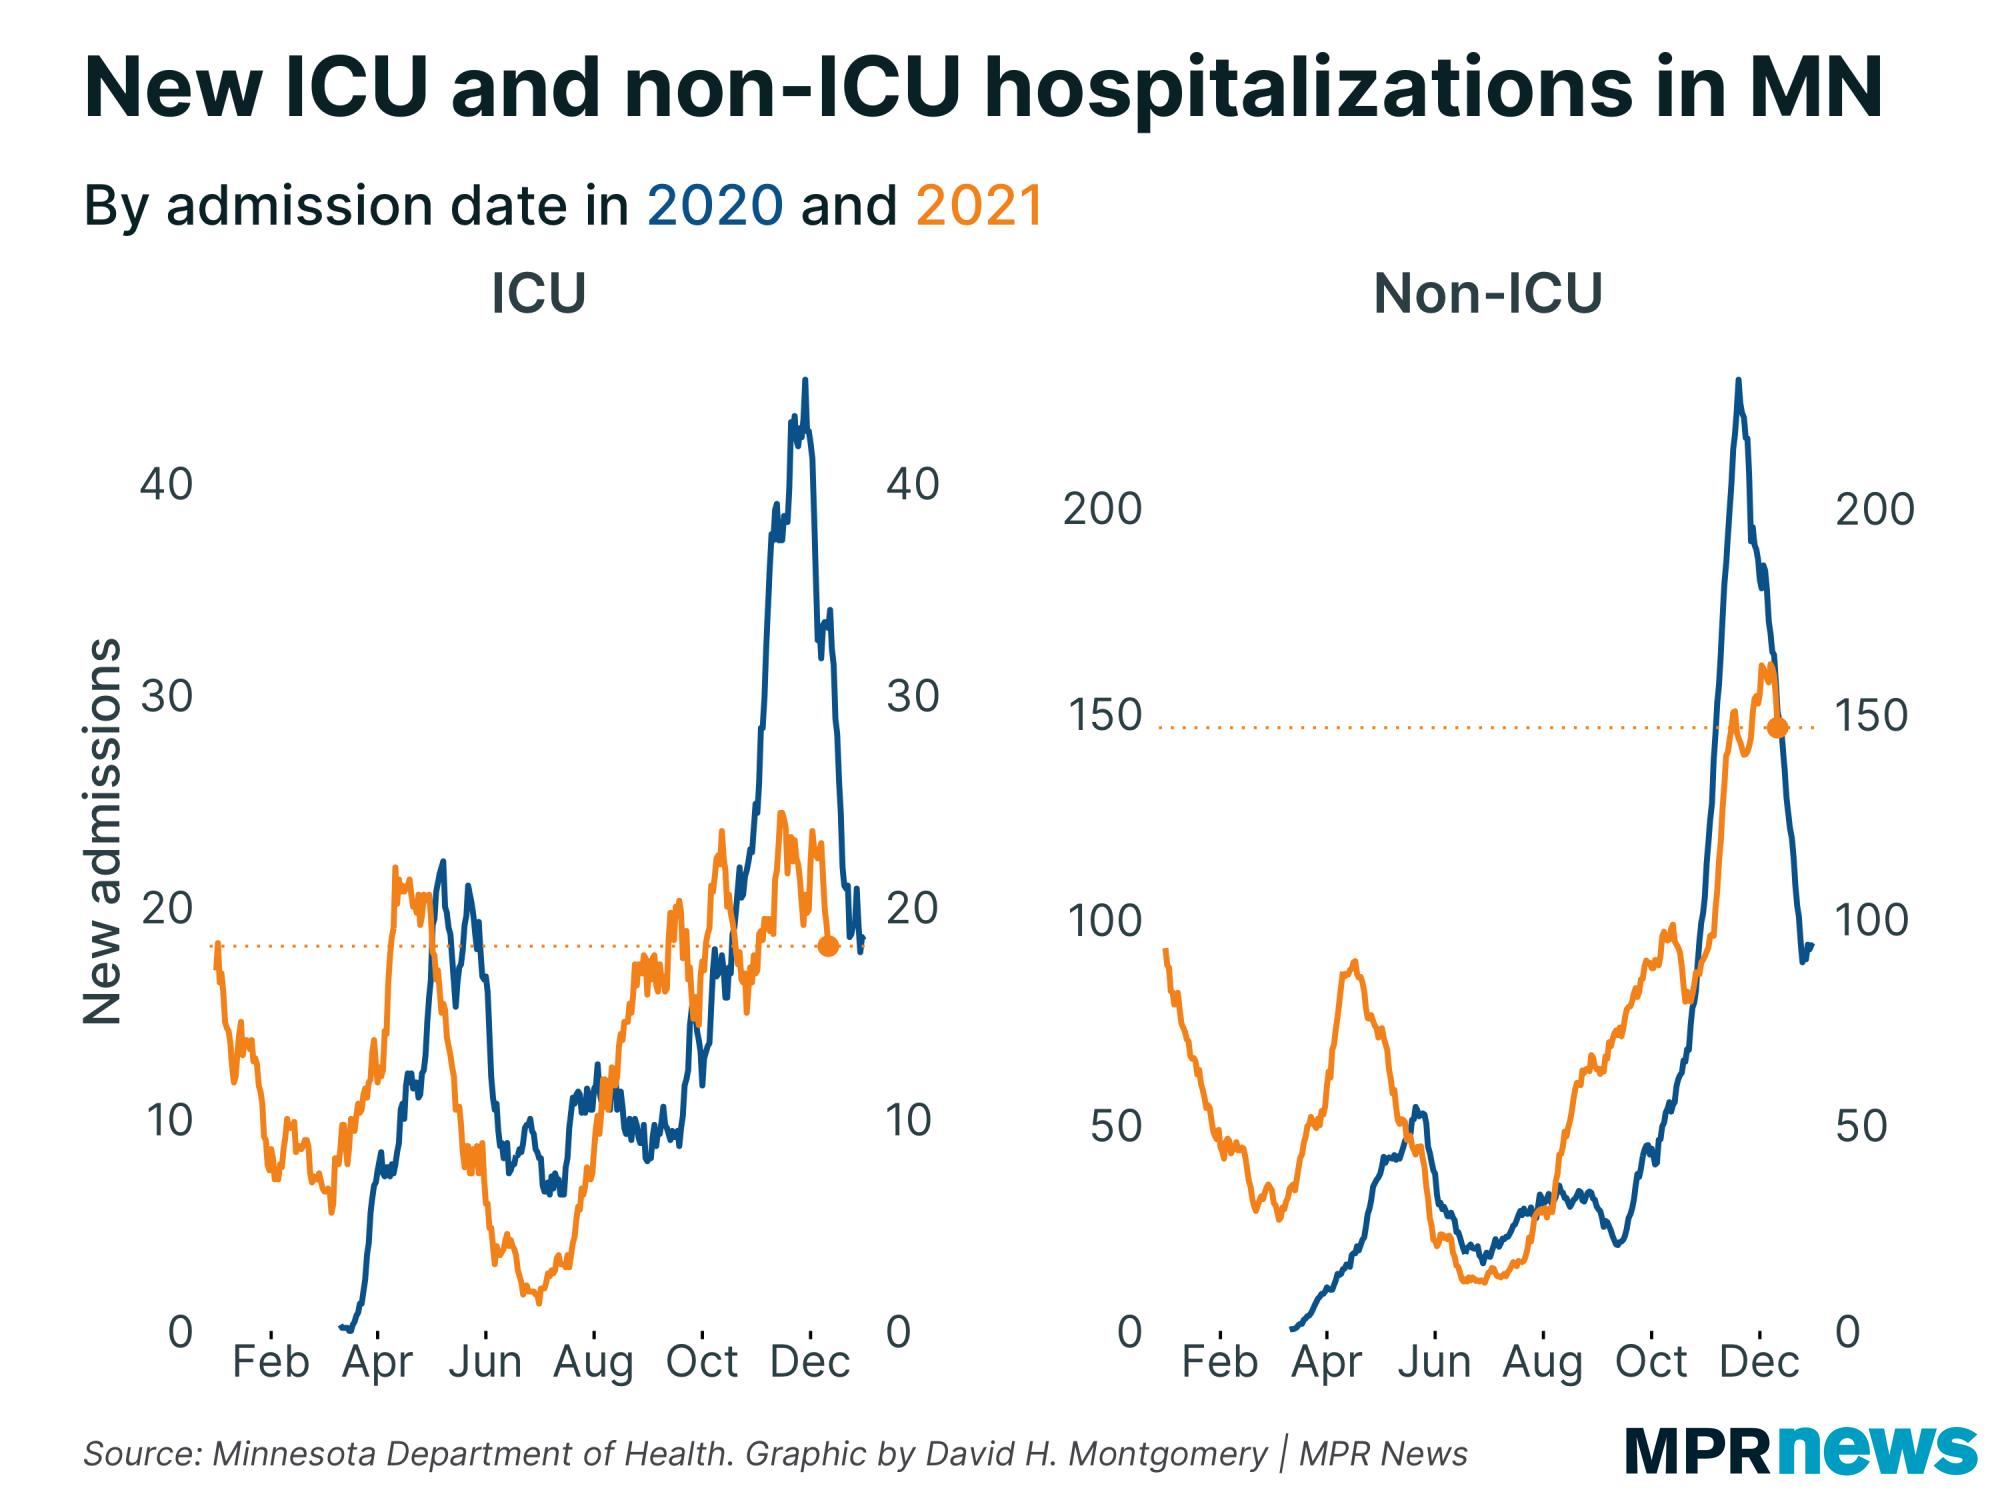
That includes, more tenuously, hospital admissions! |
| |
|
|
| These drops aren't yet as stable or dramatic as what we've seen in cases or positivity rate, so we'll want to wait to see if these continue at least into next week before concluding there's a trend at work here. | | |
|
|
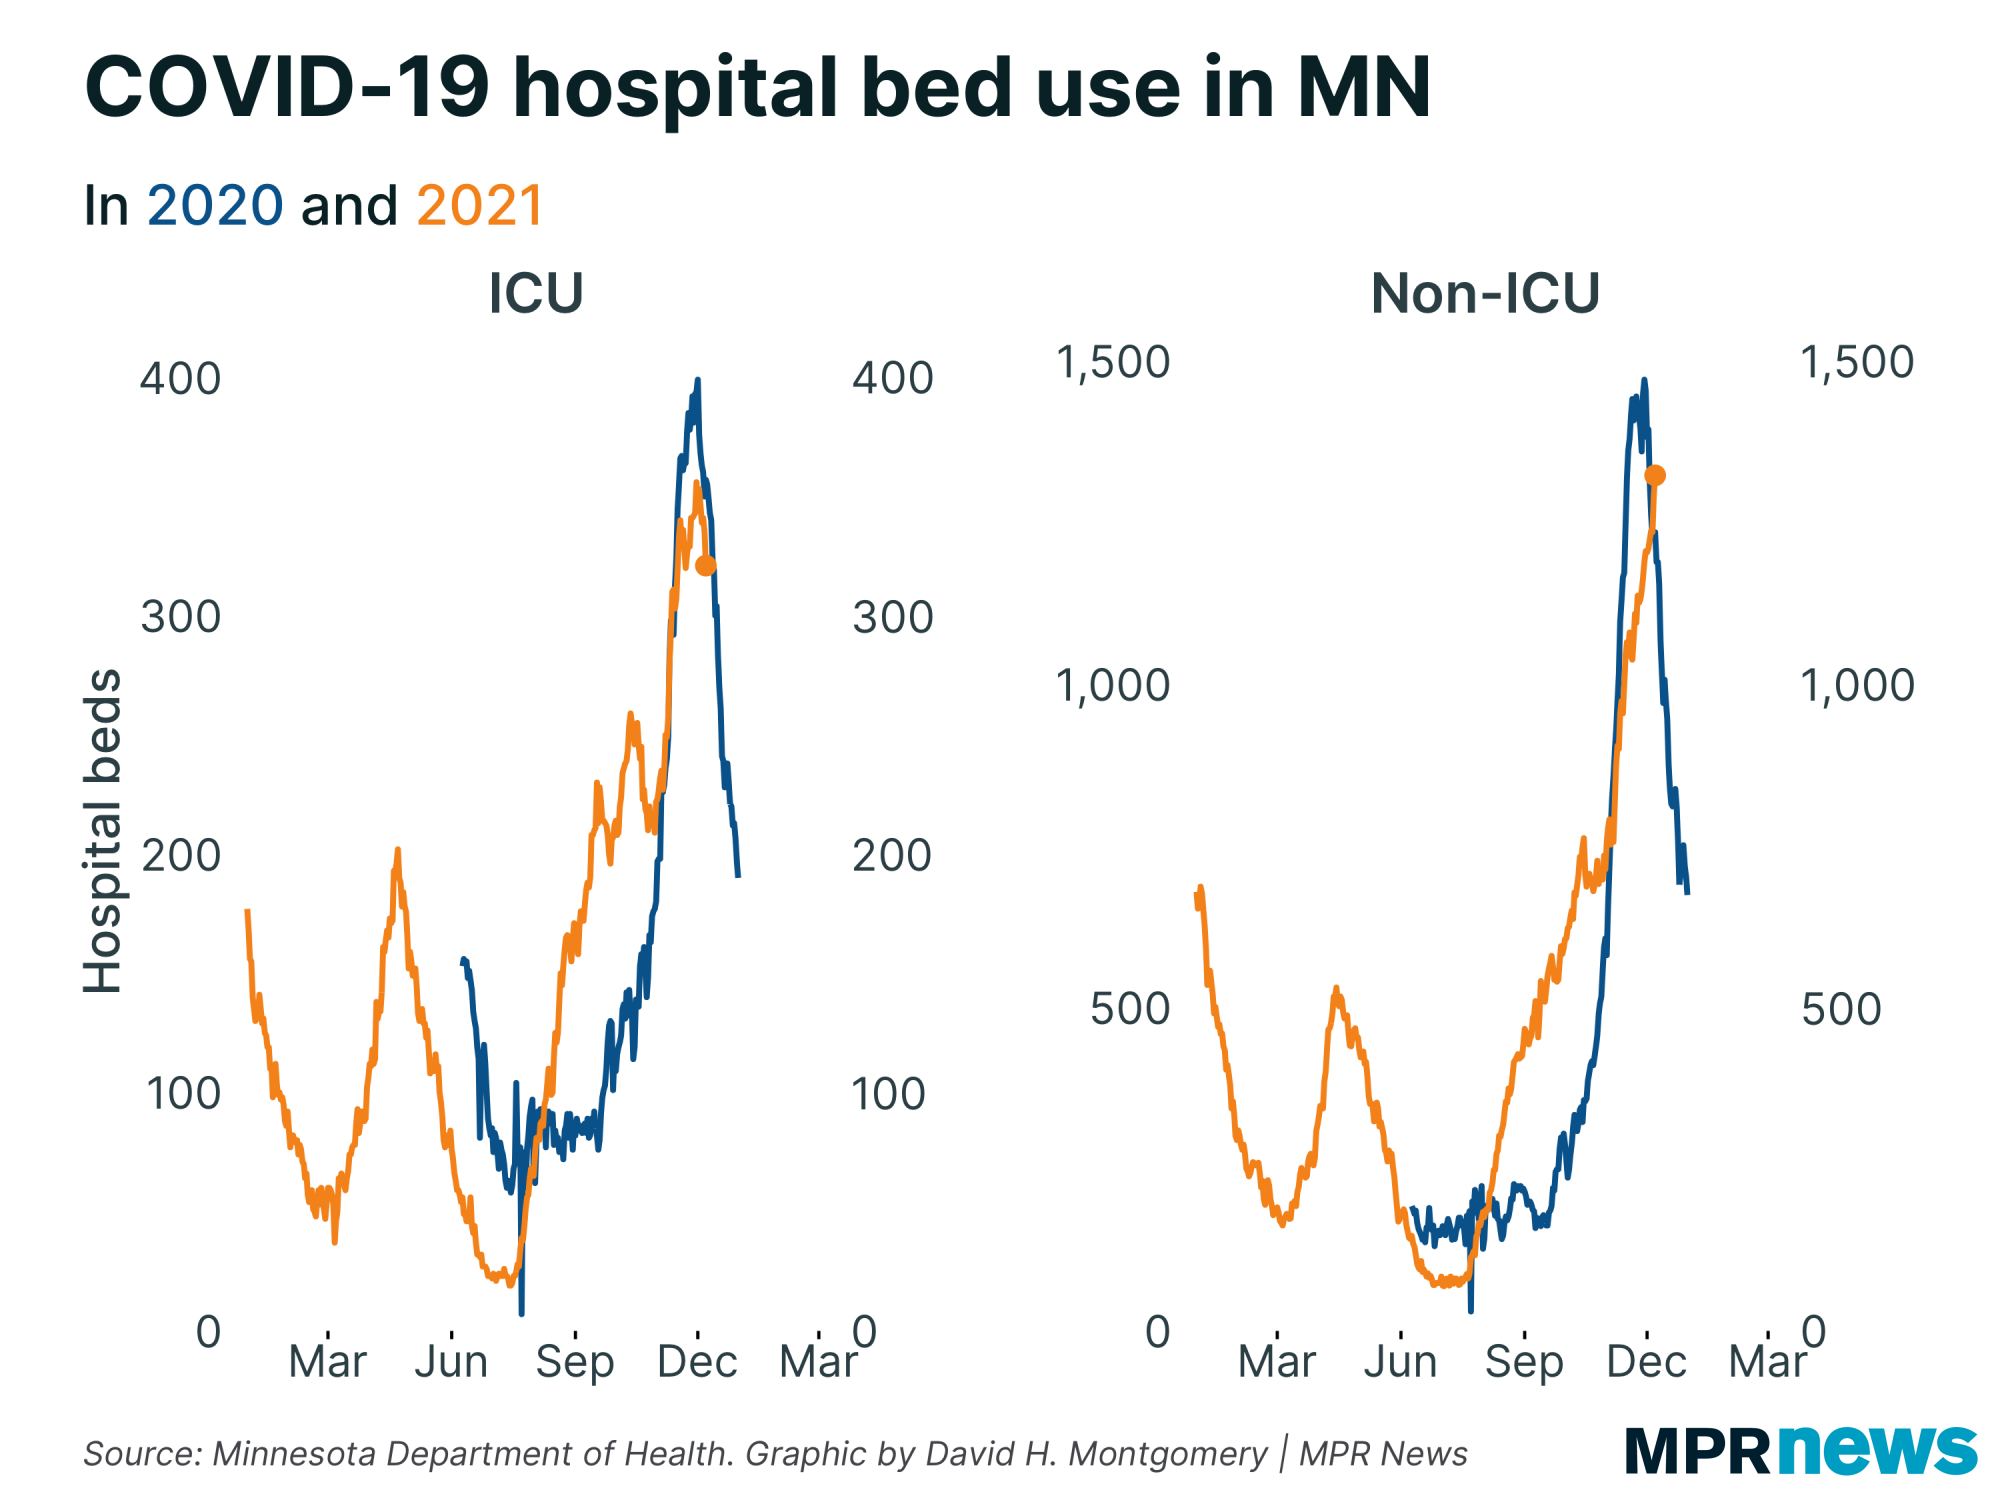
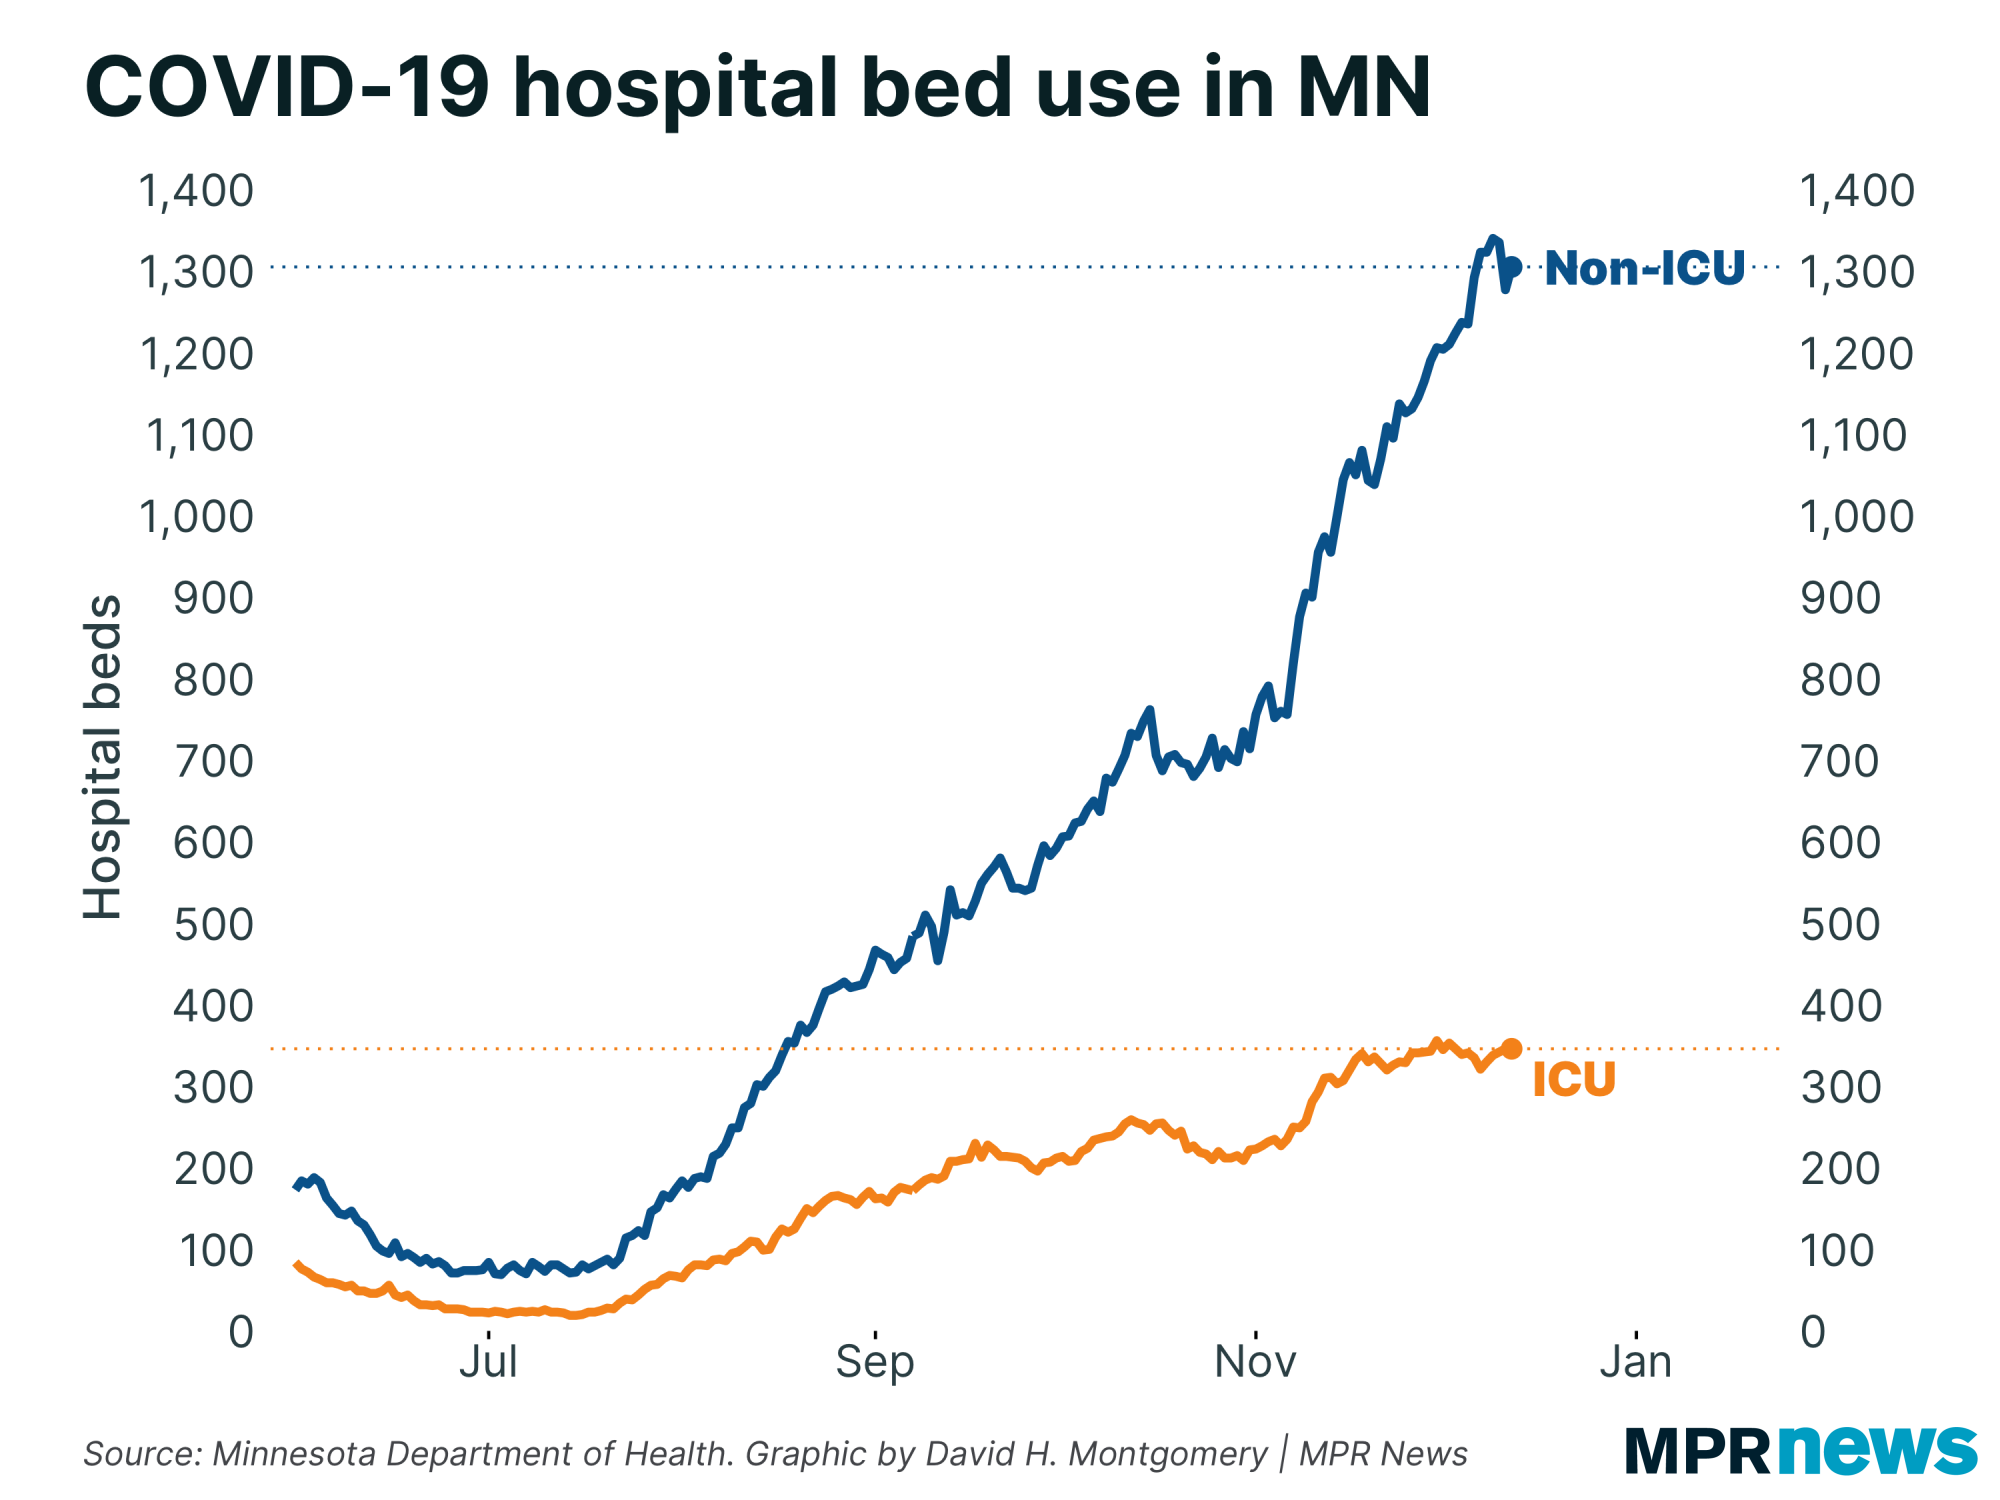
| We're not yet seeing a fall in hospital bed occupancy rates, which remain near 2021 highs. That's not too surprising — most hospitalized COVID patients stay in the hospital for days or weeks, so we'd expect bed use figures to lag behind admissions by at least a few days. But this is the really serious stat — the one that's putting pressure and stress on hospital workers, leading important medical procedures to be postponed, and for ICU cases, at least, threatening death. |
| |
|
|
| Those death rates have actually fallen a bit, but while every death skipped or postponed is worth celebrating, I don't feel like we're out of the woods yet here. Cases only recently began to decline, and death rates usually lag case counts by a month or so. If anything, the current decline in deaths might reflect the case decline we saw right before Thanksgiving — implying that we're due for another spike lasting a week or two before a hopefully final peak. |
| |
|
|
Looking back on two years of COVID deaths
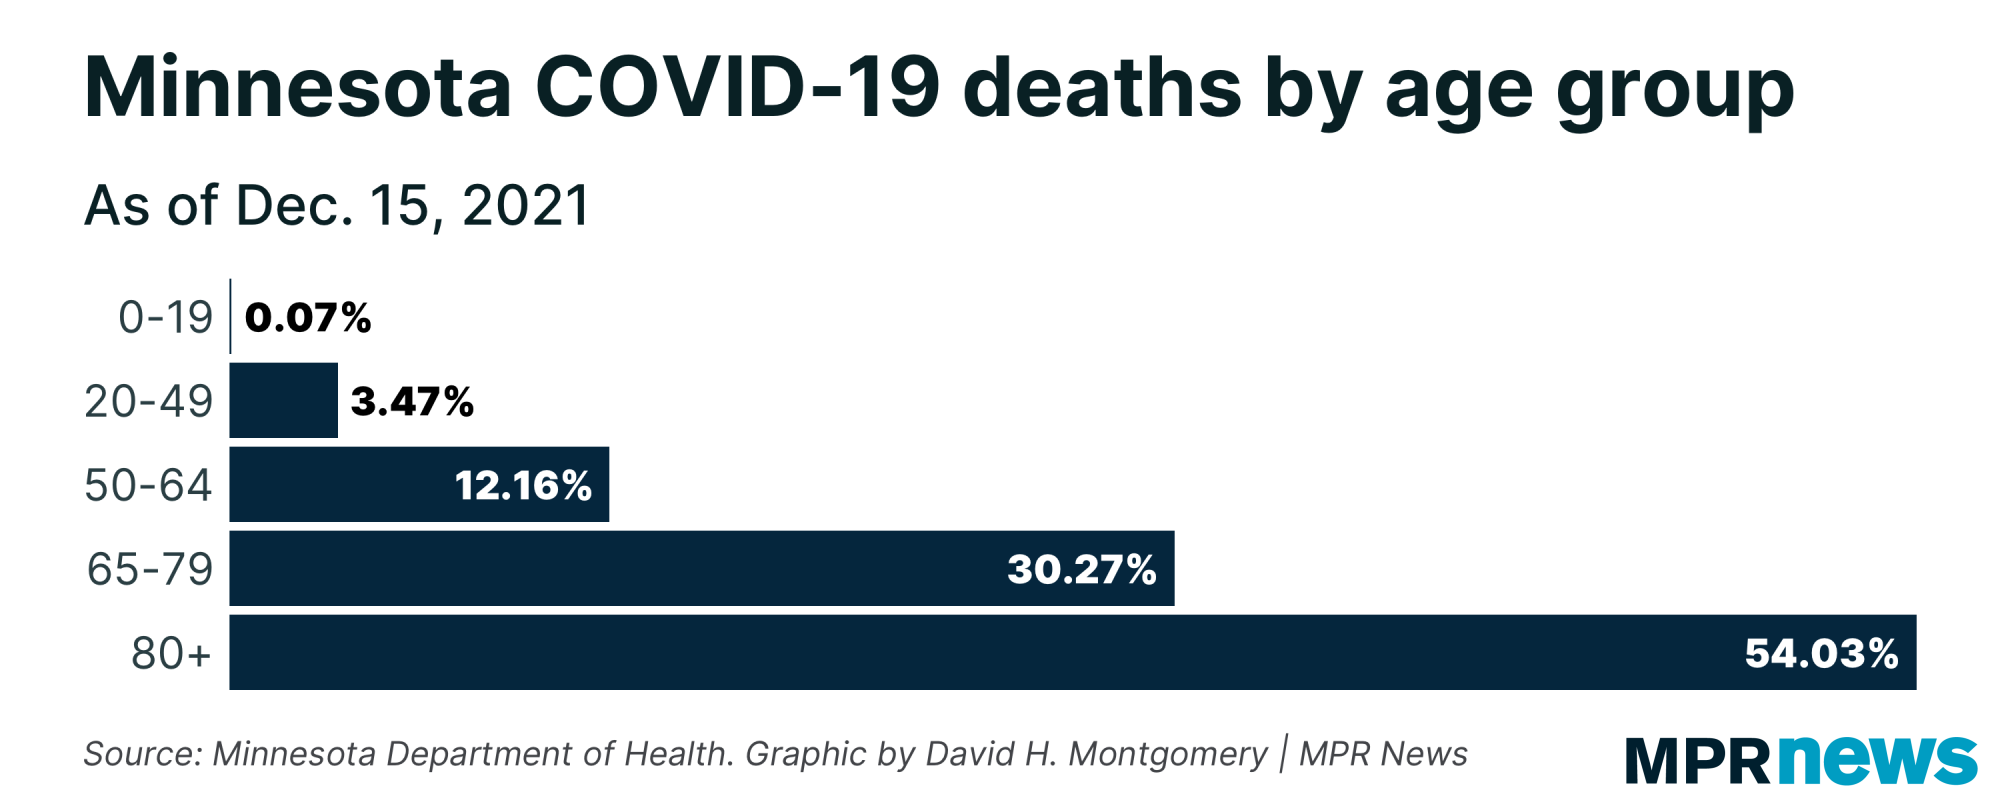
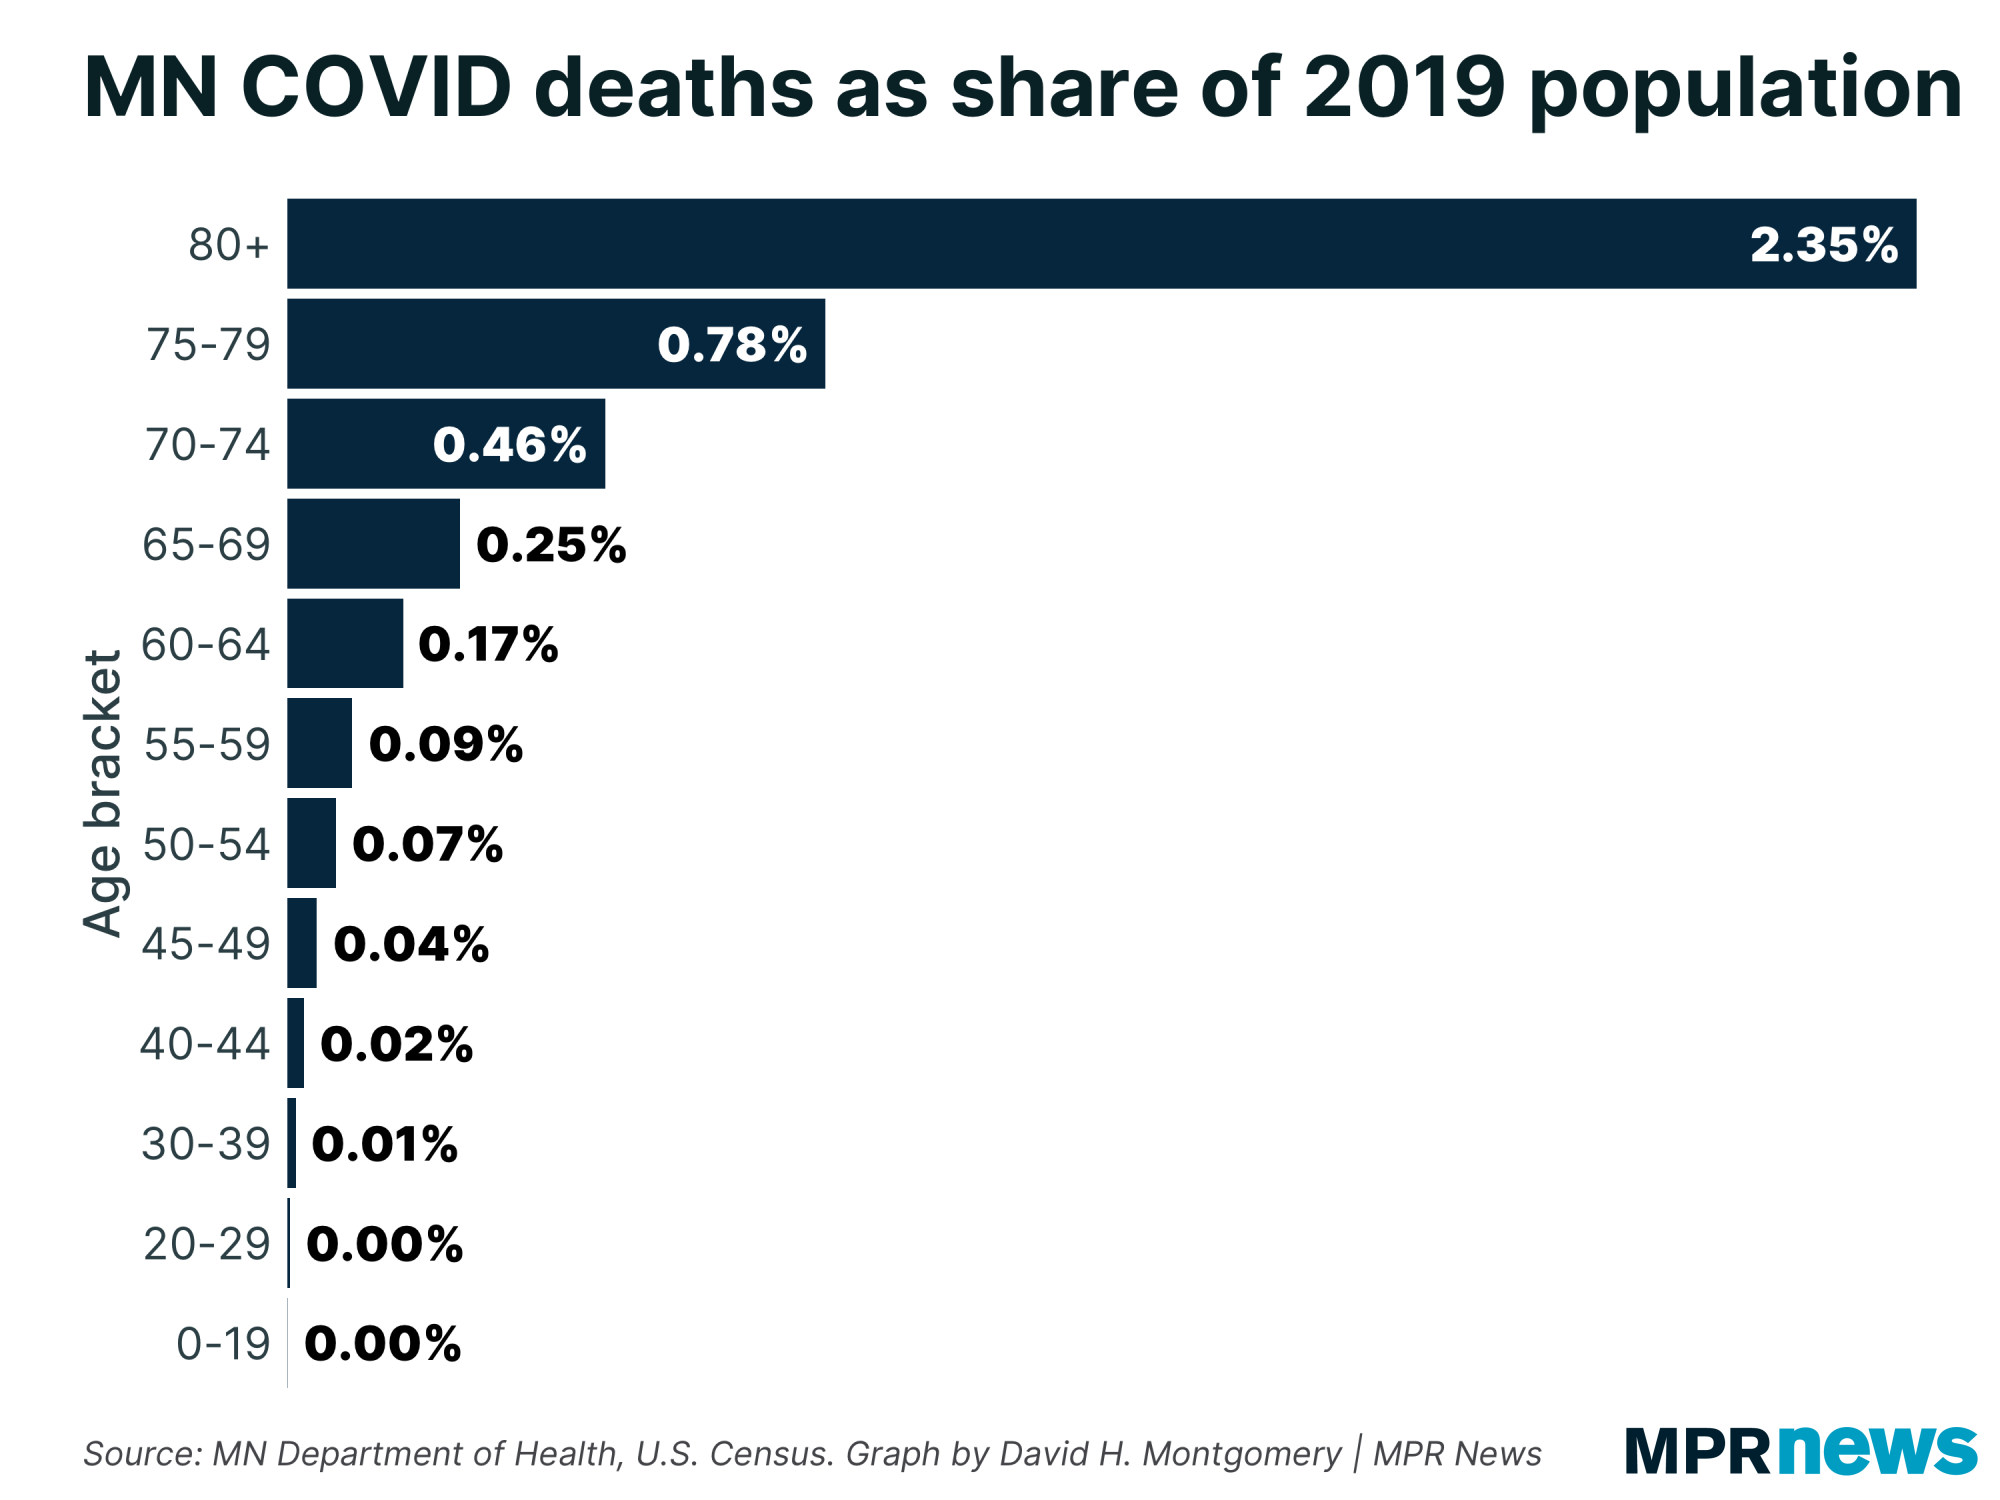
| | The most striking feature of those 10,000 COVID-19 deaths, of course, is how old they are. More than half of Minnesota's COVID-19 deaths to date have been older than 80, and another 30 percent are 65 to 79. Only about 15 percent have been under 65, and most of those were over 50. |
| |
|
|
That's not to say younger people are totally safe from COVID-19. There have been many instances of young people suffering serious cases, as well as the worrisome "long COVID" phenomenon. Seven of those 10,000 deaths have been people under 20, with three under 10 and one under 5.
But the greatest risk, by far, has been to the elderly.
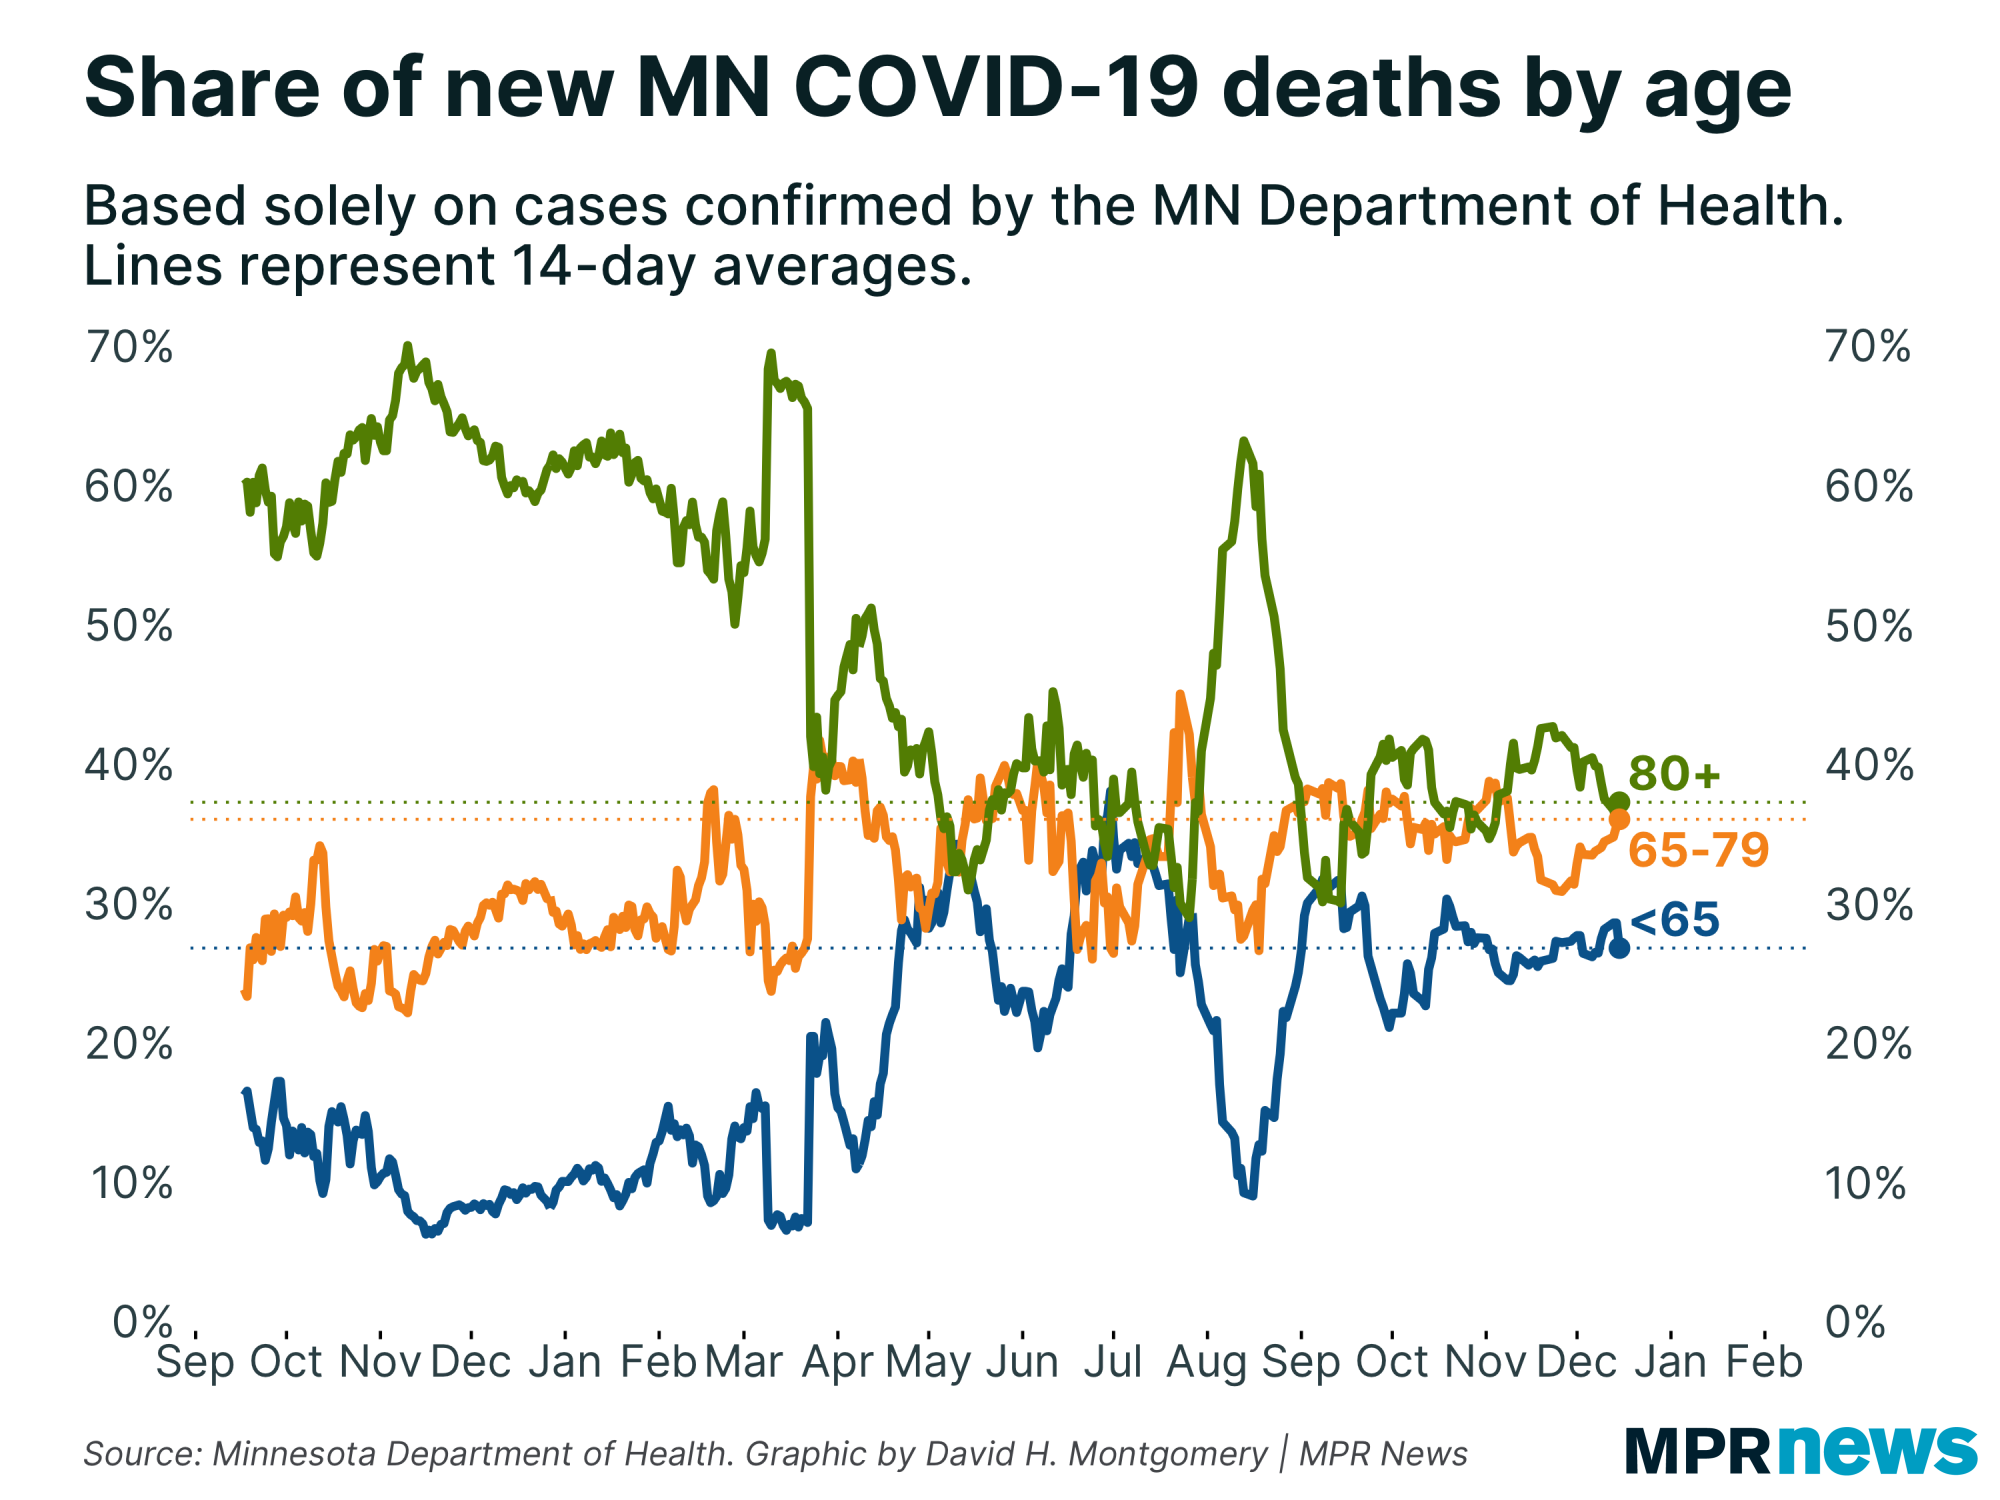
That's even true in the past year, when almost all Minnesota seniors have gotten vaccinated. But the balance has changed a bit. At this time last year, about 60 percent of all COVID deaths were over 80, 30 percent 65-79, and 10 percent under 65. Recently, however, those 80+ represent closer to 60 percent of deaths, while those under 65 (mostly people 50-64) are more than 25 percent . |
| |
|
|
| If you take these death totals and divide them by Minnesota's 2019 population breakdowns, we can estimate that somewhere above 2 percent of Minnesotans 80 or older have died of COVID-19 since the pandemic began, and just under 1 percent of Minnesotans 65+. The death rates per capita fall off dramatically as you get younger. | |
|
|
|
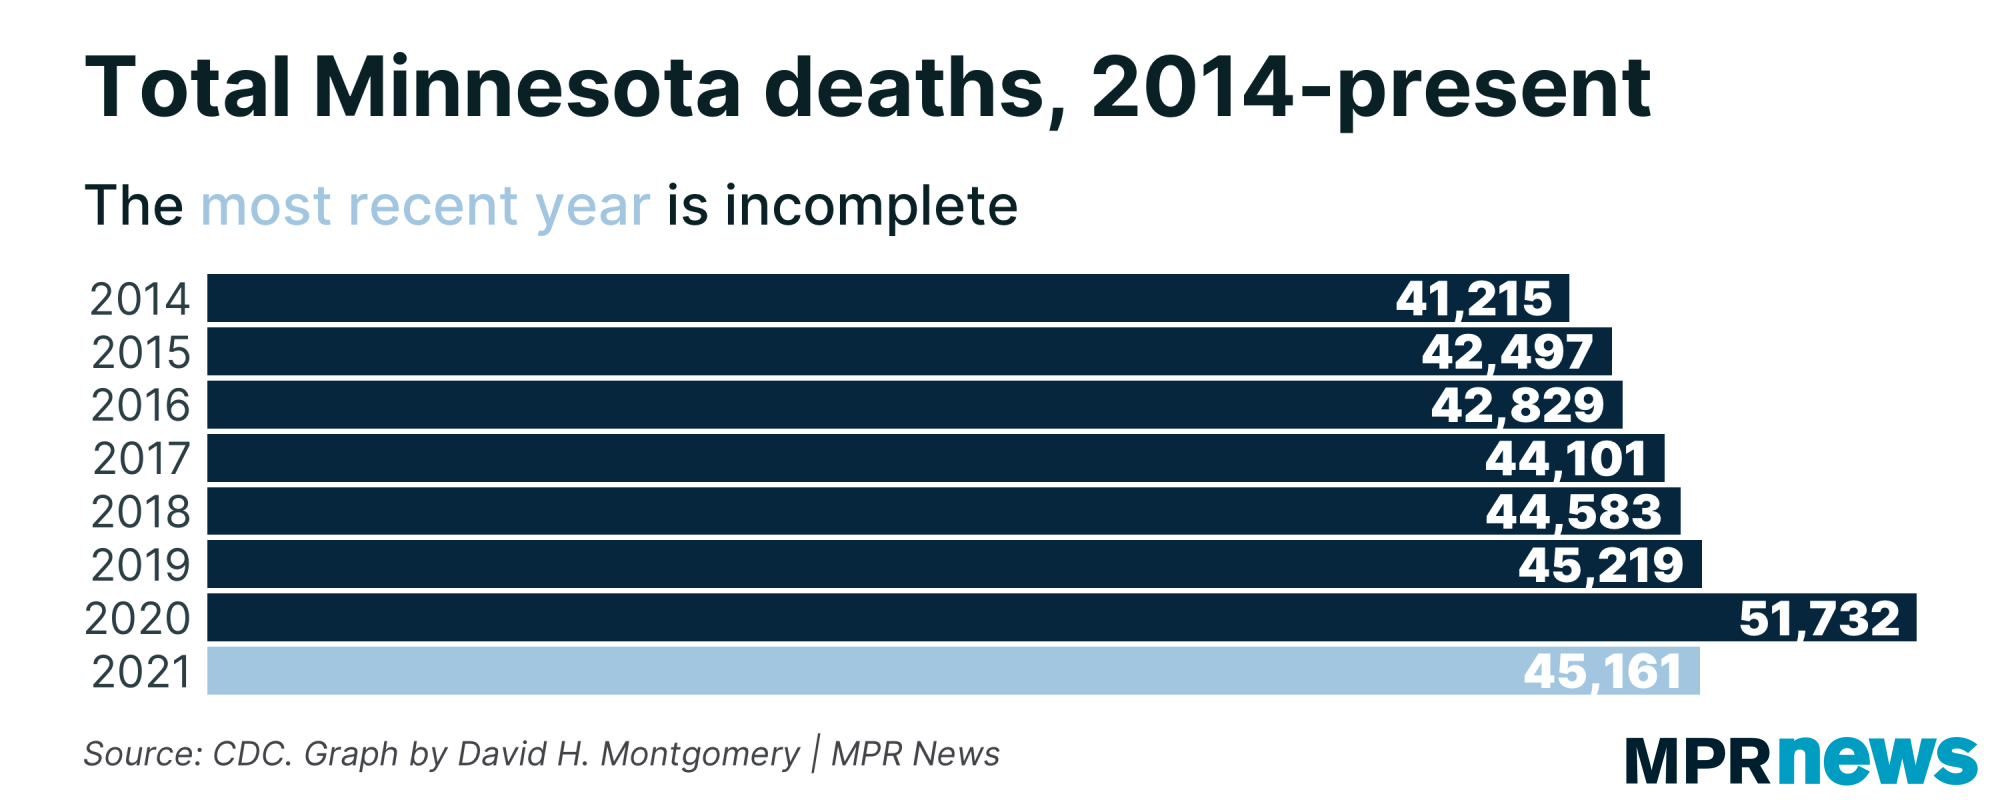
The big picture: The last two years have been among the deadliest in recent memory.
In 2019, Minnesota saw around 45,000 deaths from all causes combined, which was a slight increase on about 44,500 the year before, which was a slight increase on around 44,100 the year before that, and so on.
2020 saw nearly 52,000 total deaths in Minnesota — a huge spike. The 2021 totals are still incomplete. We have good death data through about early November right now but are already even with the full 2019 figures. |
| |
|
|
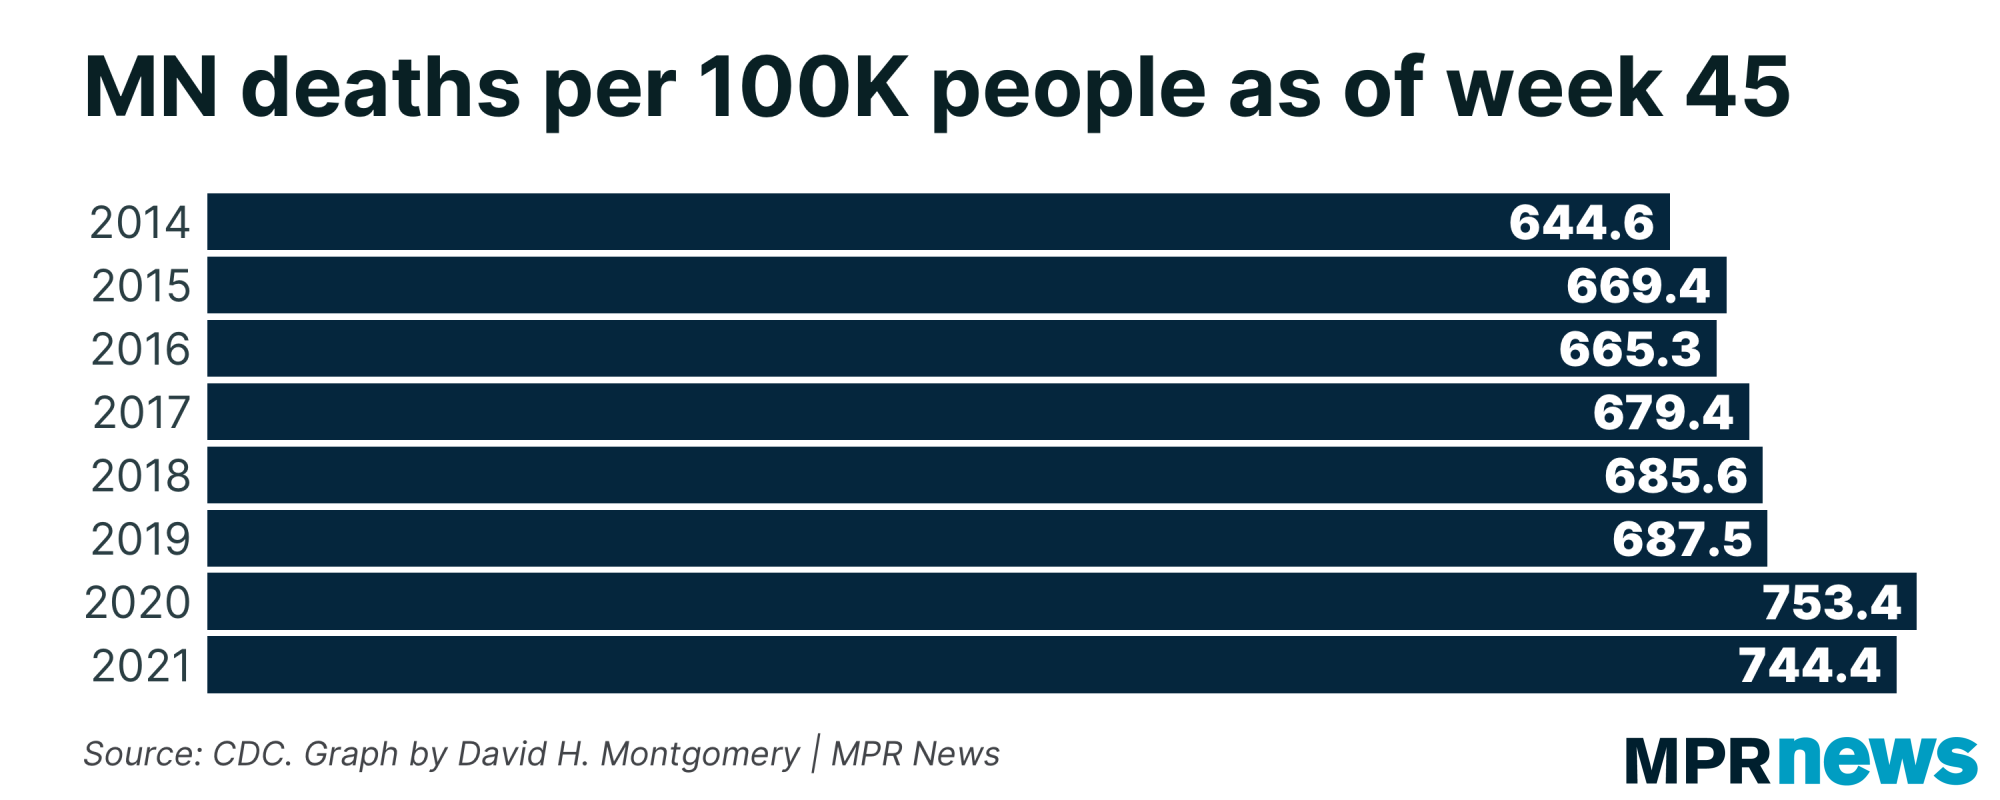
| If you standardize for Minnesota's growing population, and look only at data through this time in past years, you can see that we're on pace to have almost as many total Minnesota deaths in 2021 as 2020. | | |
|
|
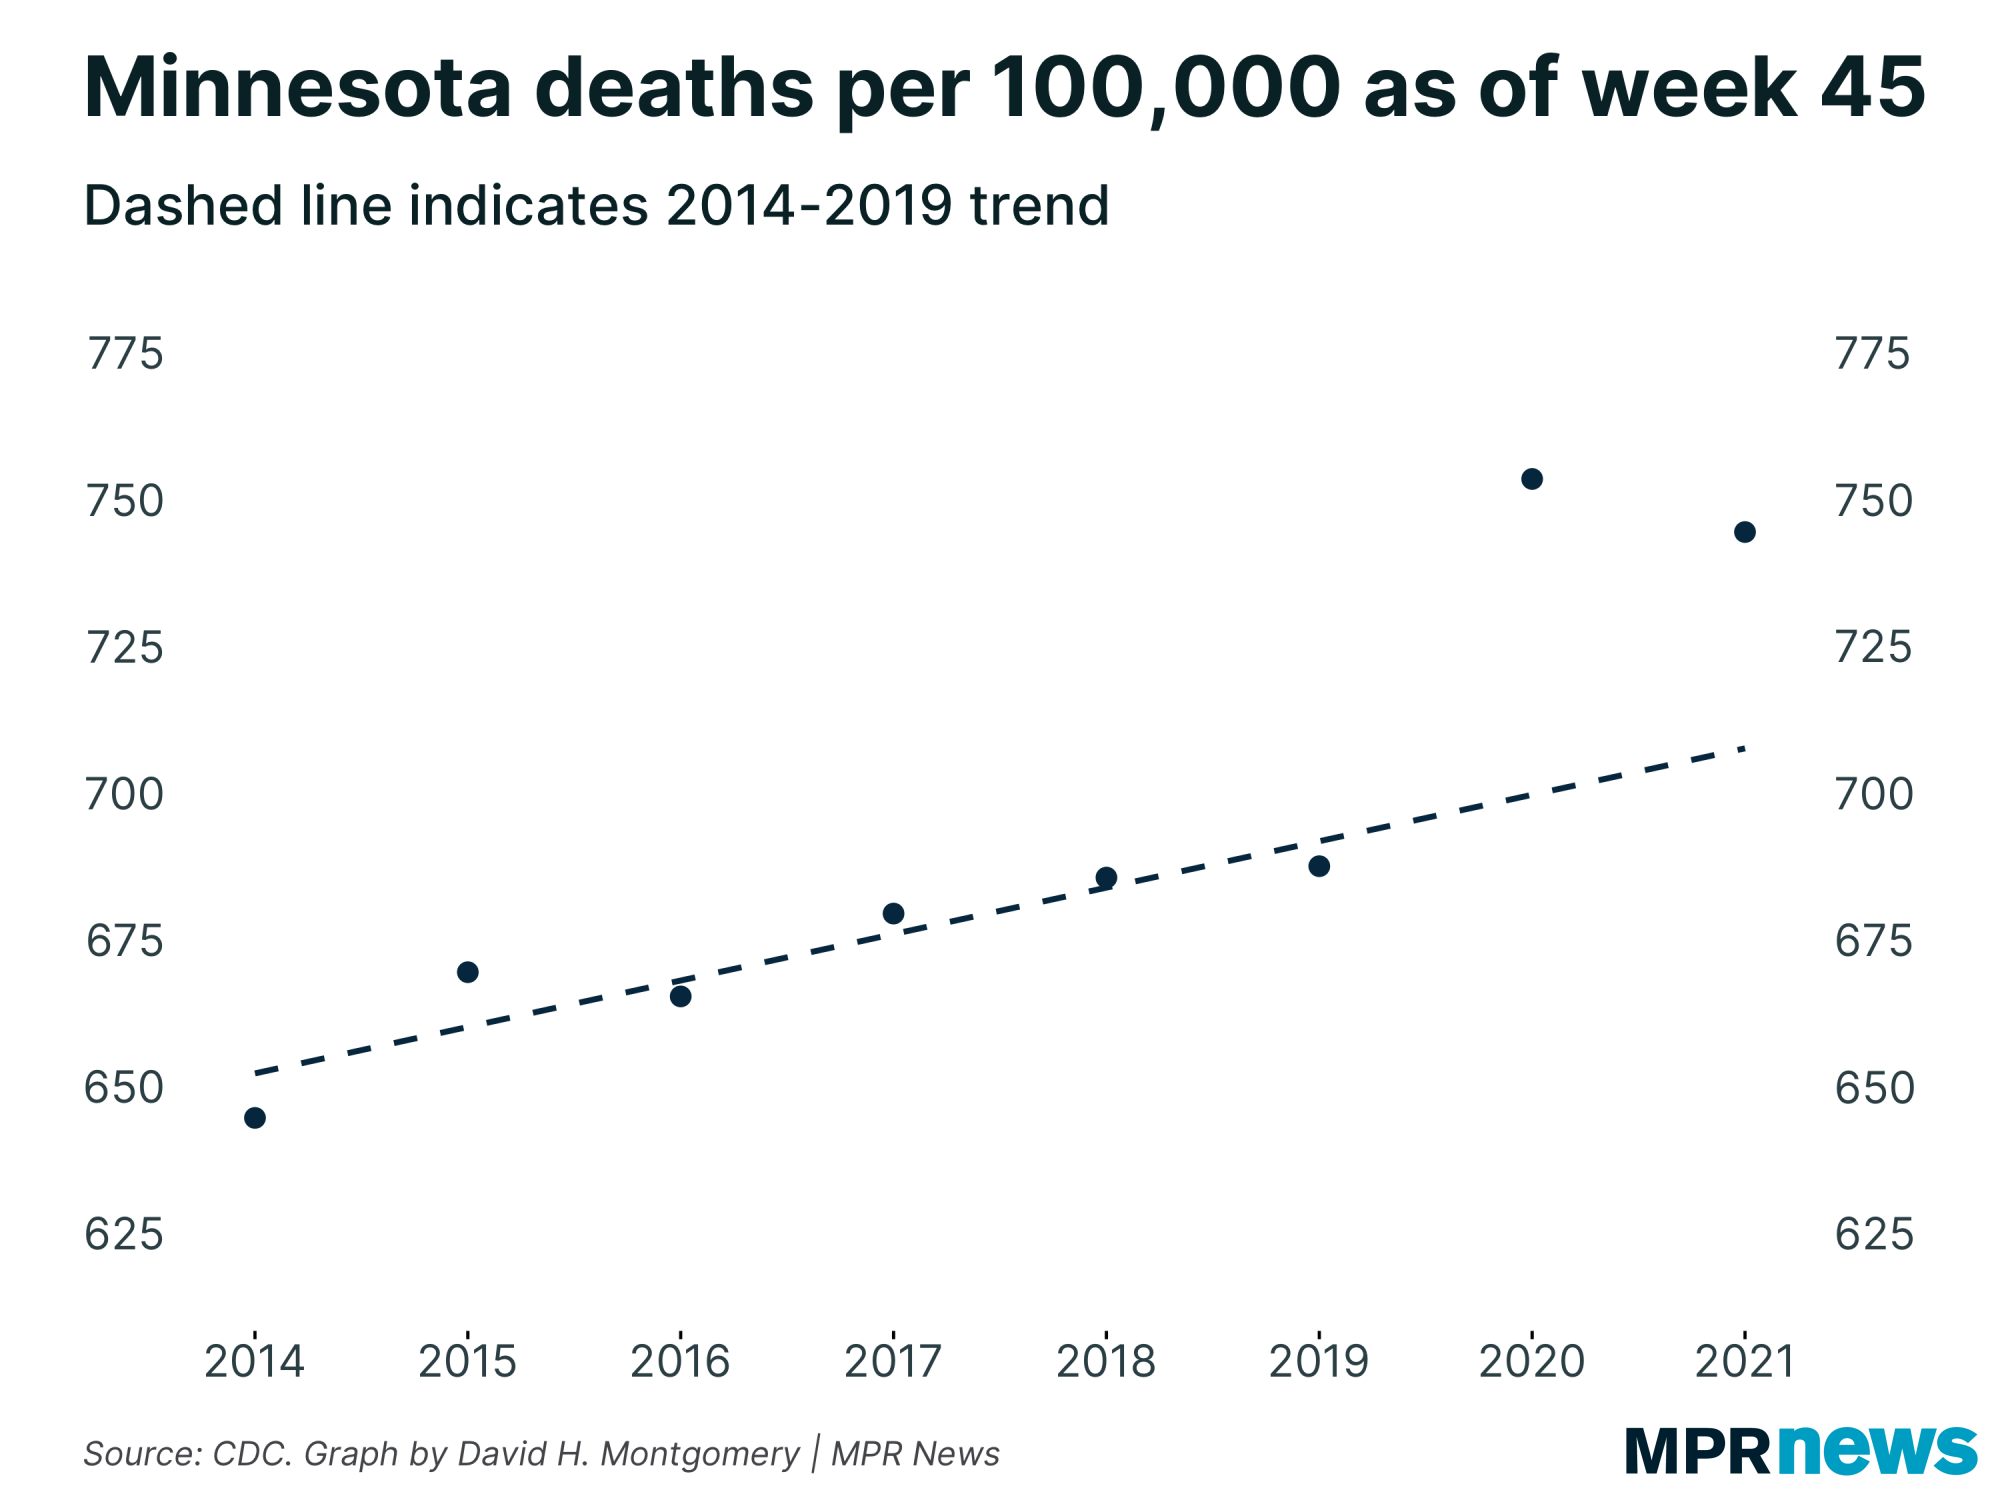
| The last two years are even more of an obvious outlier if you plot it out on a scatterplot with the pre-2020 trend highlighted. | | |
|
|
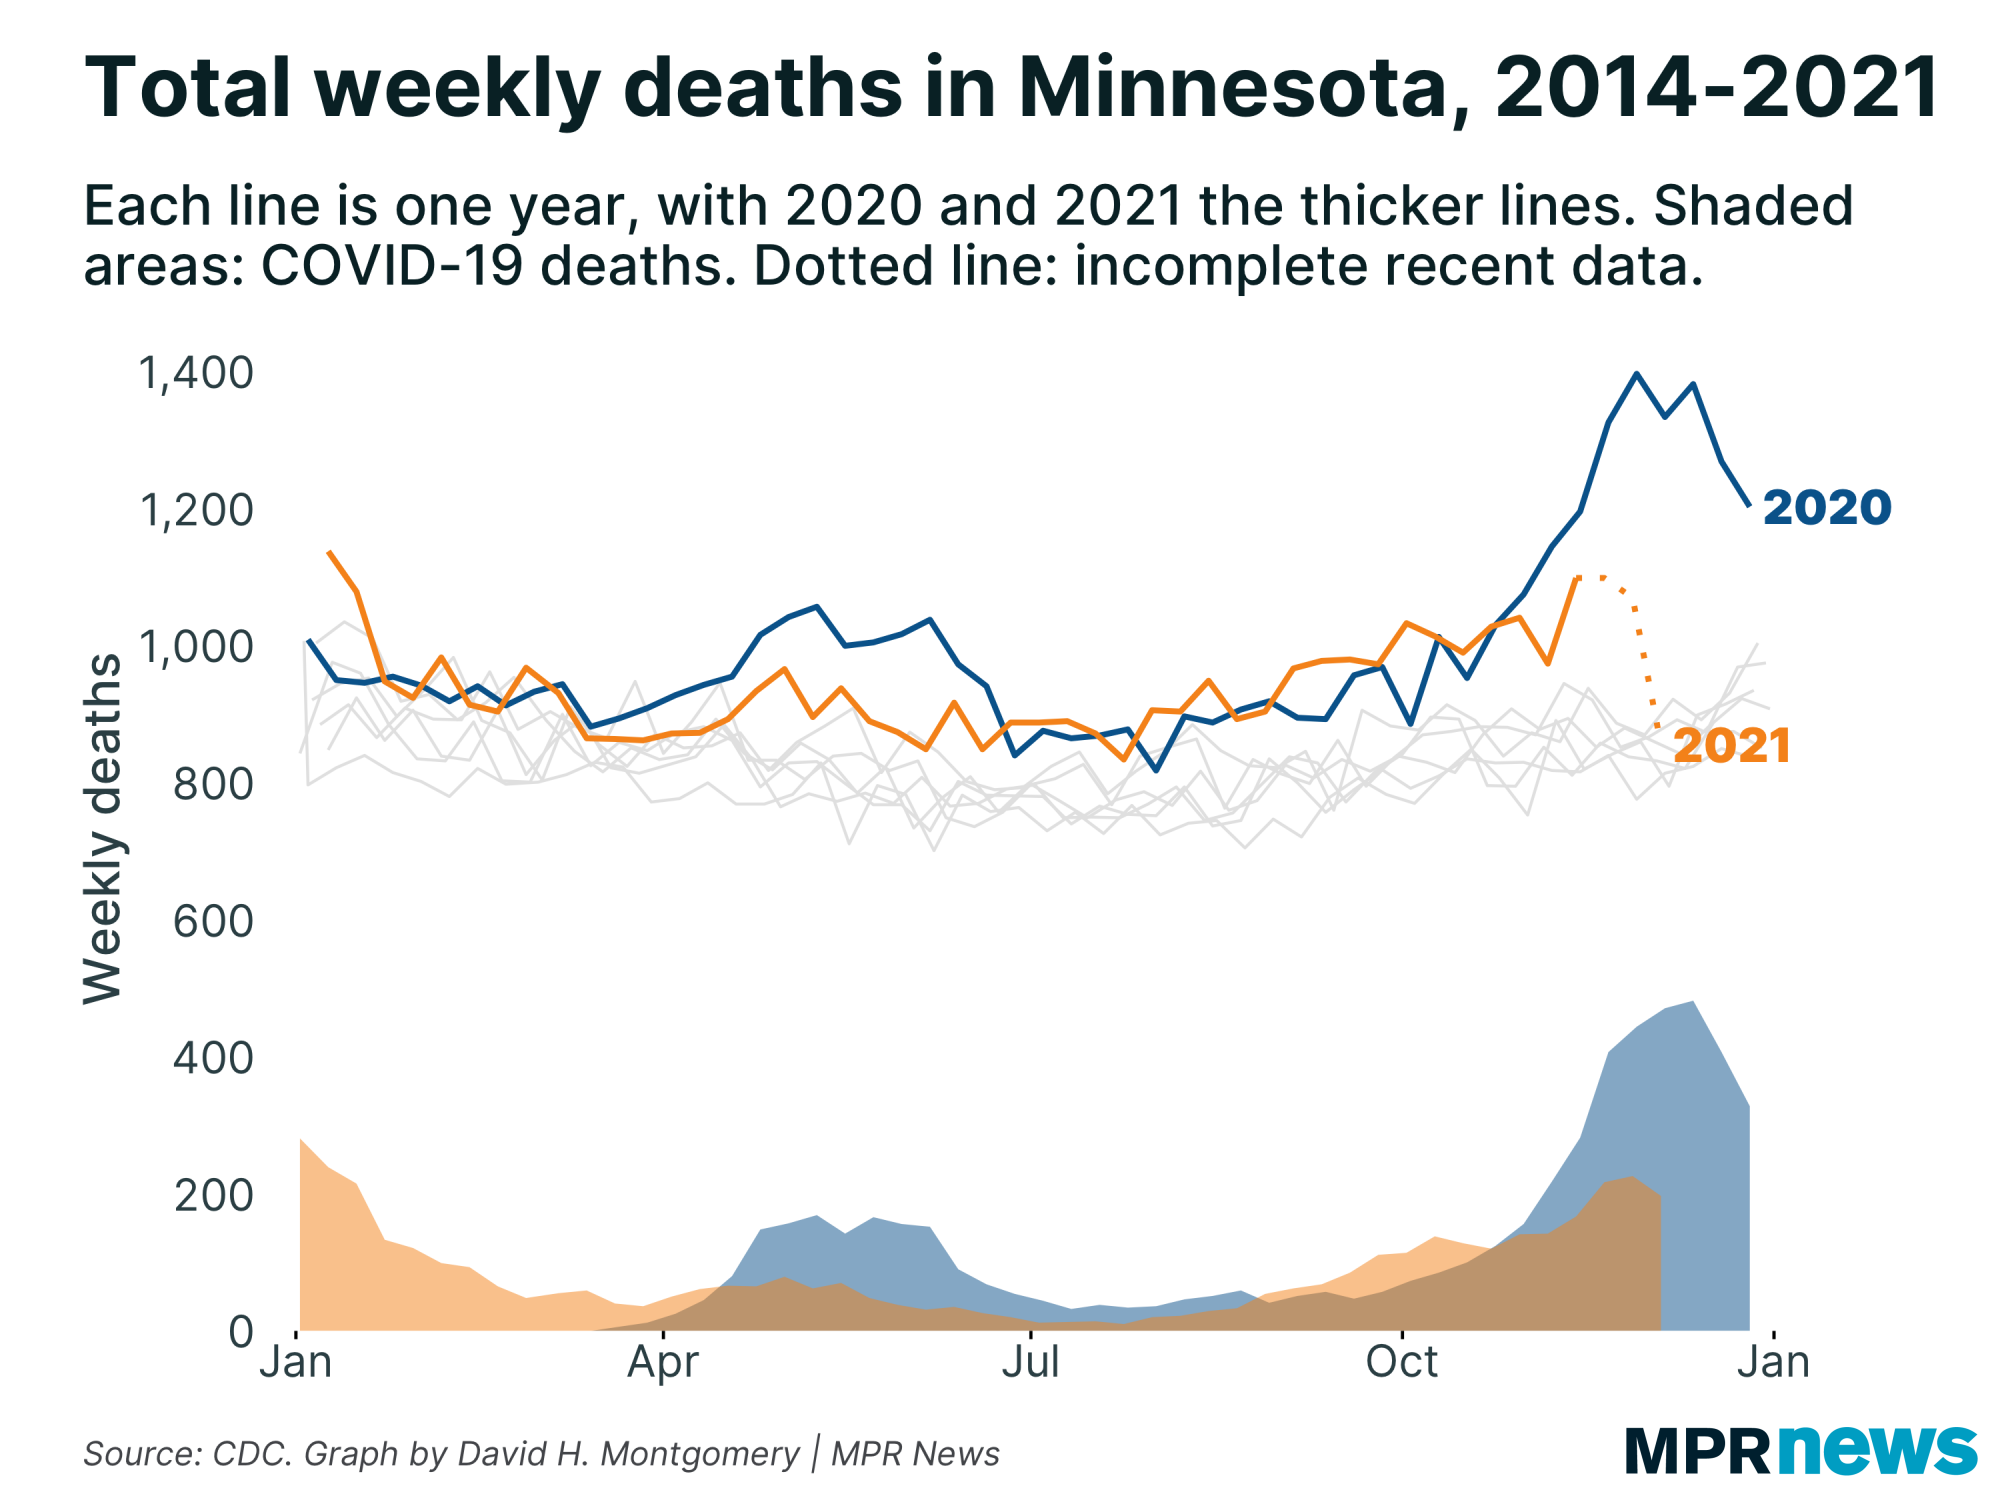
The most striking visual putting all these deaths in context, i think, is to plot the total all-cause deaths over time — and then overlay confirmed COVID-19 deaths.
You can see that 2020 and 2021 are clear standouts from recent history — and that their spikes in total deaths match COVID-19 death waves almost perfectly. | |
|
|
|
| This, more than anything, tells the story of COVID-19 even for someone who doubts all the other statistics and narratives being put out about this pandemic — more people are dying, and these excess deaths match up almost exactly with when lots of people are being reported dead from COVID. | |
|
|
|
Below, I'll explore a few more stats about Minnesota's COVID-19 outbreak. If you want to learn more, I also recommend these other articles:
| | |
|
|
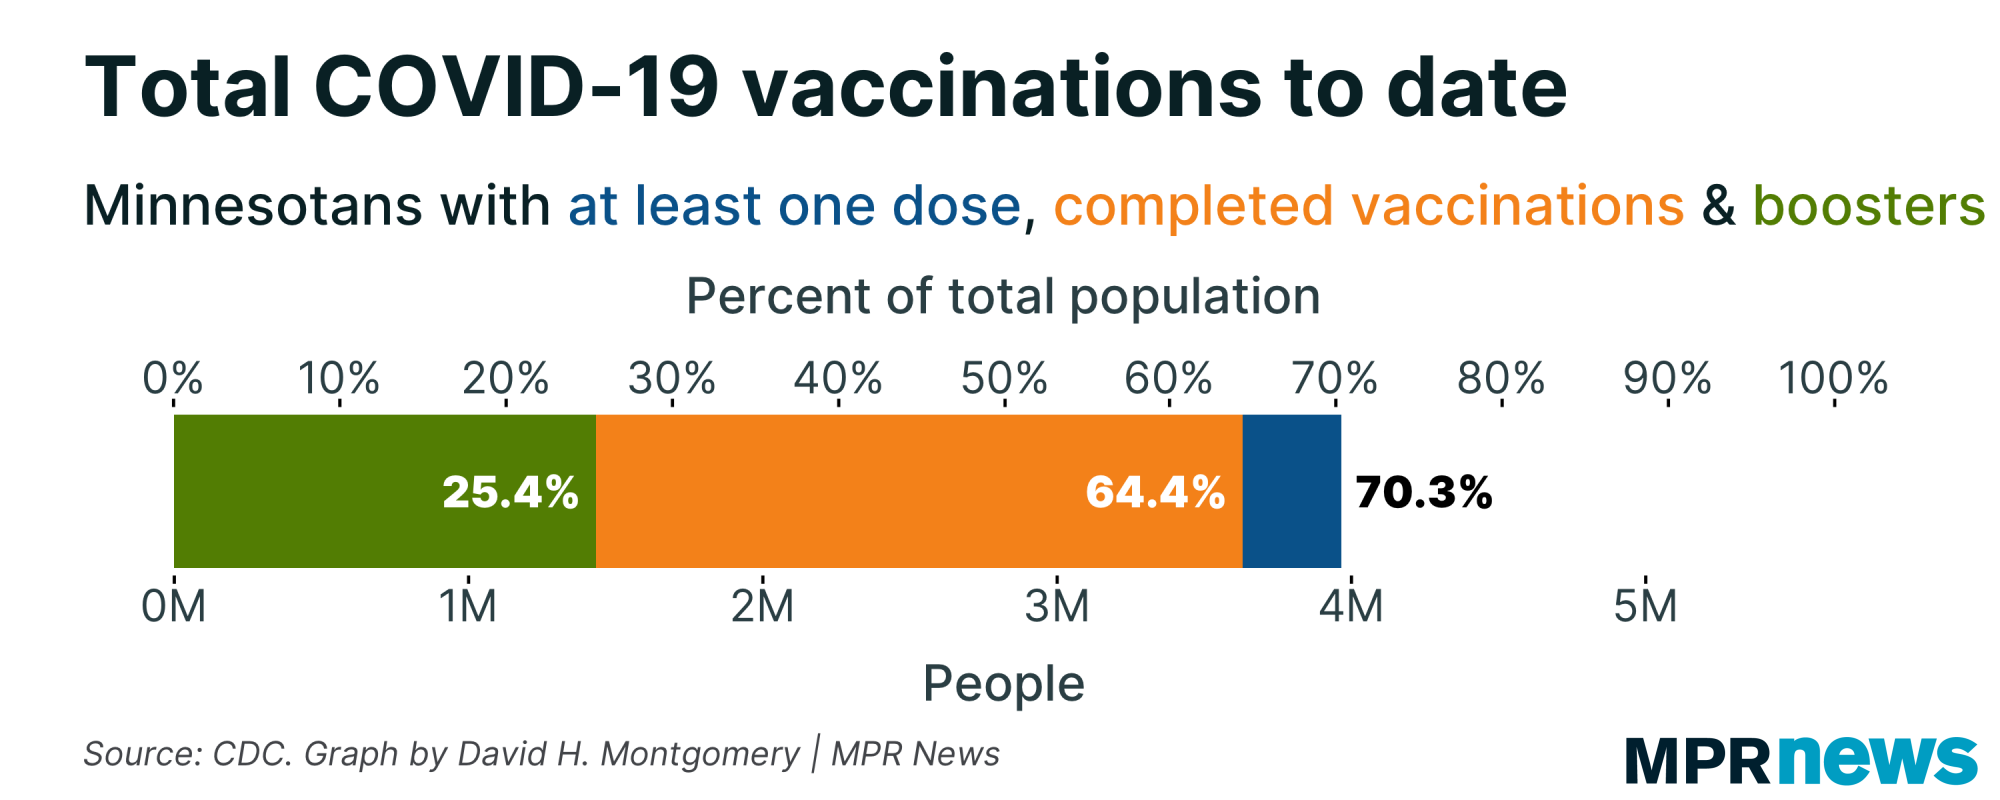
| Initial rushes fade for boosters, 5-11-year-olds | November was a pretty good month for vaccinations in Minnesota, with the most new first doses of any month since May.
This was driven mostly by the expansion of eligibility to a new age group: 5- to 11-year-olds. More than 140,000 kids in this age group have received at least one dose, or just over one-quarter of the population. |
| |
|
|
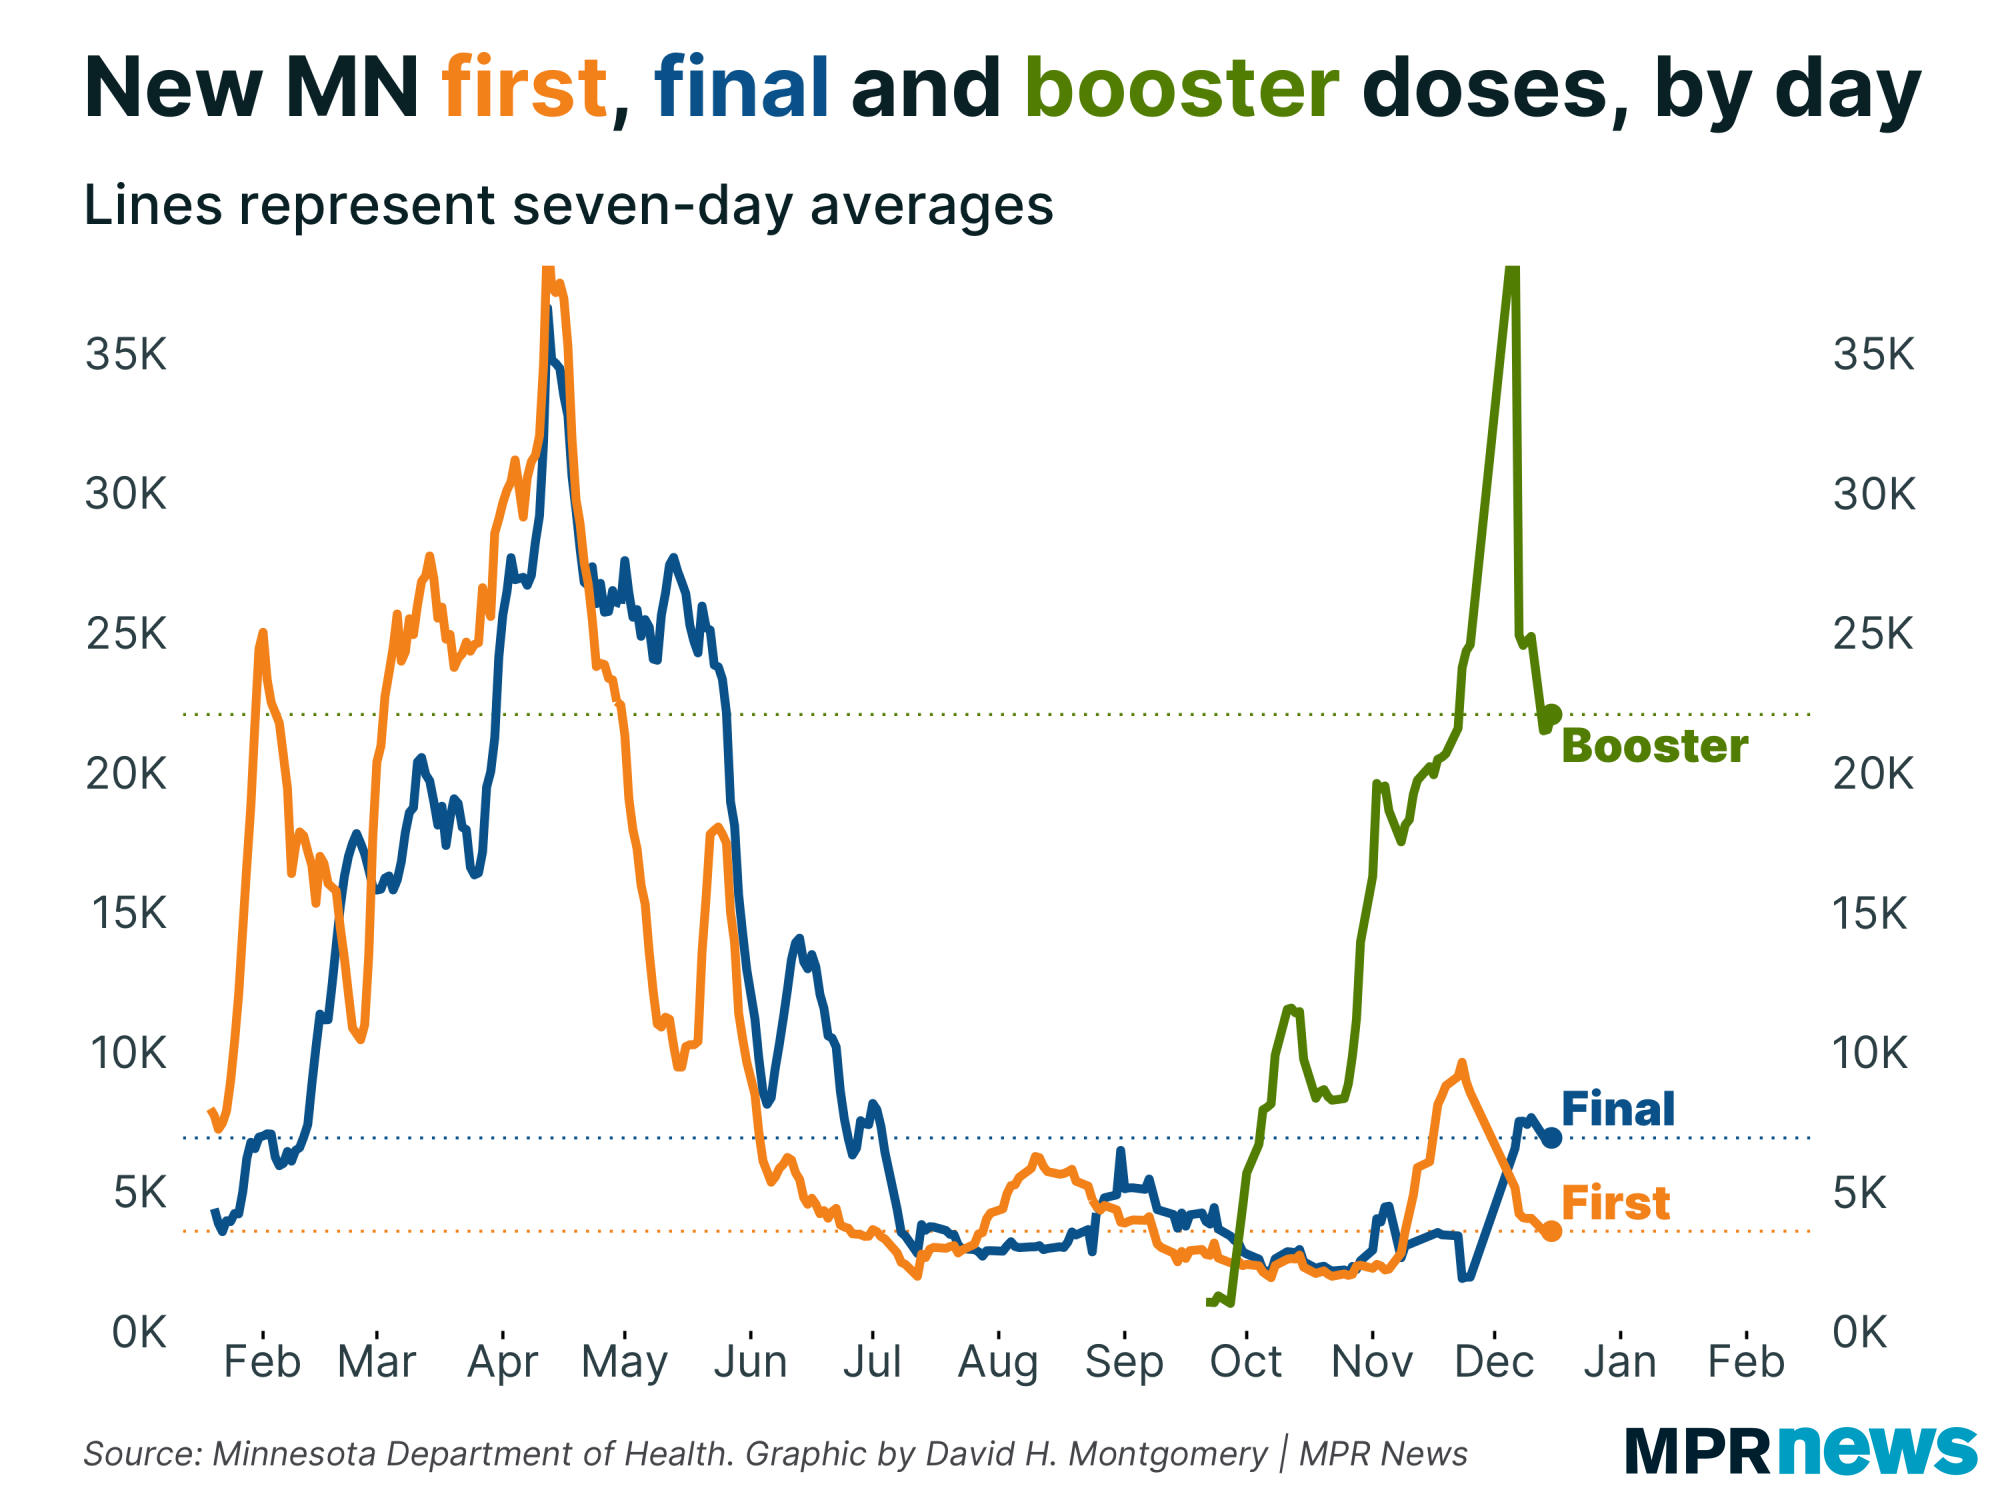
Nearly simultaneously, booster dose eligibility was rolled out to the entire adult population.
As a result, we saw tens of thousands of people getting COVID shots per day for the first time since the spring.
But that initial rush has peaked and declined, both for first doses and boosters. We've even seen the echo-wave of second doses peak. |
| |
|
|
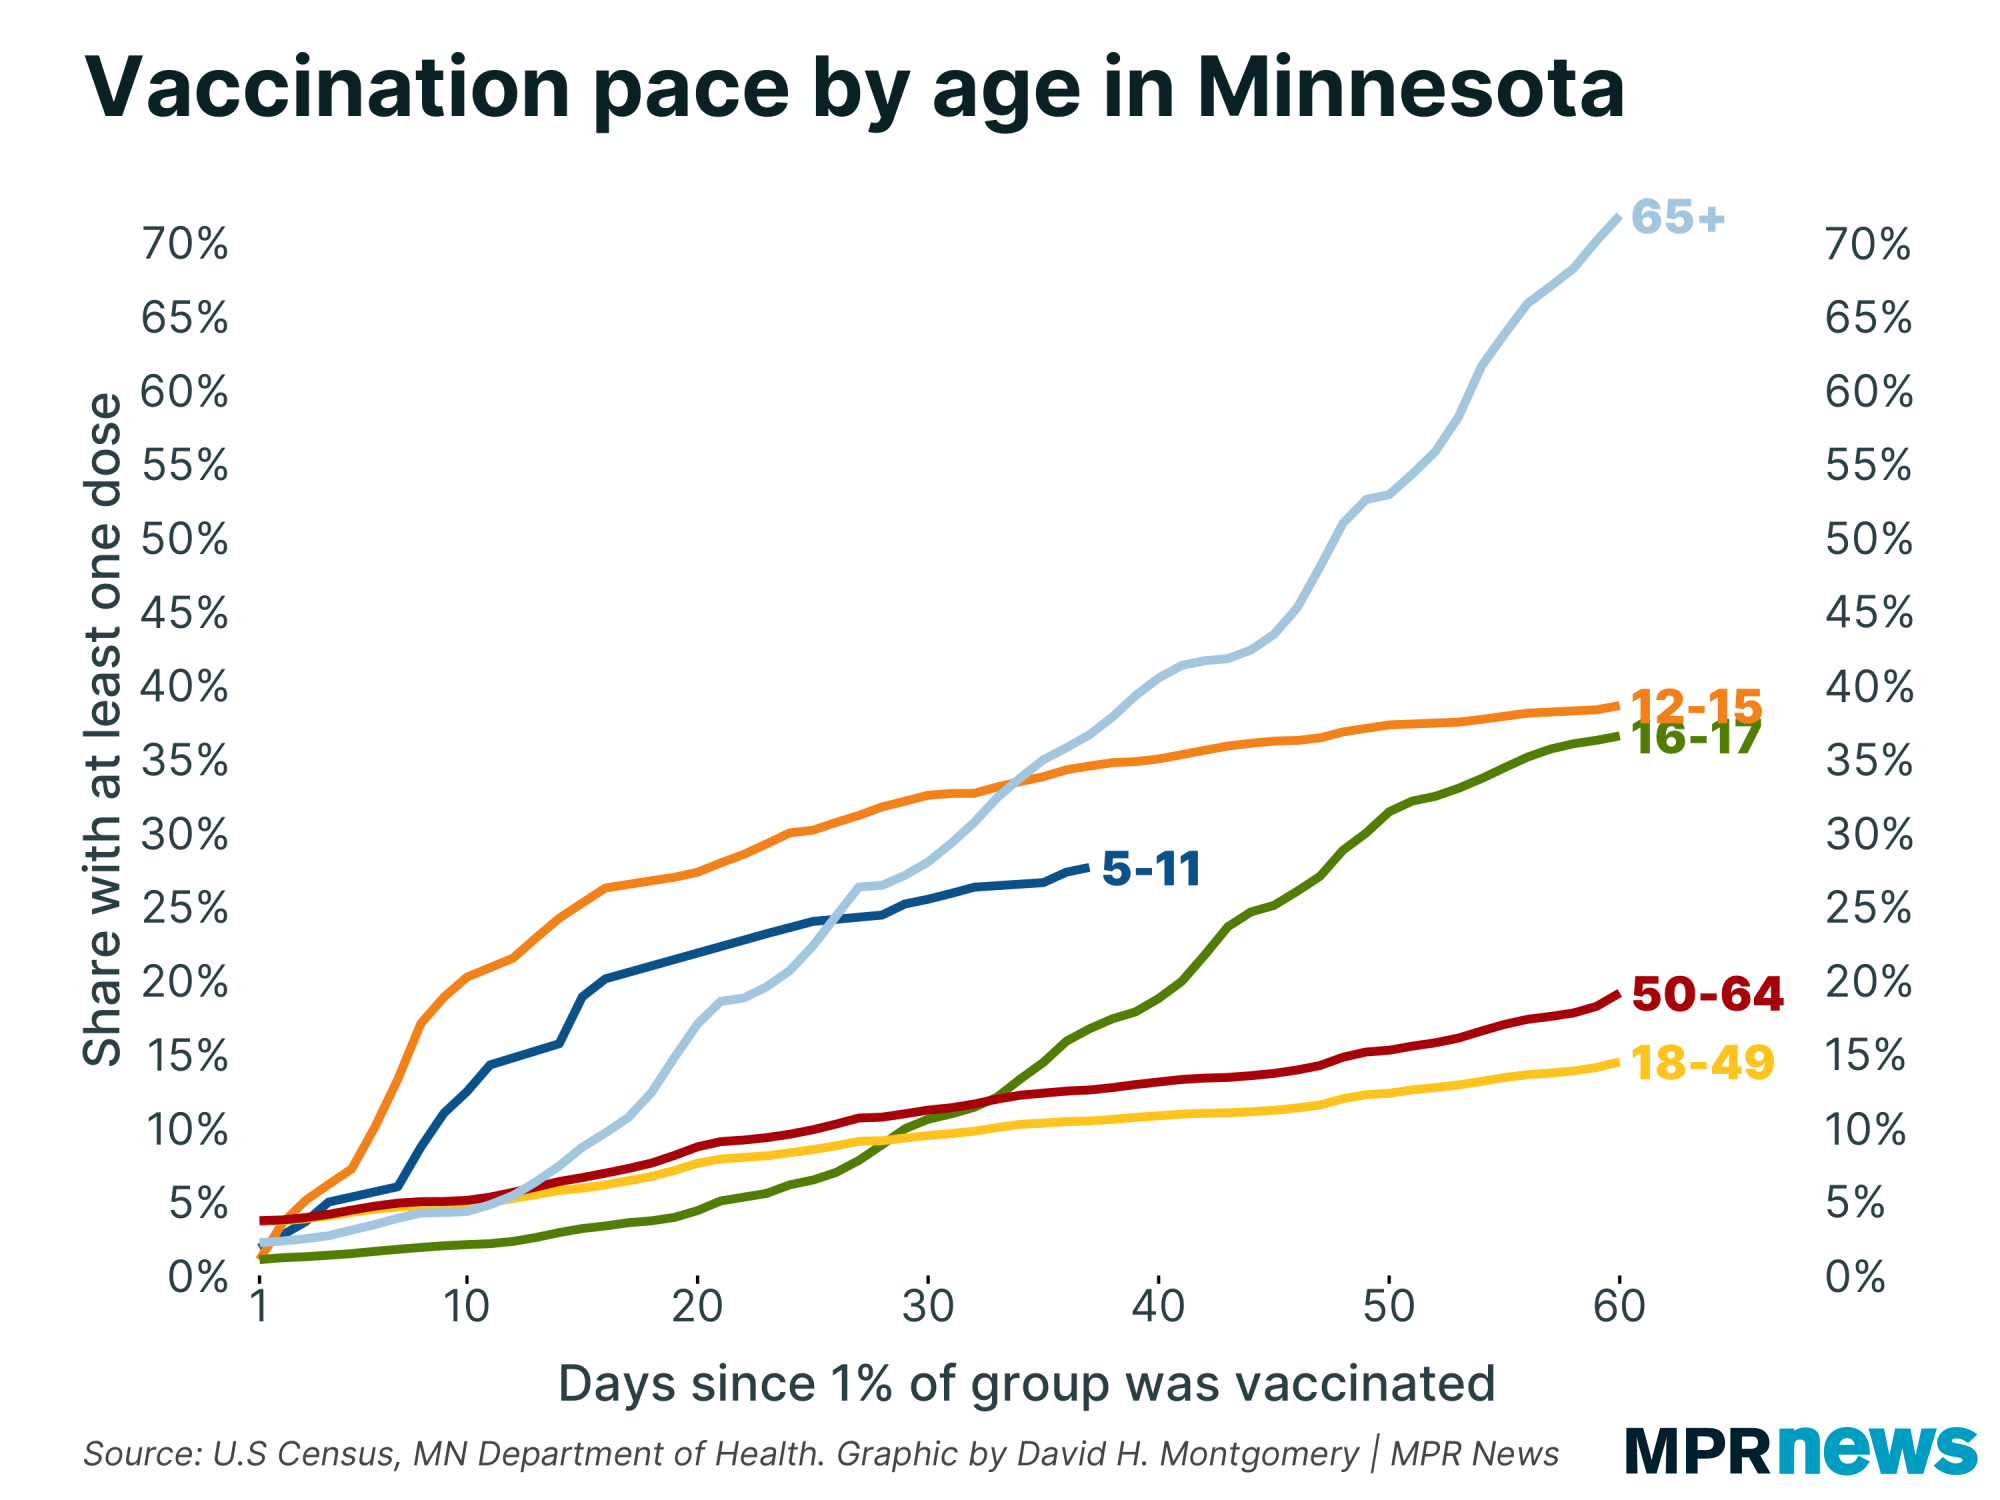
| Kids 5-11 are following a similar trajectory to when kids 12-15 became eligible — just a little bit slower across the board. | | |
|
|
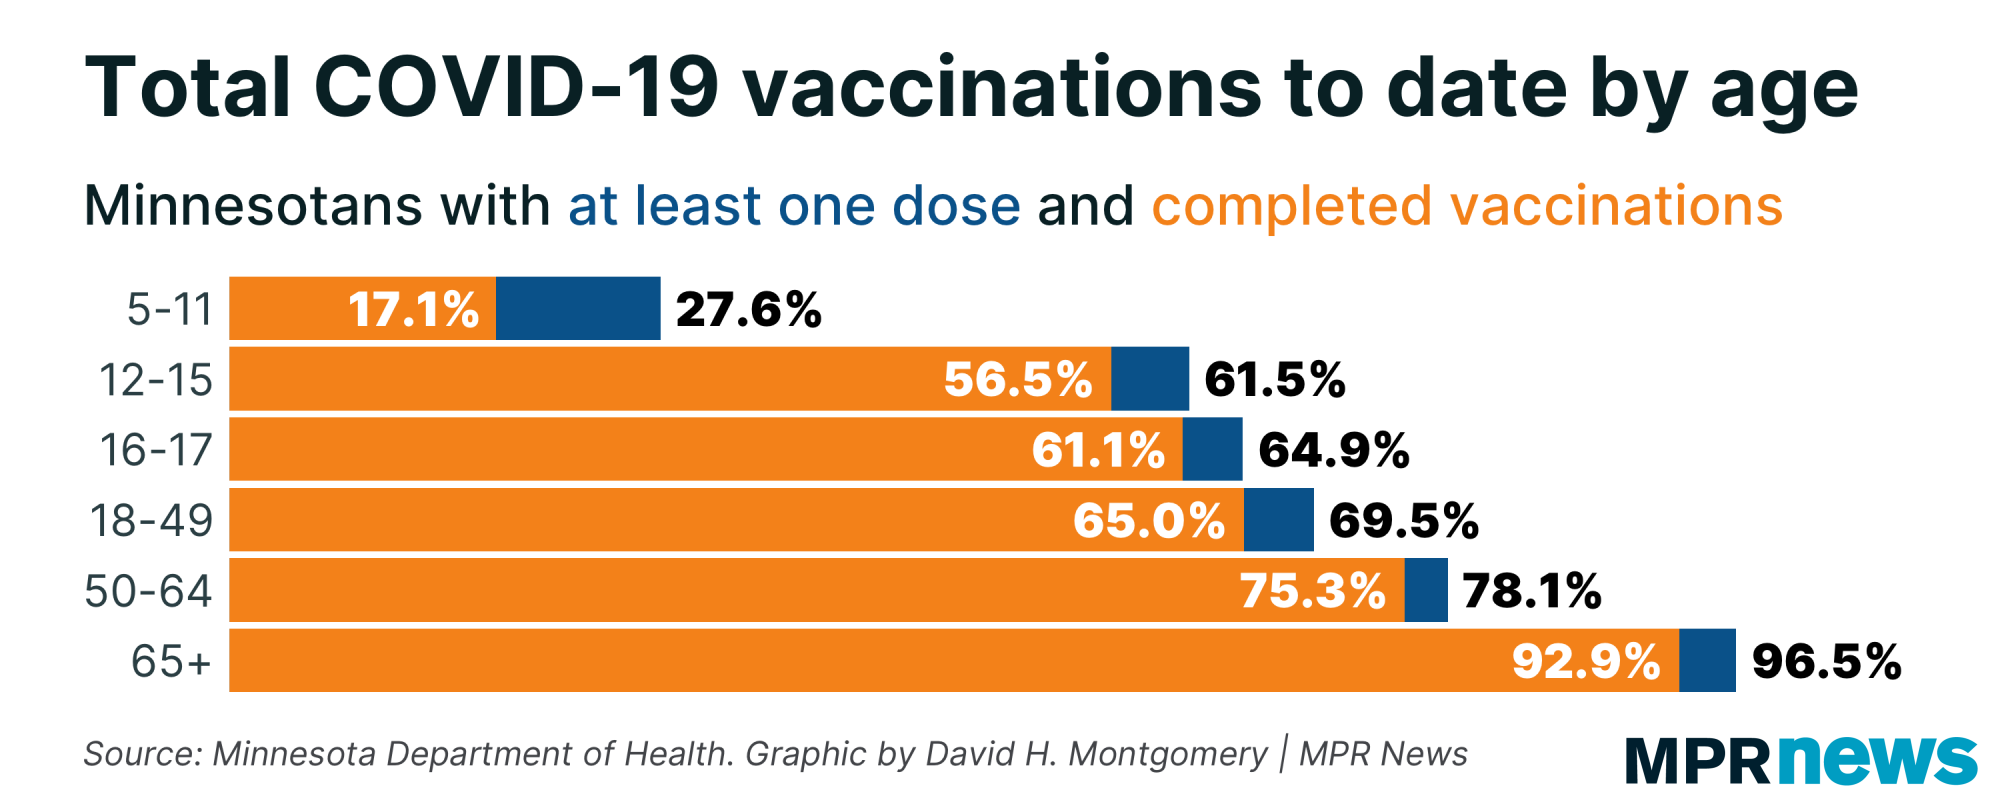
By this same point post-eligibility, 34.5 percent of 12- to 15-year-olds were vaccinated. The 5- to 11-year-olds are at about 27.5 percent.
The big picture: just over 70 percent of Minnesotans have had at least one dose, about 64 percent are fully vaccinated, and just over a quarter have received a booster. | |
|
|
|
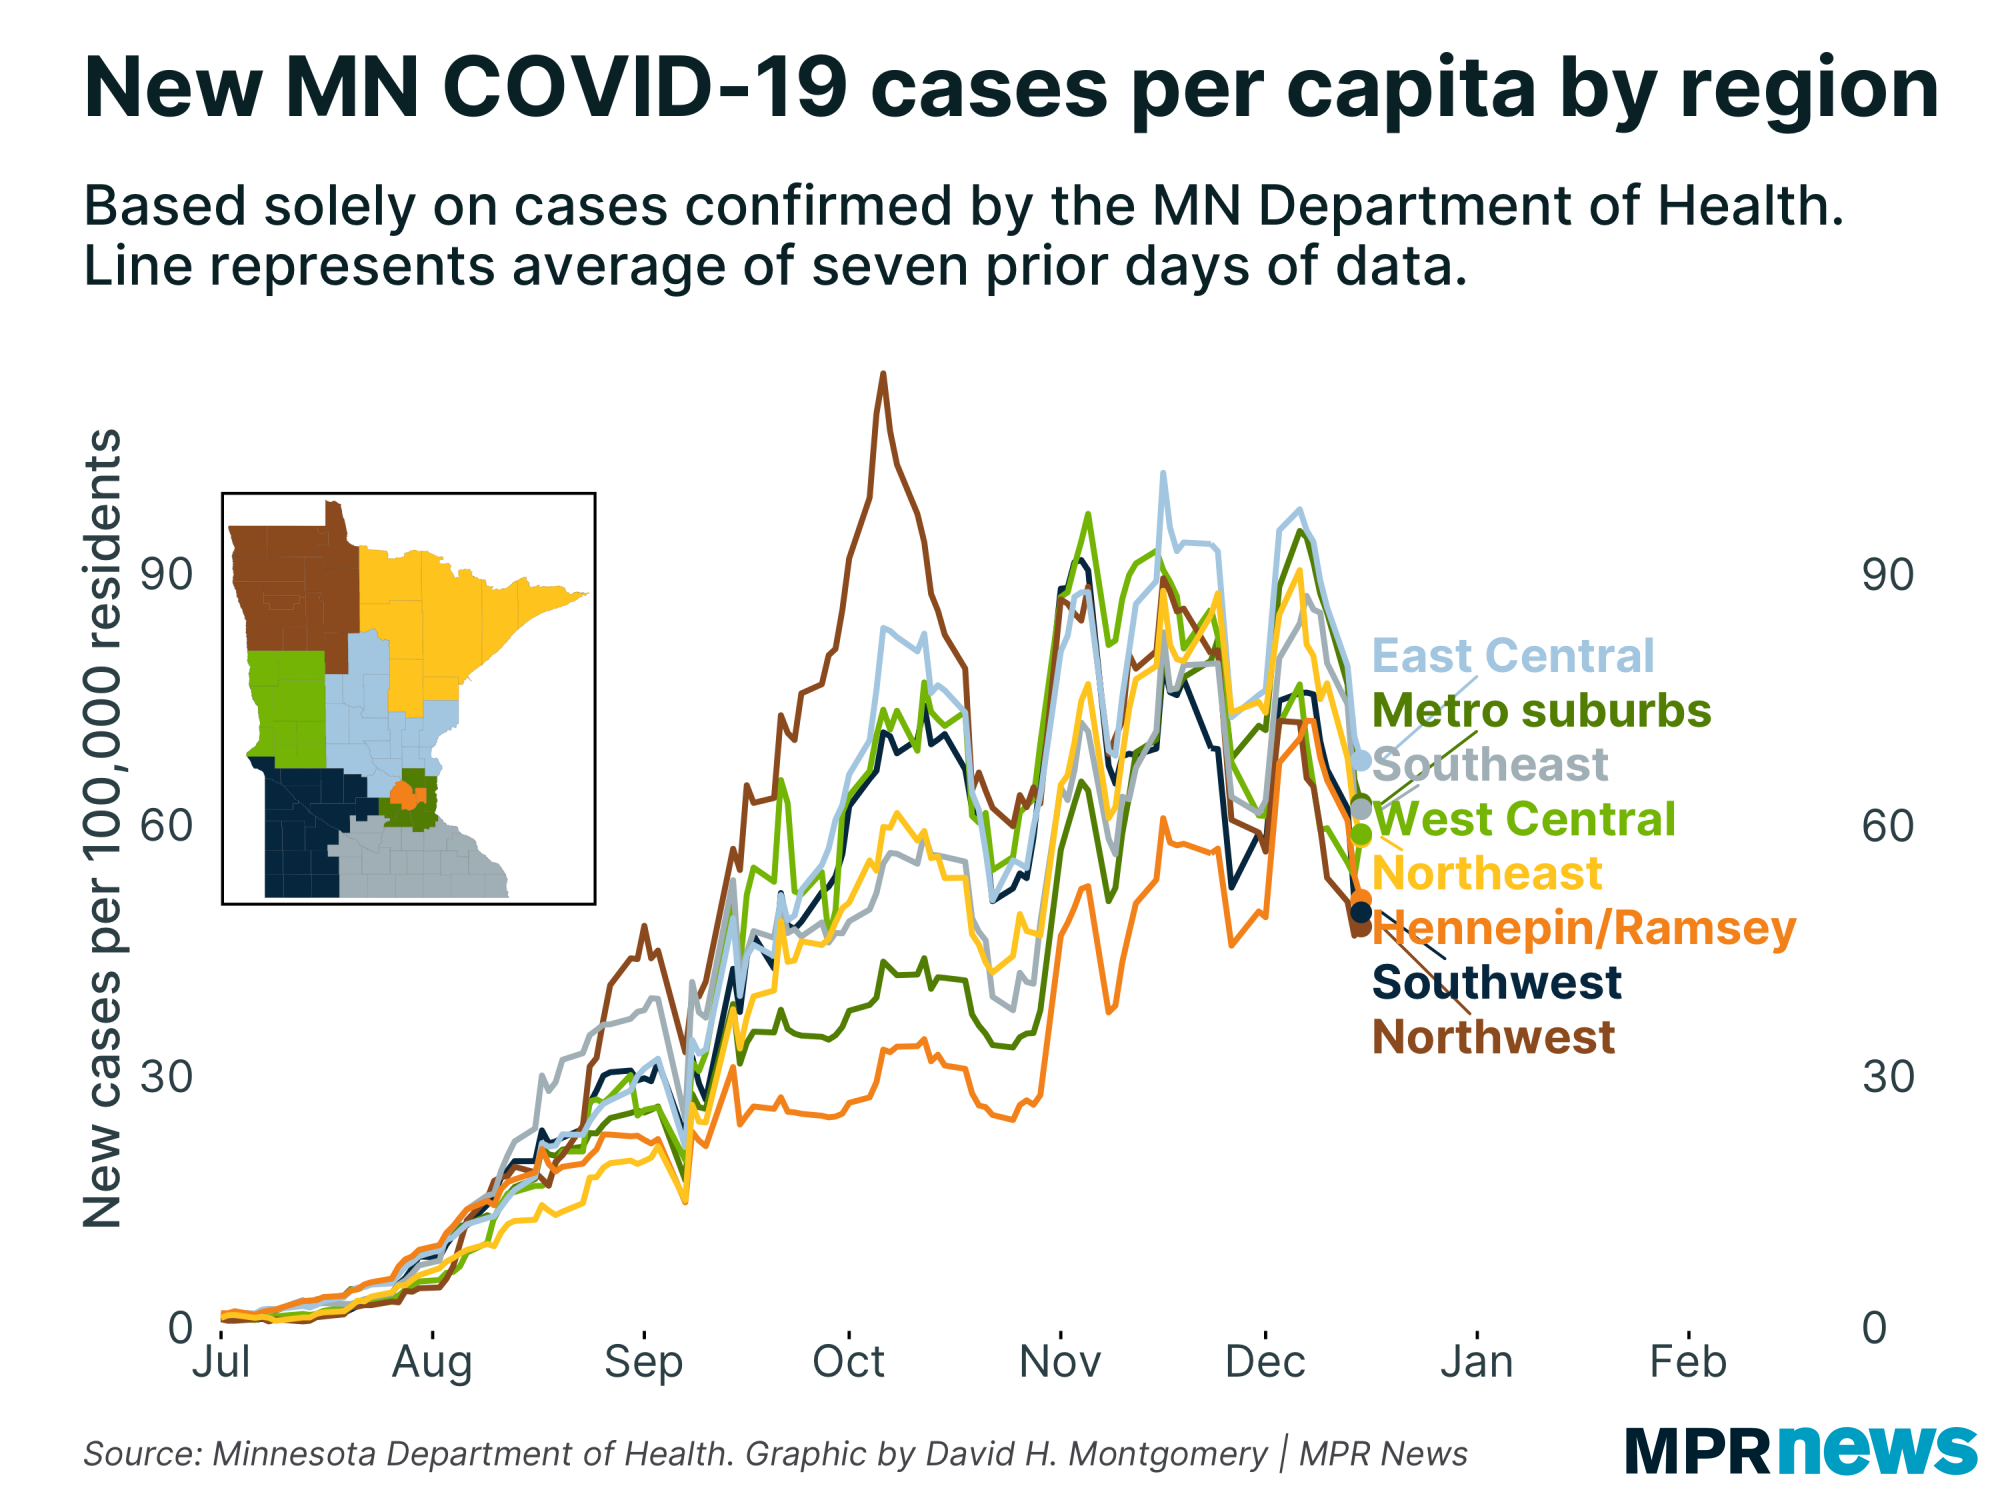
Cases are falling across the board
| | Above I reported on the consistent decline in new COVID-19 cases Minnesota has seen lately. Here I'll note that this is not a situation where some parts of the state are getting better and others aren't. Cases are falling across the board — in the Twin Cities metro area and in greater Minnesota: |
| |
|
|
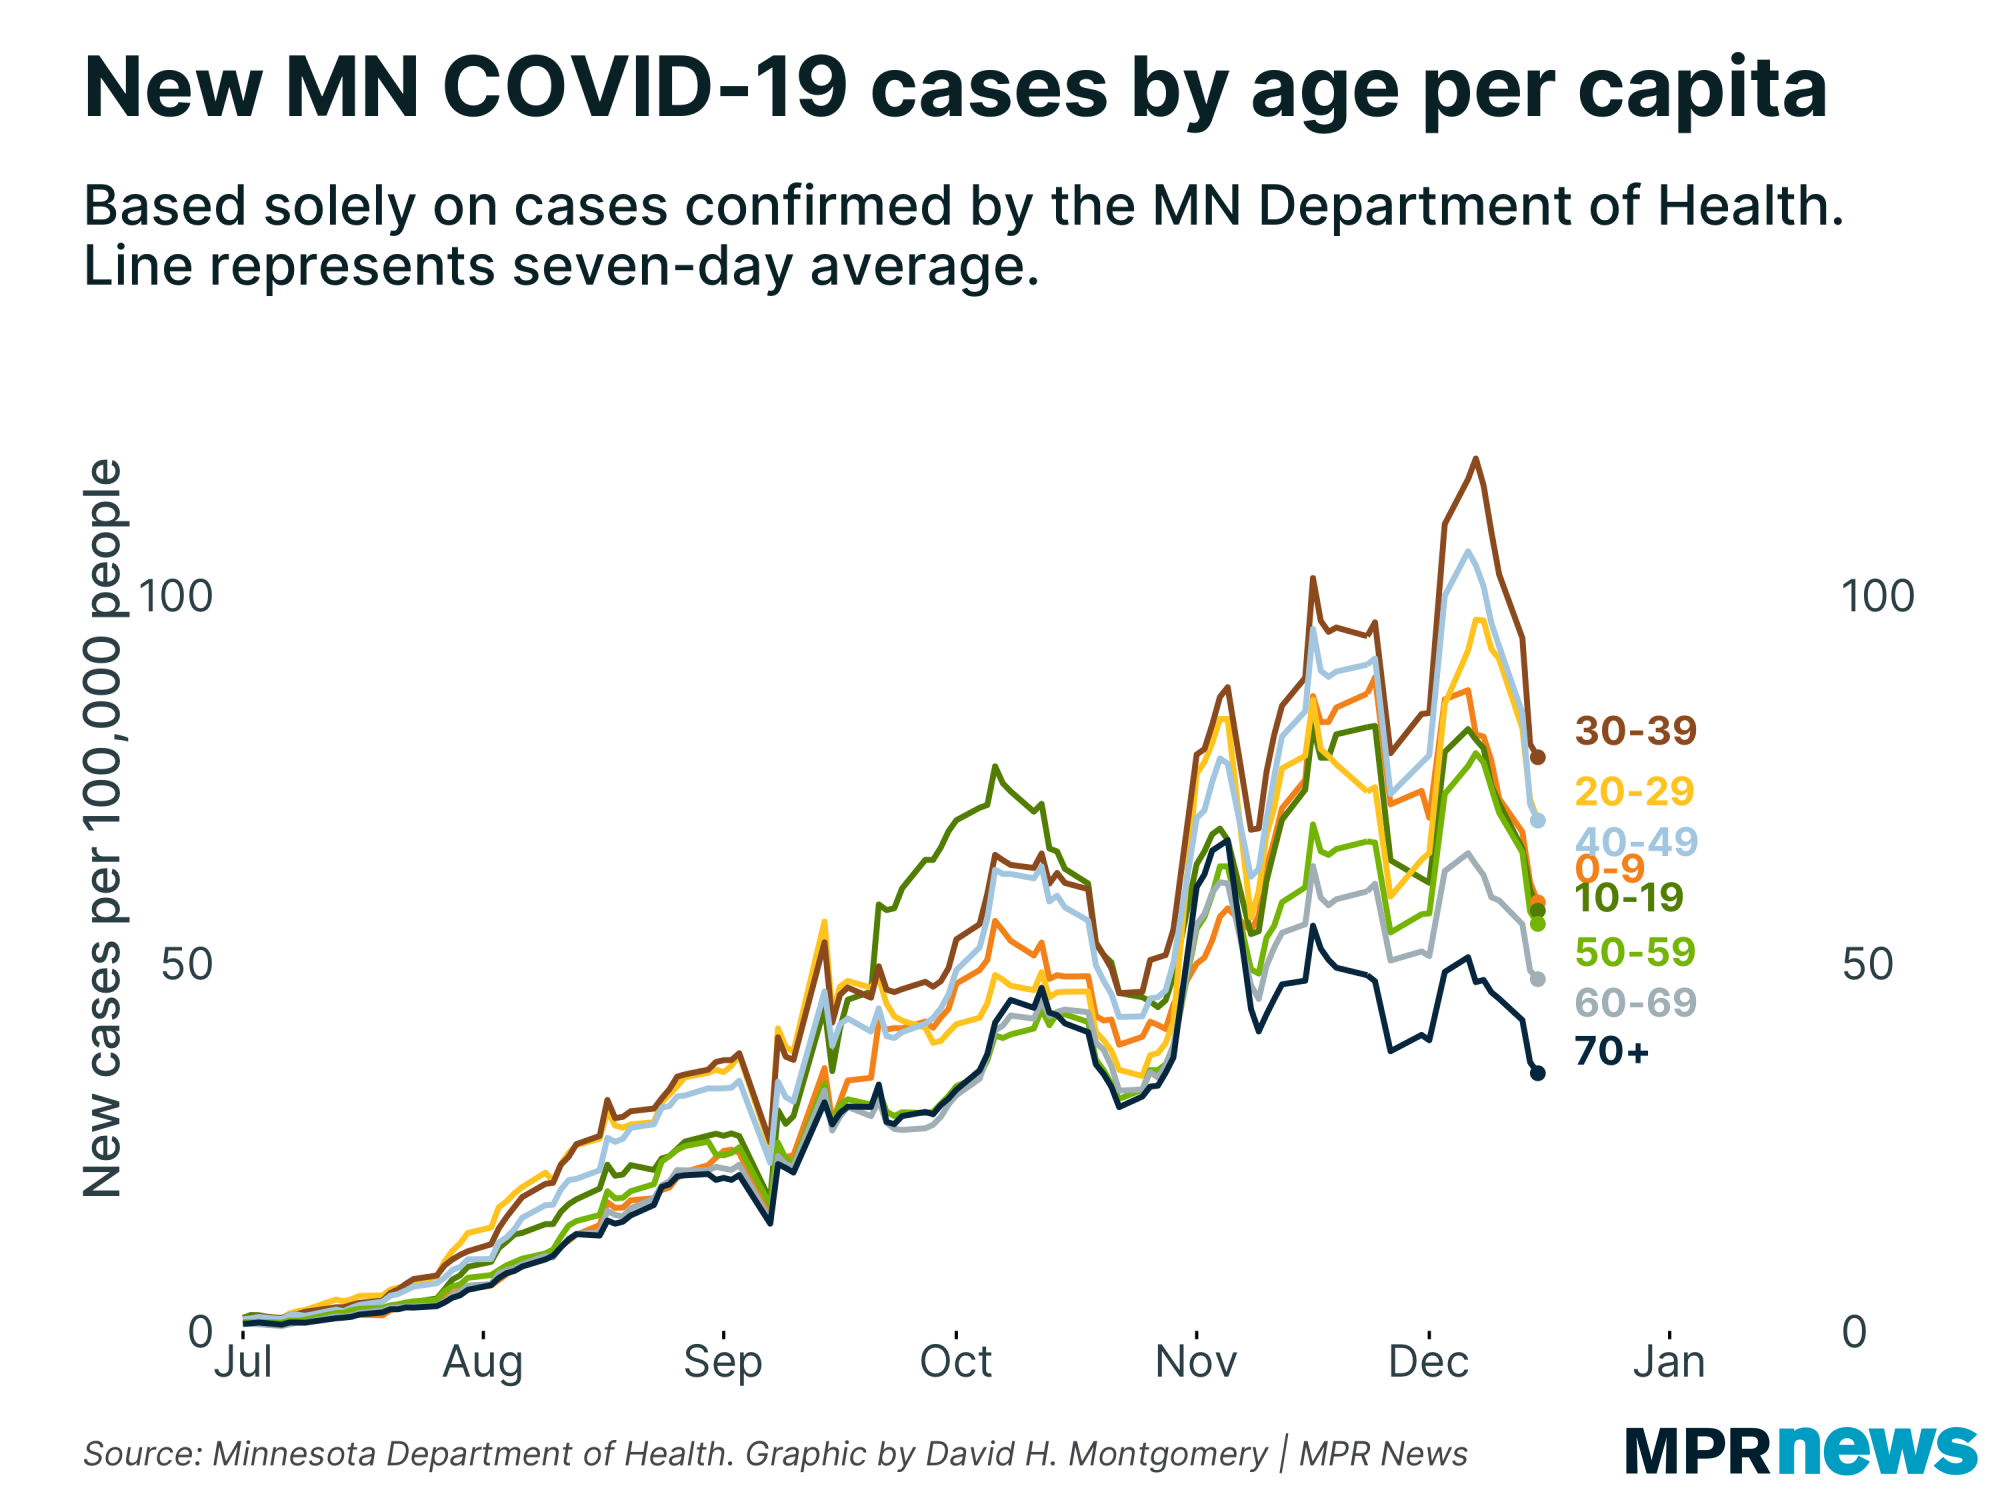
| ... and in every age bracket: | | |
|
|
What's happening next?
|
We've seen cases start to fall consistently, and will hopefully see that coming. We're also looking to see hospital admissions continue their recent drop, and bed use start to finally budget. But don't be surprised if deaths go up again before they fall.
Thanks for subscribing to this newsletter and for all of you who've sent me your feedback. As always, if you like this newsletter, please share it and the sign-up link with others who you think might enjoy it.
— David |
| |
|
|
%%[ if _MessageContext != "VAWP" then ]%%
Preference Center ❘ Unsubscribe You received this email because you subscribed or it was sent to you by a friend. This email was sent by: %%Member_Busname%%
%%Member_Addr%% %%Member_City%%, %%Member_State%%, %%Member_PostalCode%%
  |
%%[ endif ]%% |
|
| | |