%%[ SET @ViewURL = view_email_url
SET @ListID = ListID SET @SubChecker = _subscriberkey SET @EmailName = EmailName_ if @SubChecker == "rbrawley@mpr.org" then insertde('ENT.newsletter_archive_2','VAWPURL',@ViewURL,'SubscriberKey',
@SubChecker,'EmailName',@EmailName,'Date',NOW(),'ListID',@ListID) ELSE endif ]%% |
%%[ if _MessageContext != "VAWP" then ]%% %%[ endif ]%% |
| Welcome back to COVID in Minnesota TODAY, an email newsletter from MPR News about understanding the latest developments in Minnesota's COVID-19 outbreak. | | |
|
|
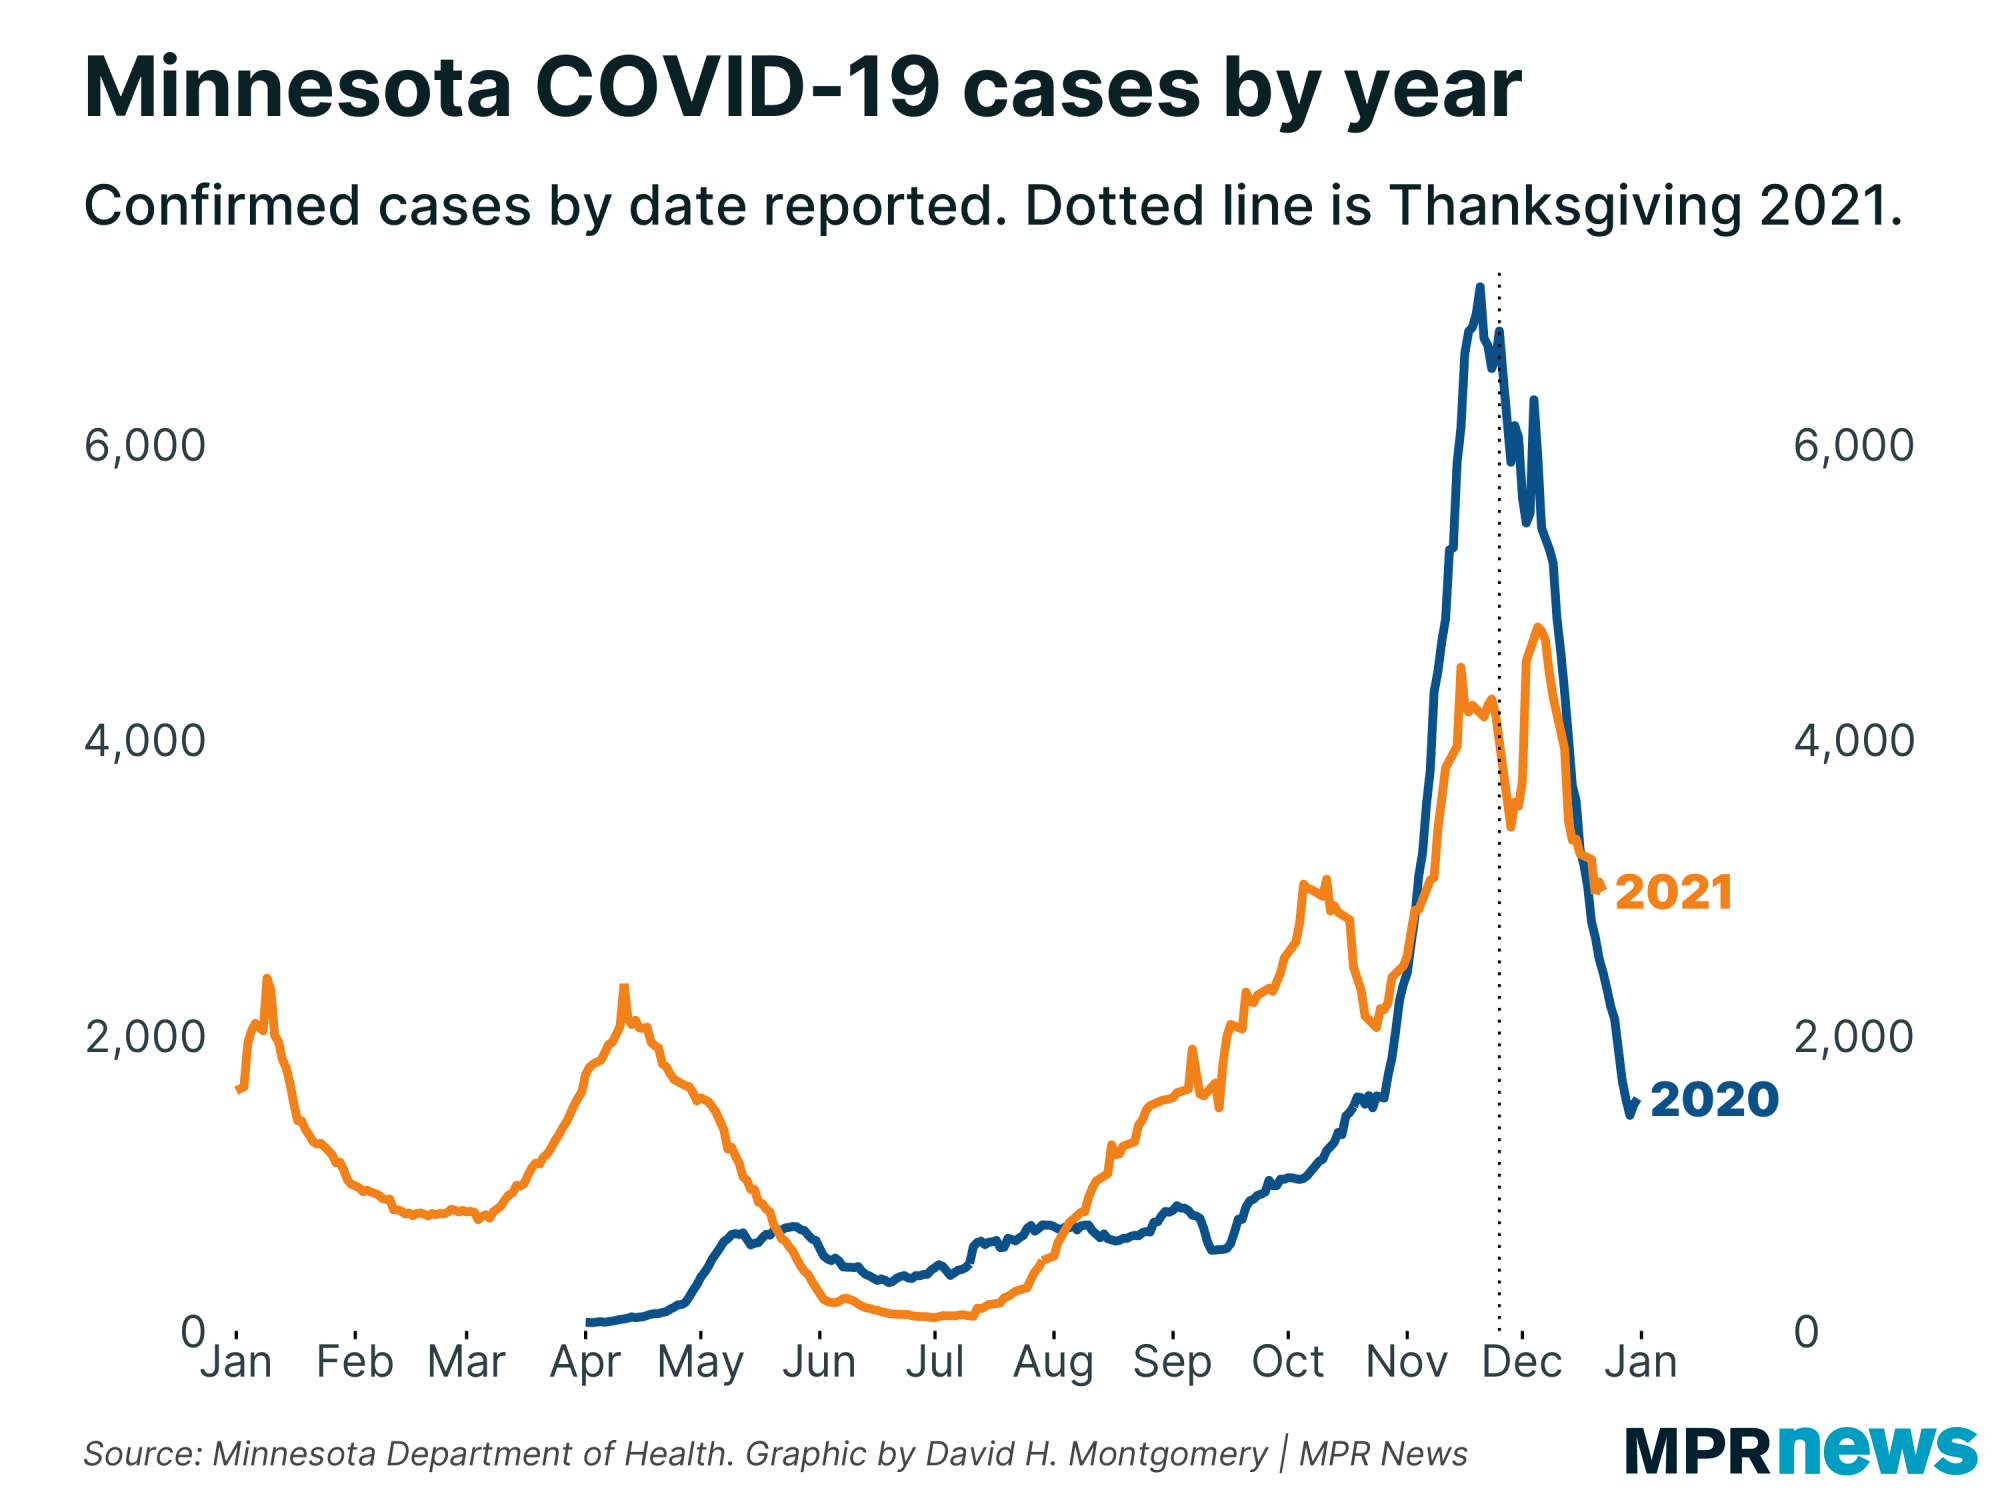
Is Minnesota experiencing an omicron-driven COVID-19 surge? Unfortunately, the data just can't give us firm answers.
We do know that omicron is either dominant in Minnesota or is rapidly on its way to becoming so.
What we haven't seen so far is an explosion of confirmed cases like many other states have reported.
Case counts and other metrics in Minnesota continue to trend downward, despite anecdotal reports of lots of new infections. So what's going on?
One possibility is that Minnesota is seeing an omicron surge — it's just that the lags involved in collecting and reporting the data mean it hasn't shown up yet. Unfortunately, if this is the case we'll be waiting for a while, with no COVID report on Dec. 24 due to the holiday.
People have also pointed out reasons why an omicron surge wouldn't be showing up in the stats, such as lots of mild infections people don't get around to checking, or increased reliance on at-home tests that aren't counted in official results. All this is true — but they're true in other parts of the U.S., too, and hasn't prevented places like New York or Illinois from showing huge spikes in confirmed COVID cases. When omicron really hits a place hard, we'll know it.
Finally, it's possible that omicron is here but isn't for some reason hitting Minnesota like a wave. The theory here would be that our recent, not-yet-receded delta wave, combined with reasonably high vaccination rates, has left a lot of residual immunity in the population. This doesn't mean we'll never see an omicron spike, but it could hit in a few months.
But I'm certainly not going out on a limb to say which of these is the case — our data doesn't tell us one way or the other. Unfortunately, the Christmas and New Years holidays are going to make telling what's happening tricky for a long time (and could create temporary bumps in the data that look exactly like an omicron spike in the short term). Maybe we're about to get smacked, maybe not, maybe we already are and just haven't noticed yet All we can do now is hope and find out.
More below. |
| |
|
|
Three things to know
| - Case counts, positivity, hospitalizations and deaths are all falling steadily in the most recent available, despite widespread anecdotal accounts of an omicron-fueled rise in infections
- Cases are falling or flat across Minnesota, with no visible localized outbreaks
- Vaccination rates have leveled off a bit, with booster demand still high
|
| |
|
|
| The encouraging news so far is that Minnesota's case counts continue to decline fairly steadily, as they have since the week after Thanksgiving. | | |
|
|
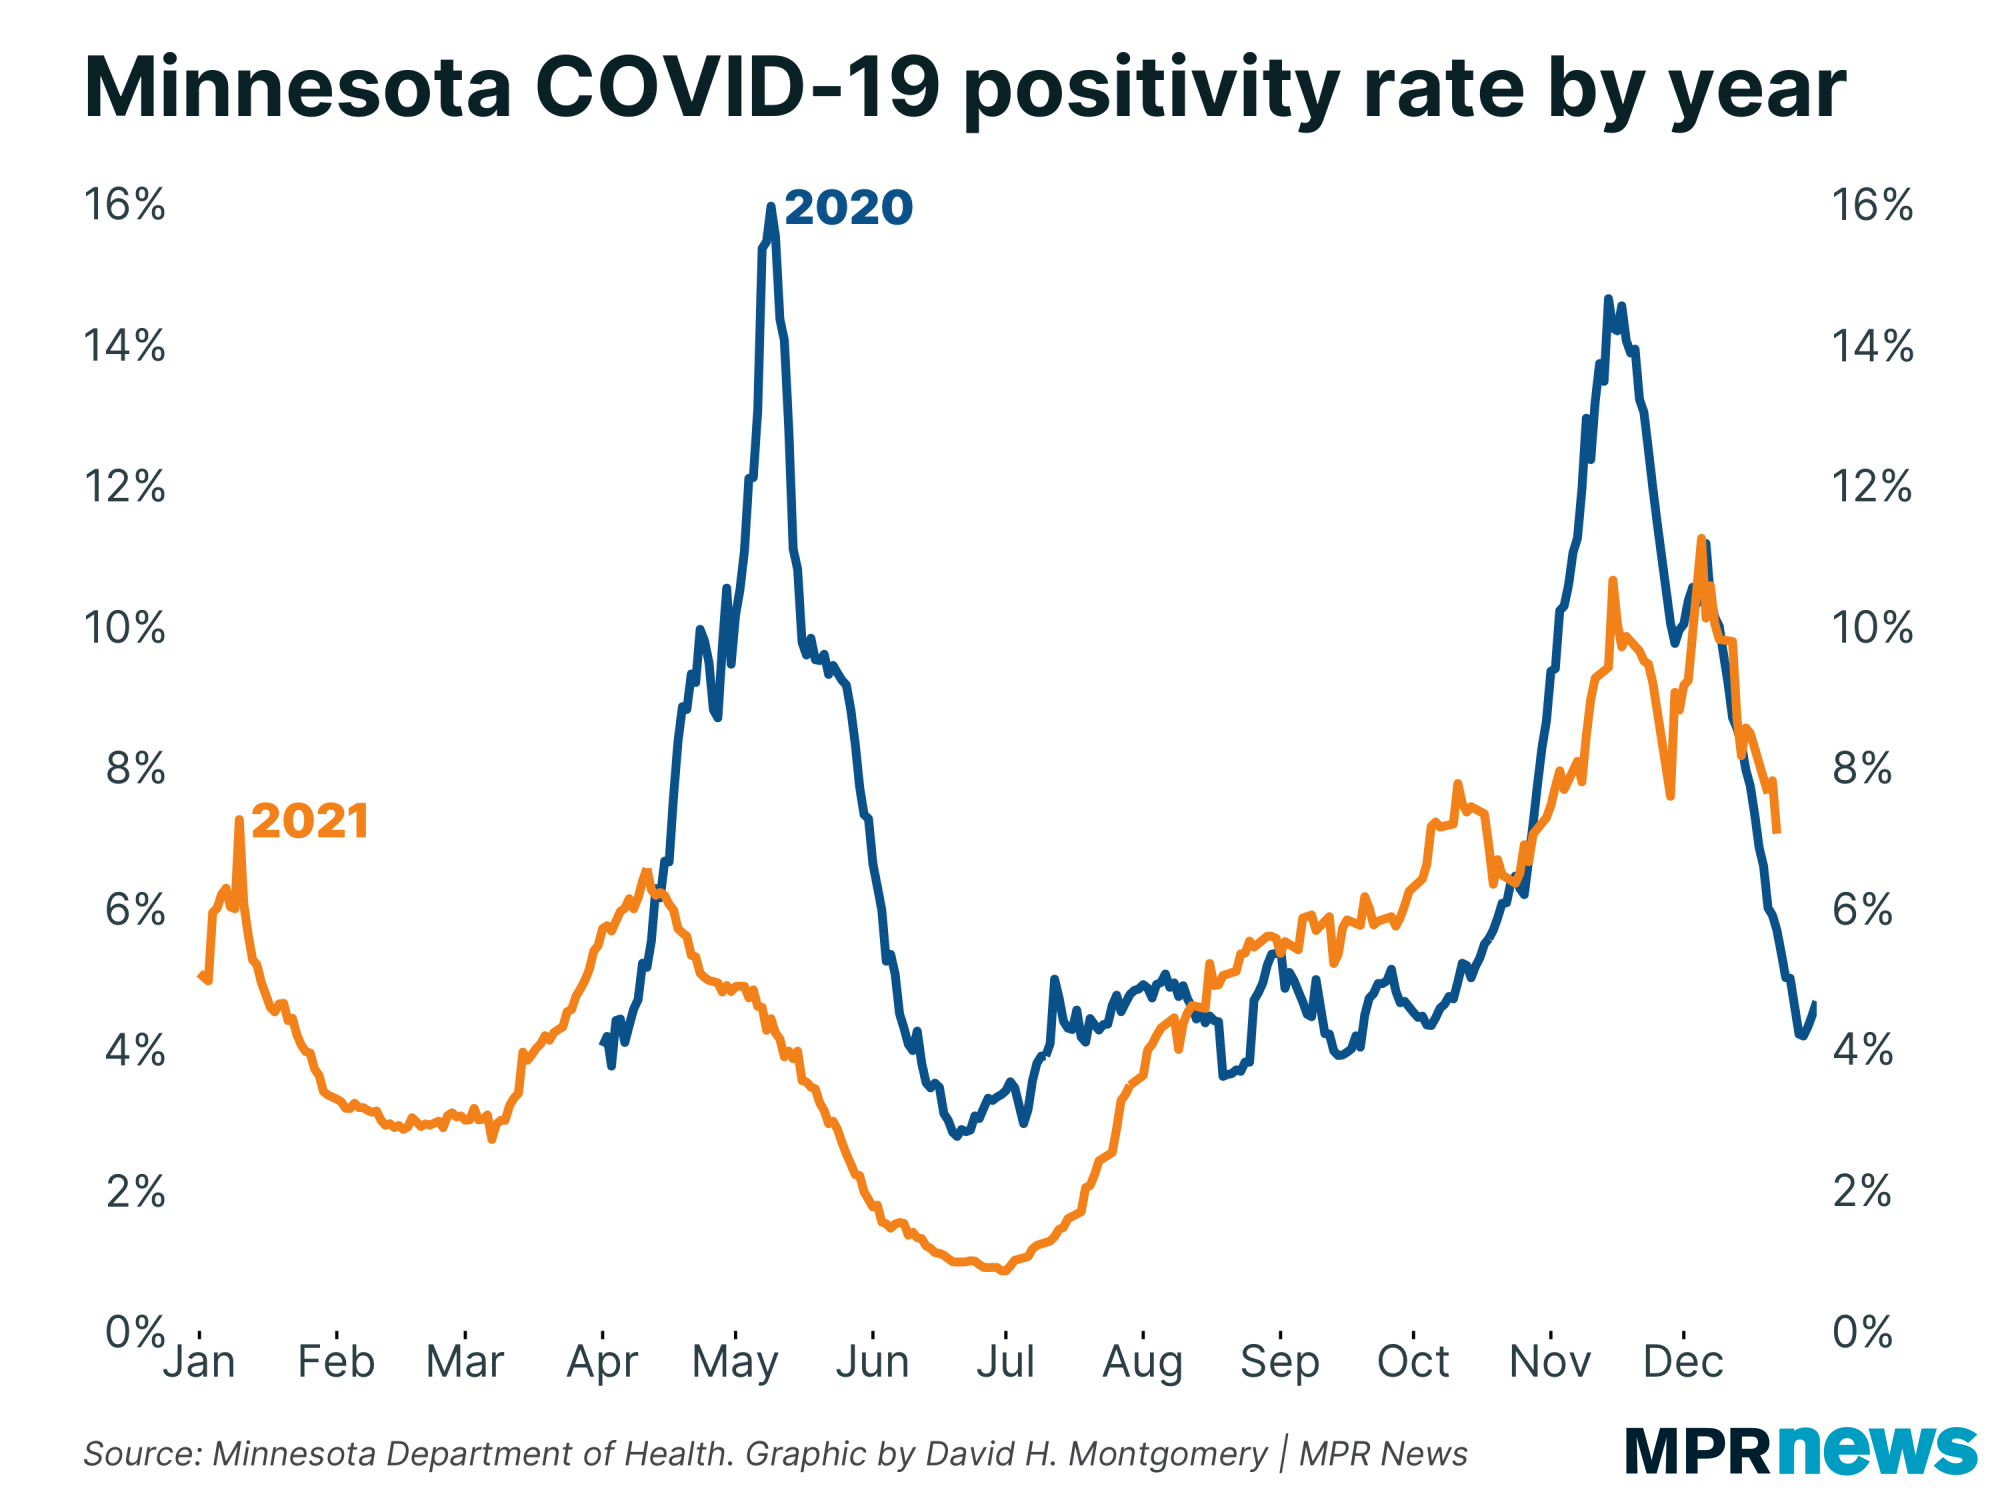
| Minnesota's average positivity rate is down to 7 percent, a three-point drop from our 10 percent rate just two weeks ago. | | |
|
|
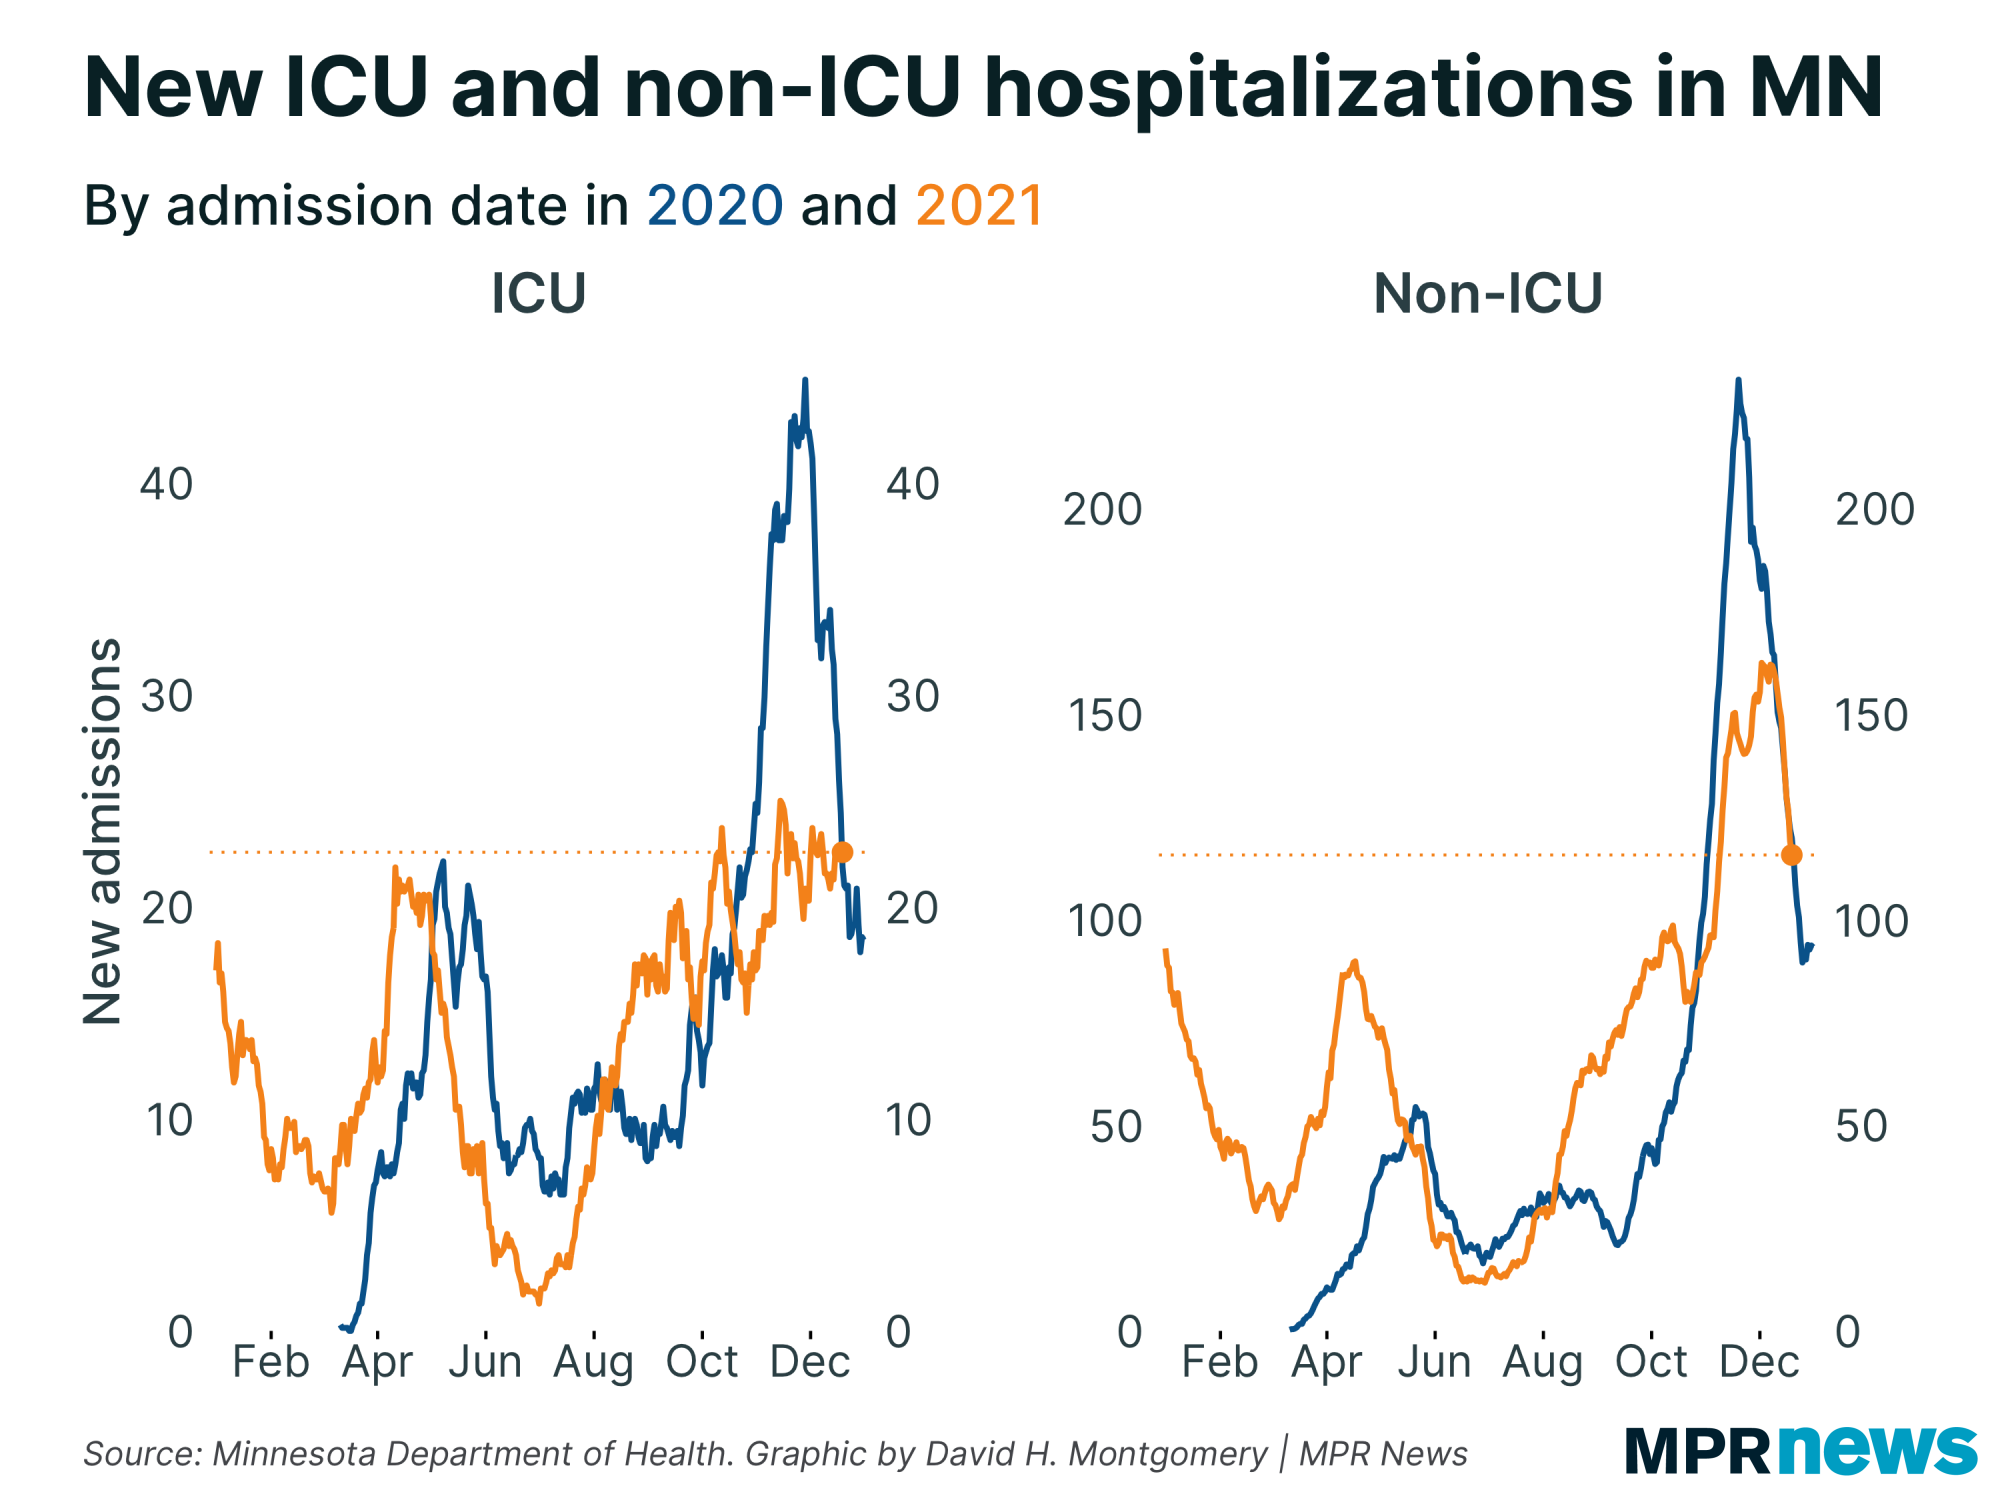
Most encouraging of all, COVID-19 hospitalizations have started to fall steadily, too! This makes sense since normally we see hospitalizations move a few days after cases (a constant rebuke to people who argue that cases don't matter as a metric any more — they matter so long as they're a good predictor for hospitalizations!).
Specifically, we're seeing a decline in new non-ICU hospital admissions. ICU admissions are still bouncing up and down. |
| |
|
|
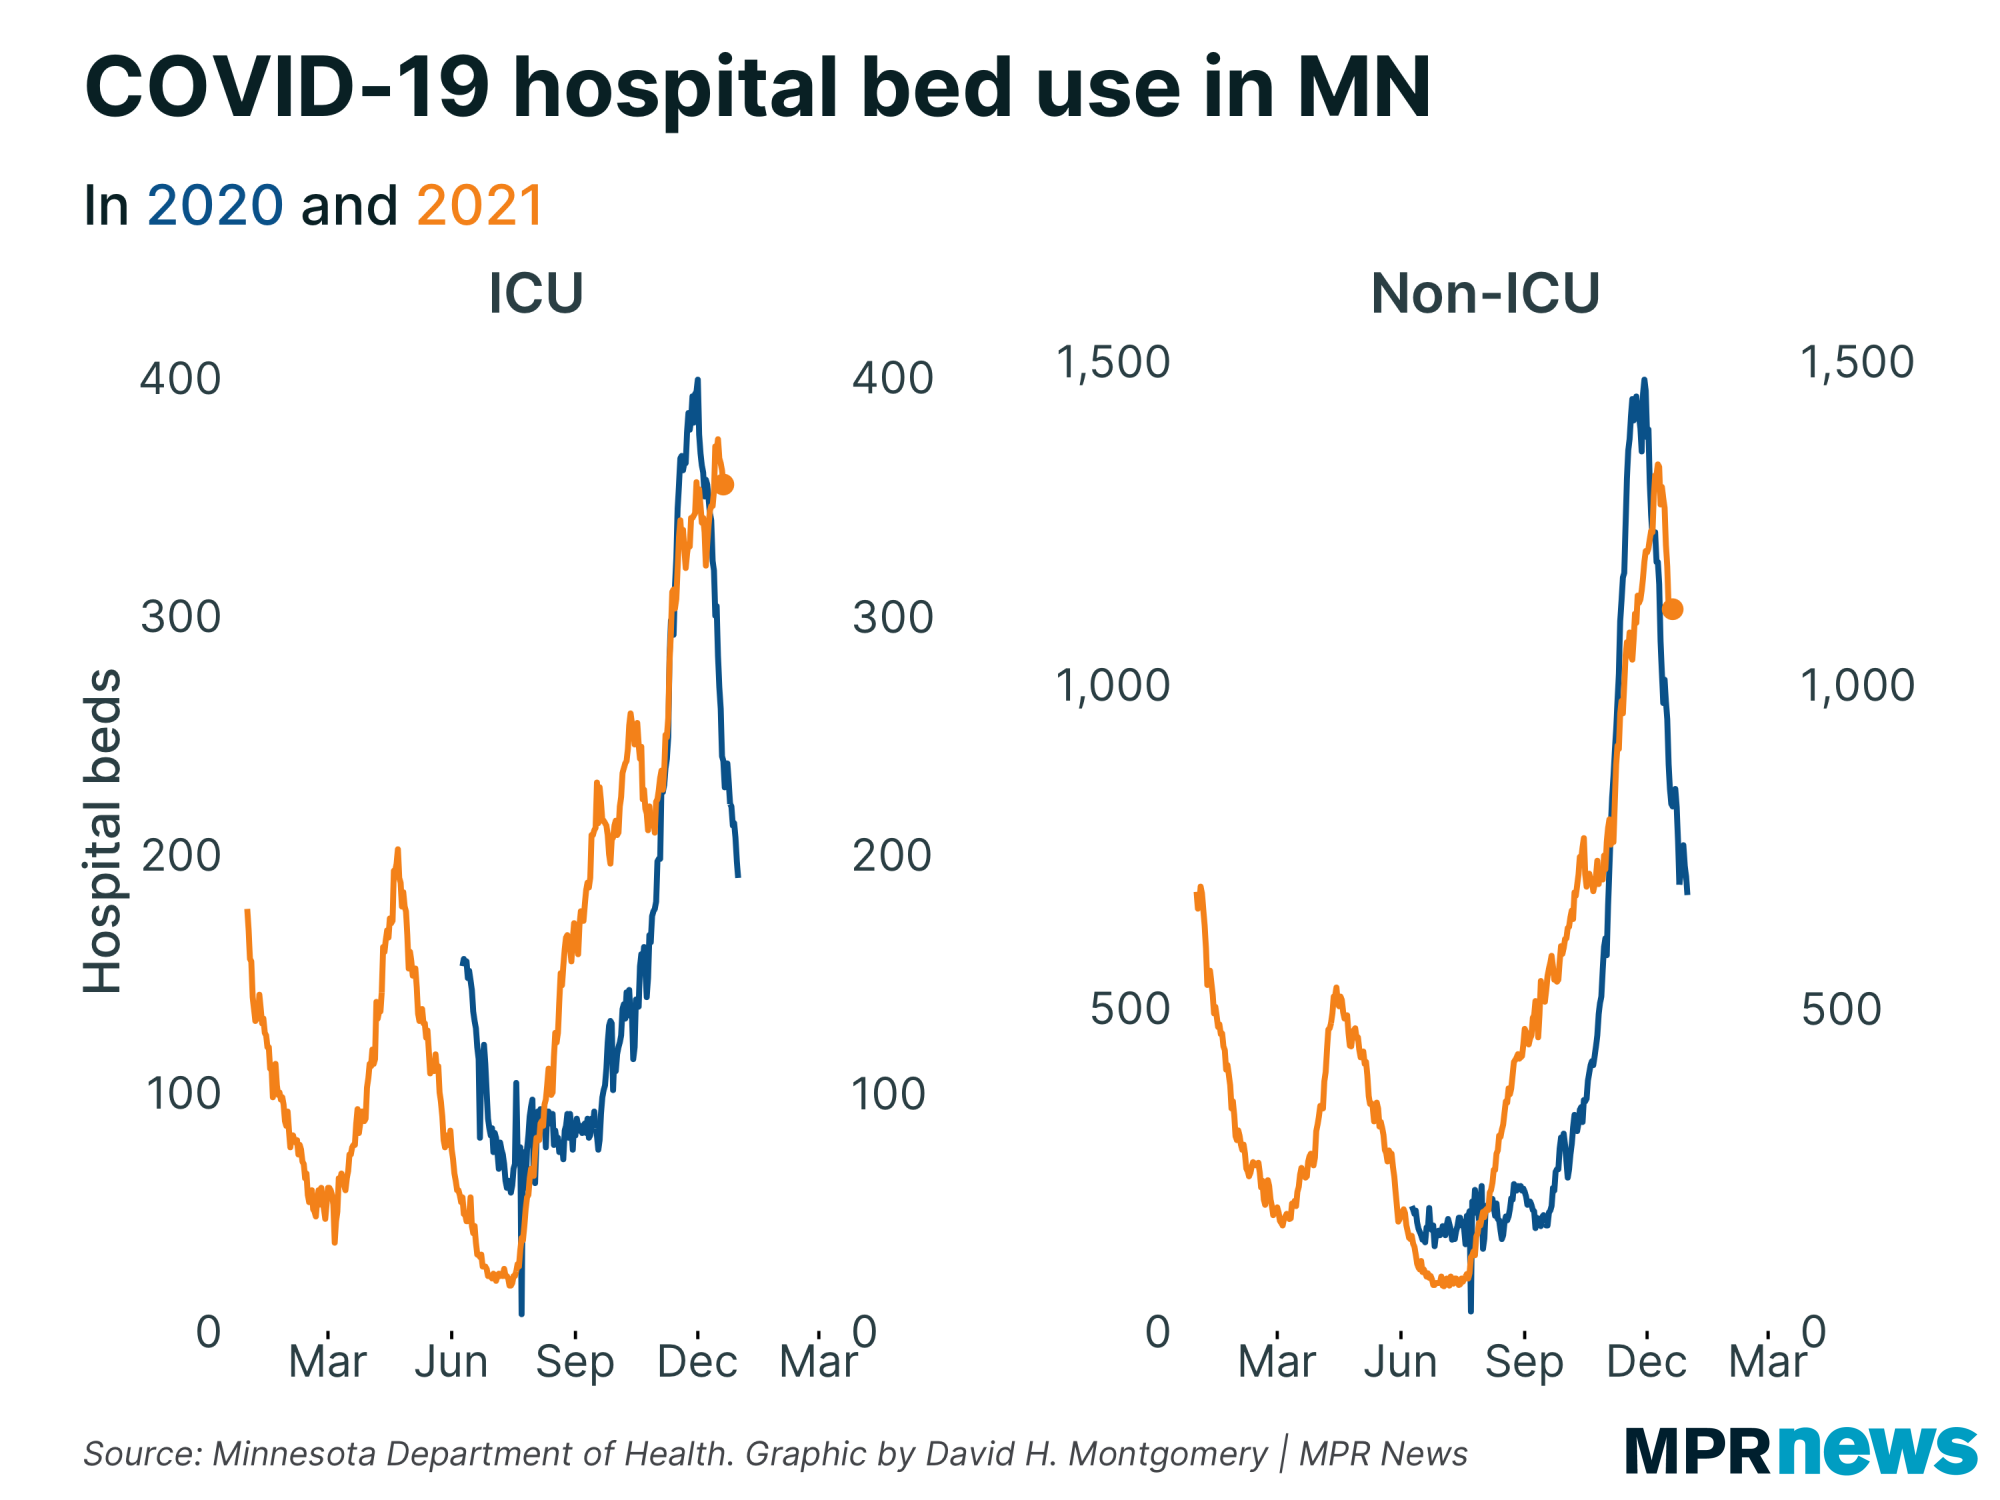
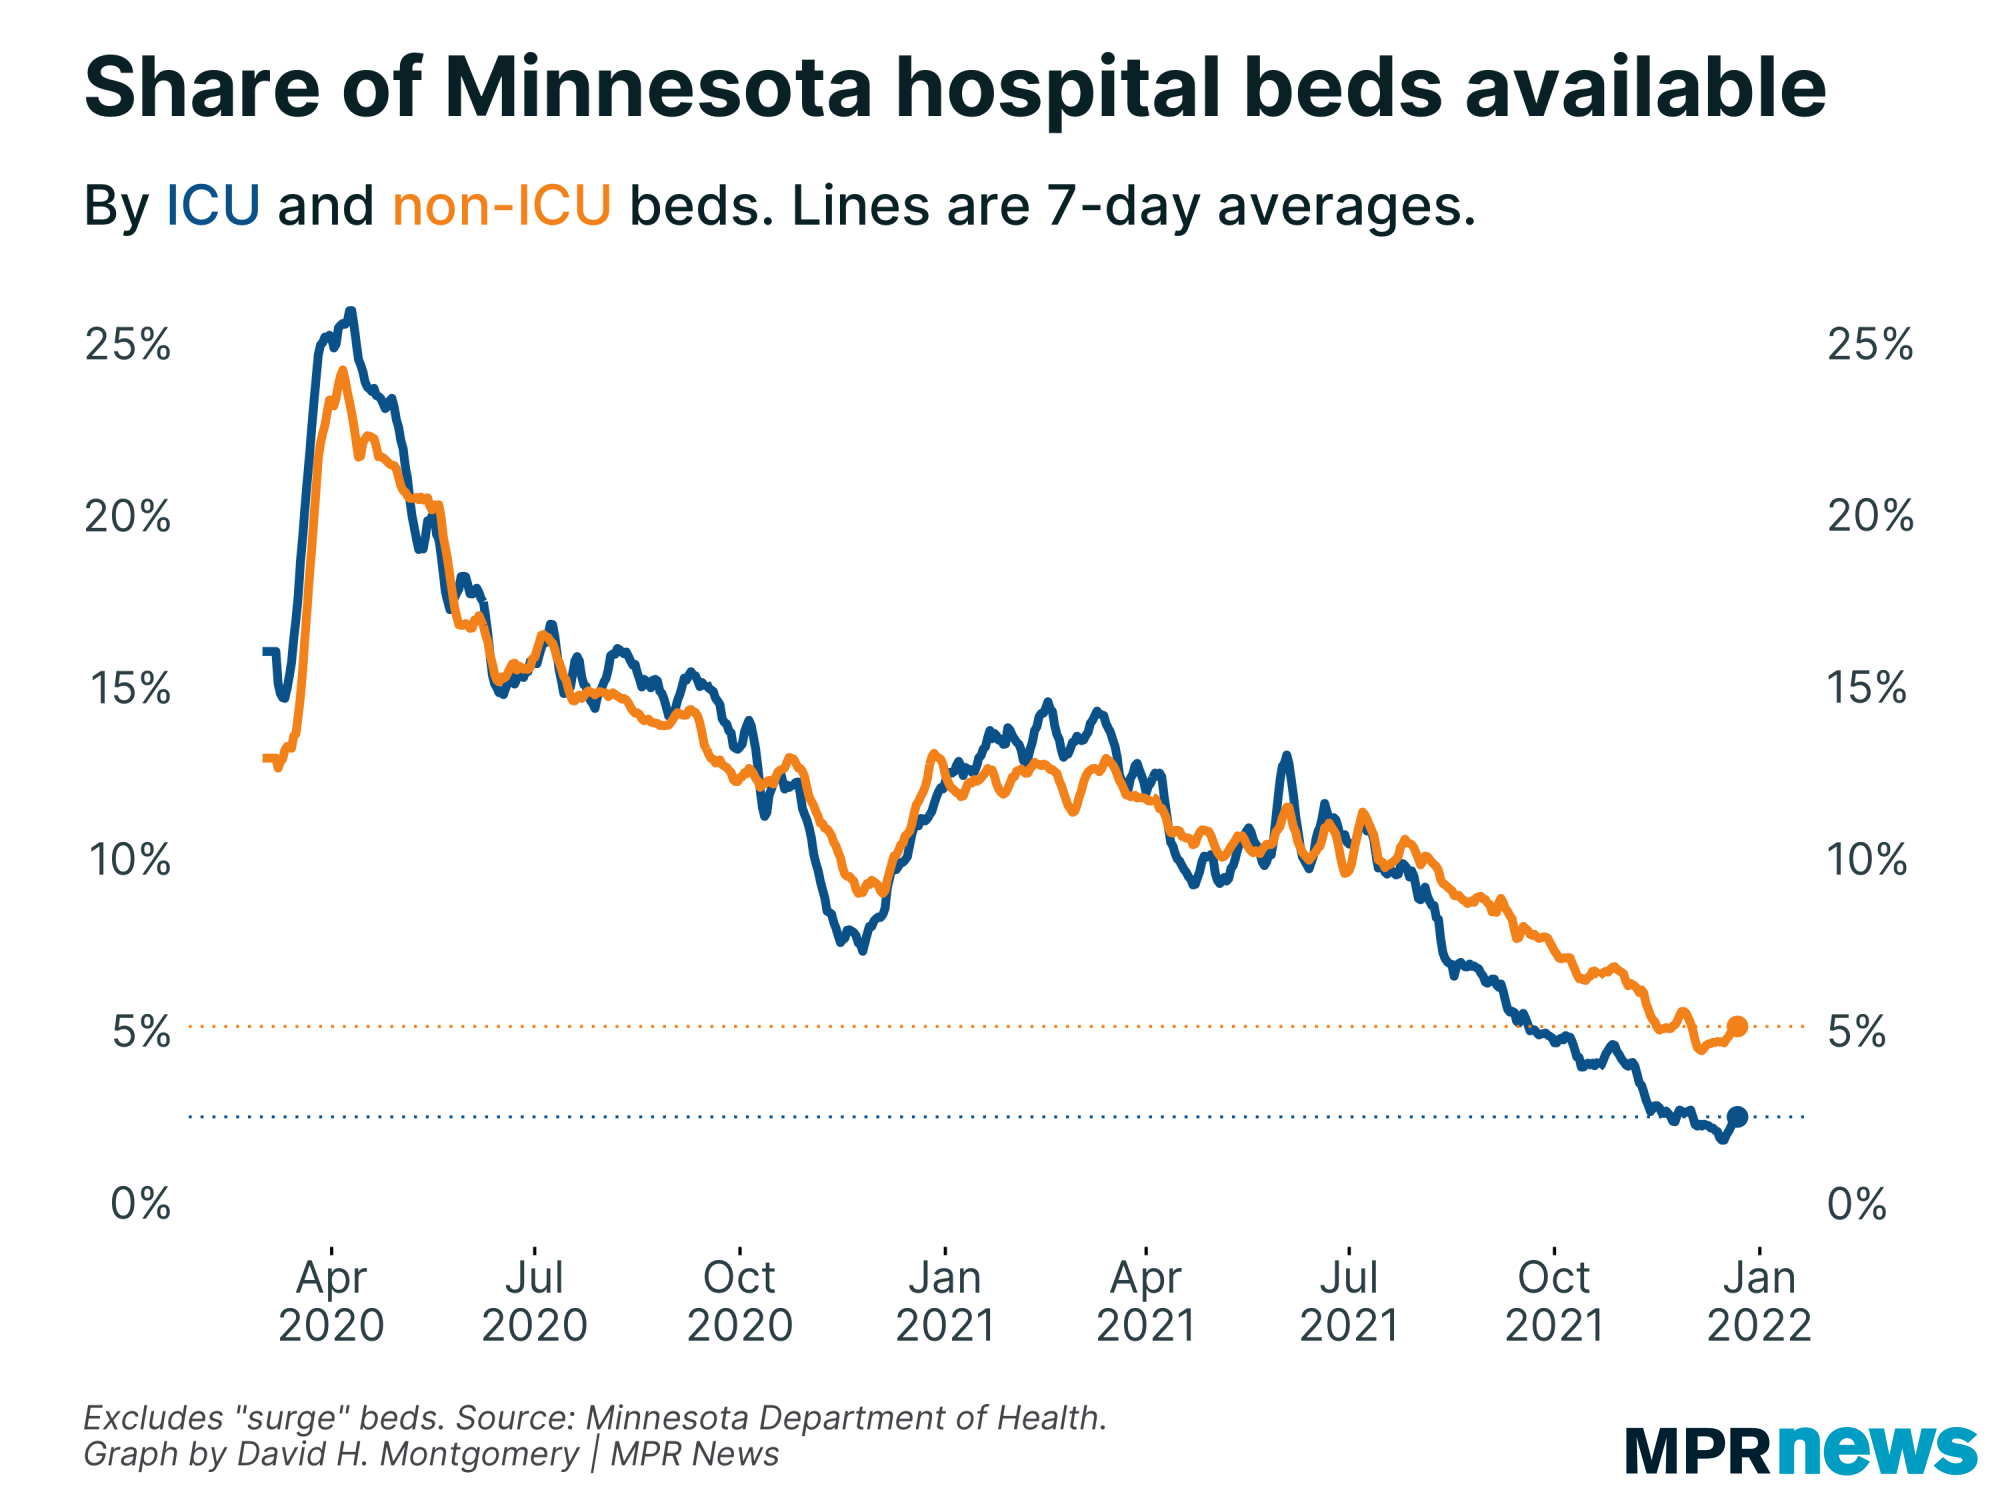
| It took a few days, but this slowdown in new admissions has also had an effect on COVID-19 bed use, too — again mostly for non-ICU beds. | | |
|
|
To be clear, all these metrics remain very high! We're not done with this wave yet, even if a new omicron wave isn't coming. But so far, at least, the metrics are moving in the right direction.
What we haven't seen so far is a drop in overall hospital bed use, just the number occupied by COVID-19 patients. That again makes sense — the COVID spike had forced people with less urgent ailments to put off their care; beds opening up means these people can now finally get into the hospital. |
| |
|
|
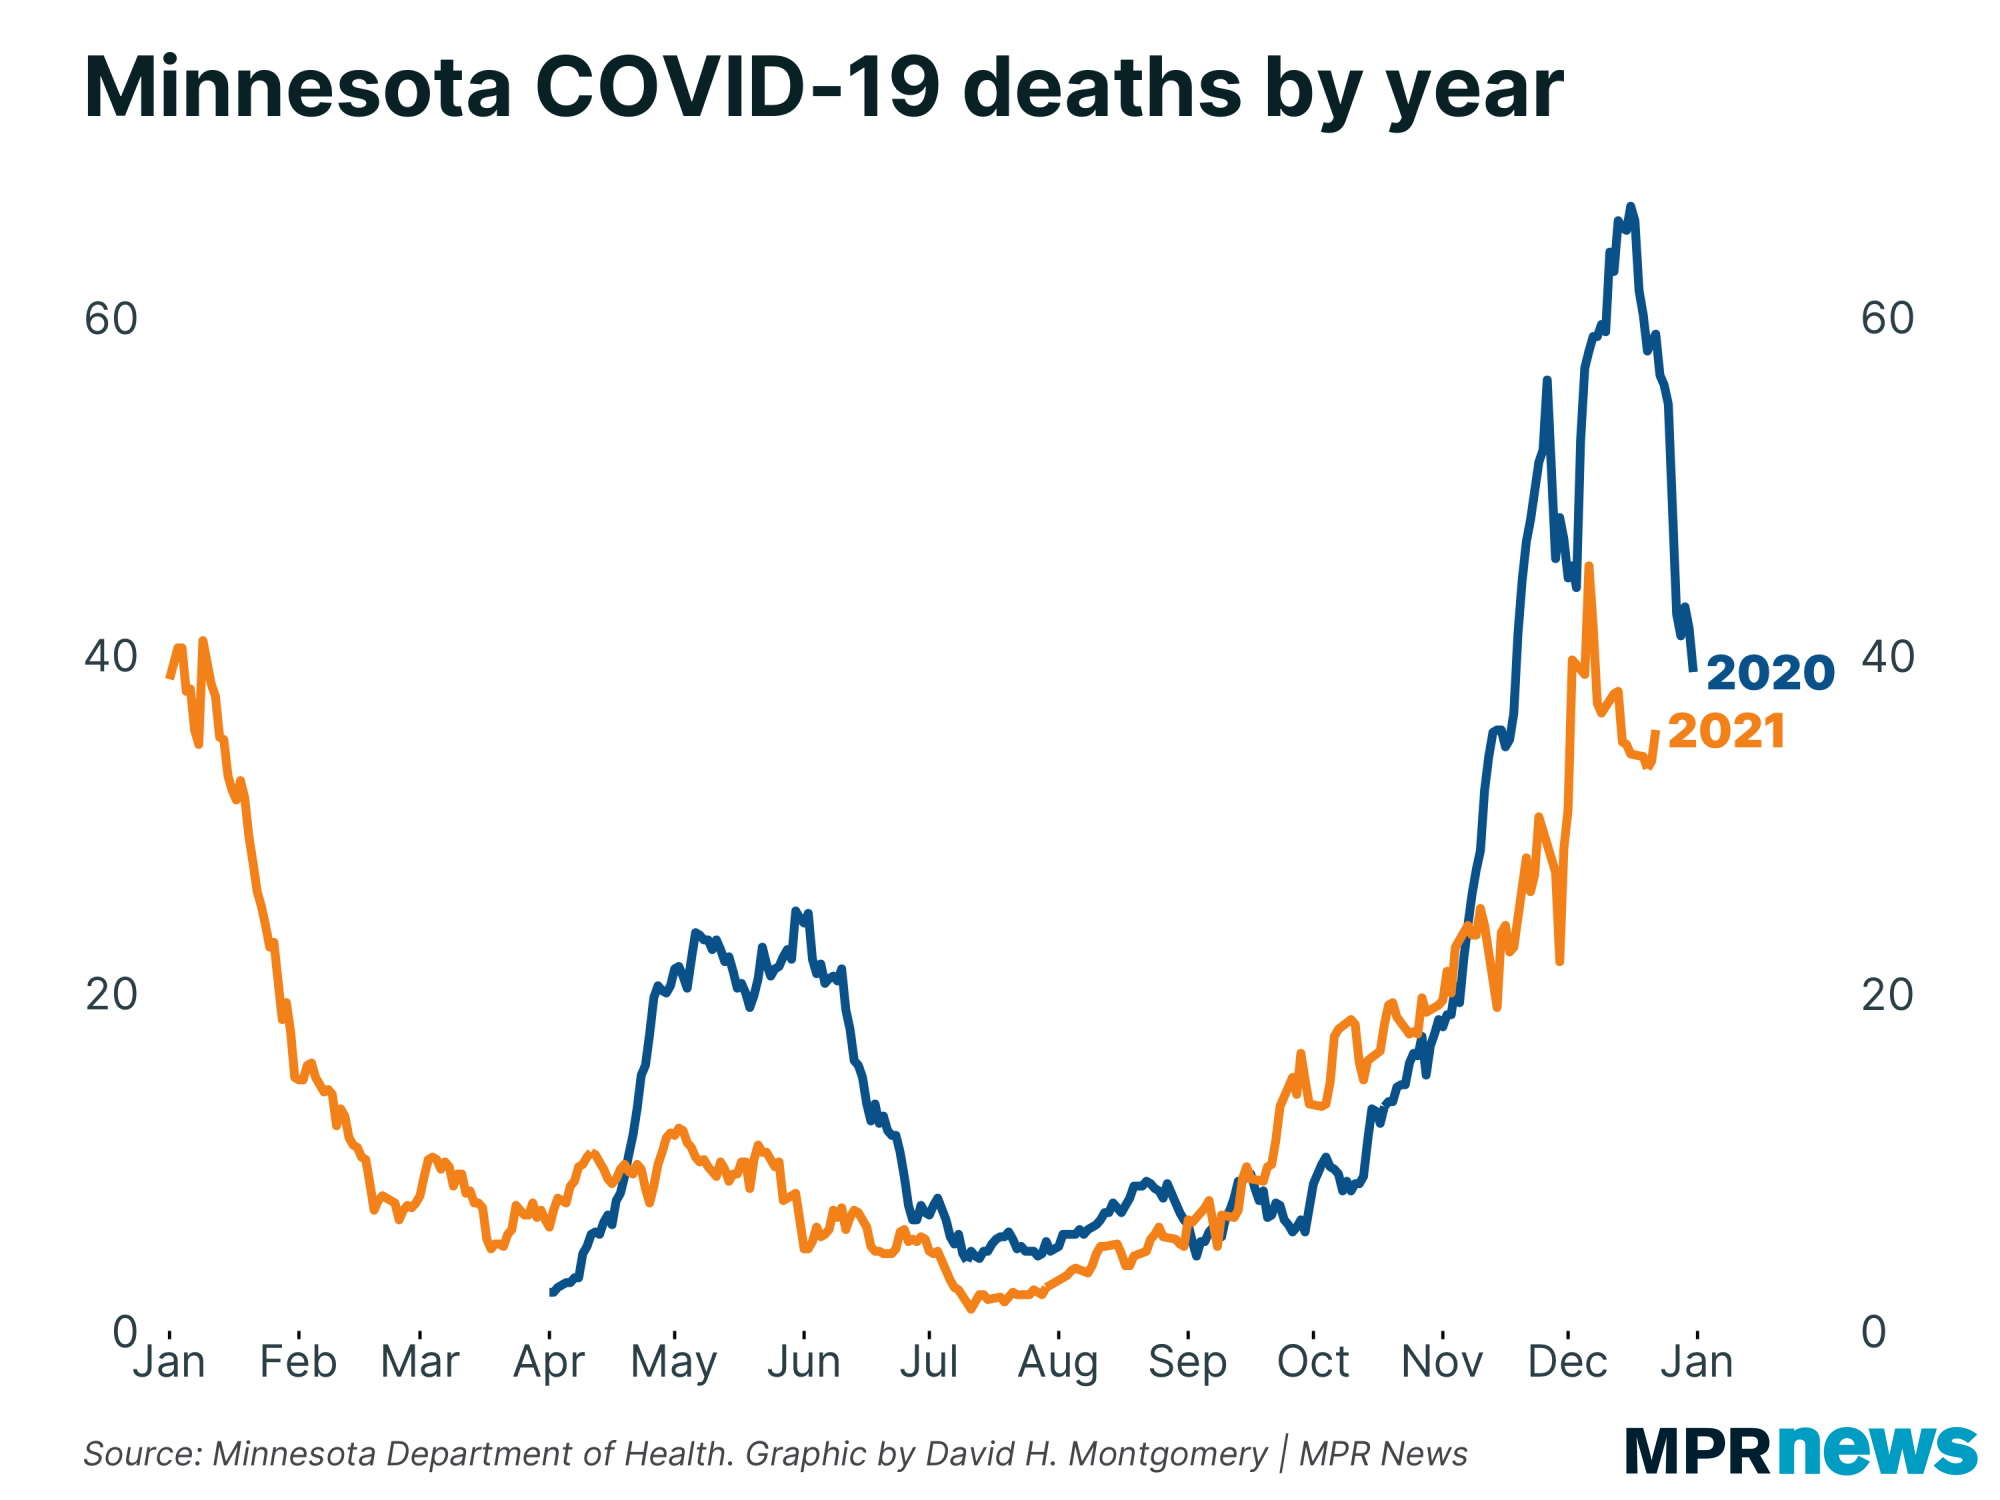
| COVID-19 deaths have continued to trend mostly downward the past two weeks. That's a welcome sign; I had sort of expected another brief spike, mirroring our brief case spike after Thanksgiving. That could still be ahead of us, though. | | |
|
|
Below, I'll explore a few more stats about Minnesota's COVID-19 outbreak. If you want to learn more, I also recommend these other articles:
| | |
|
|
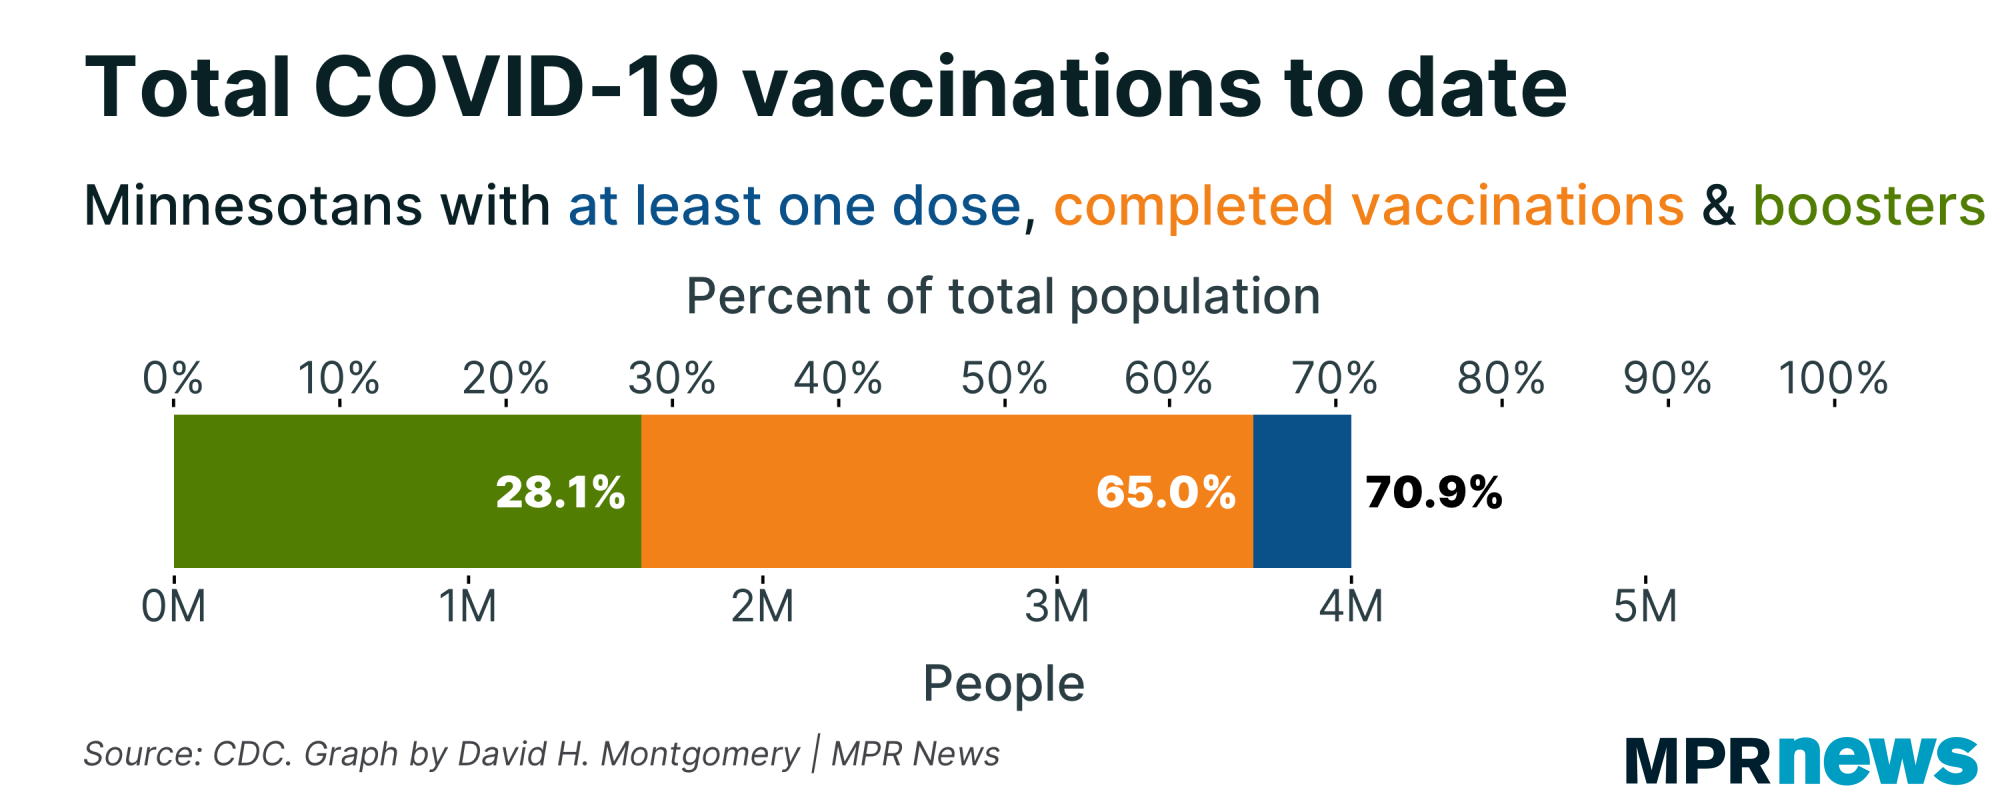
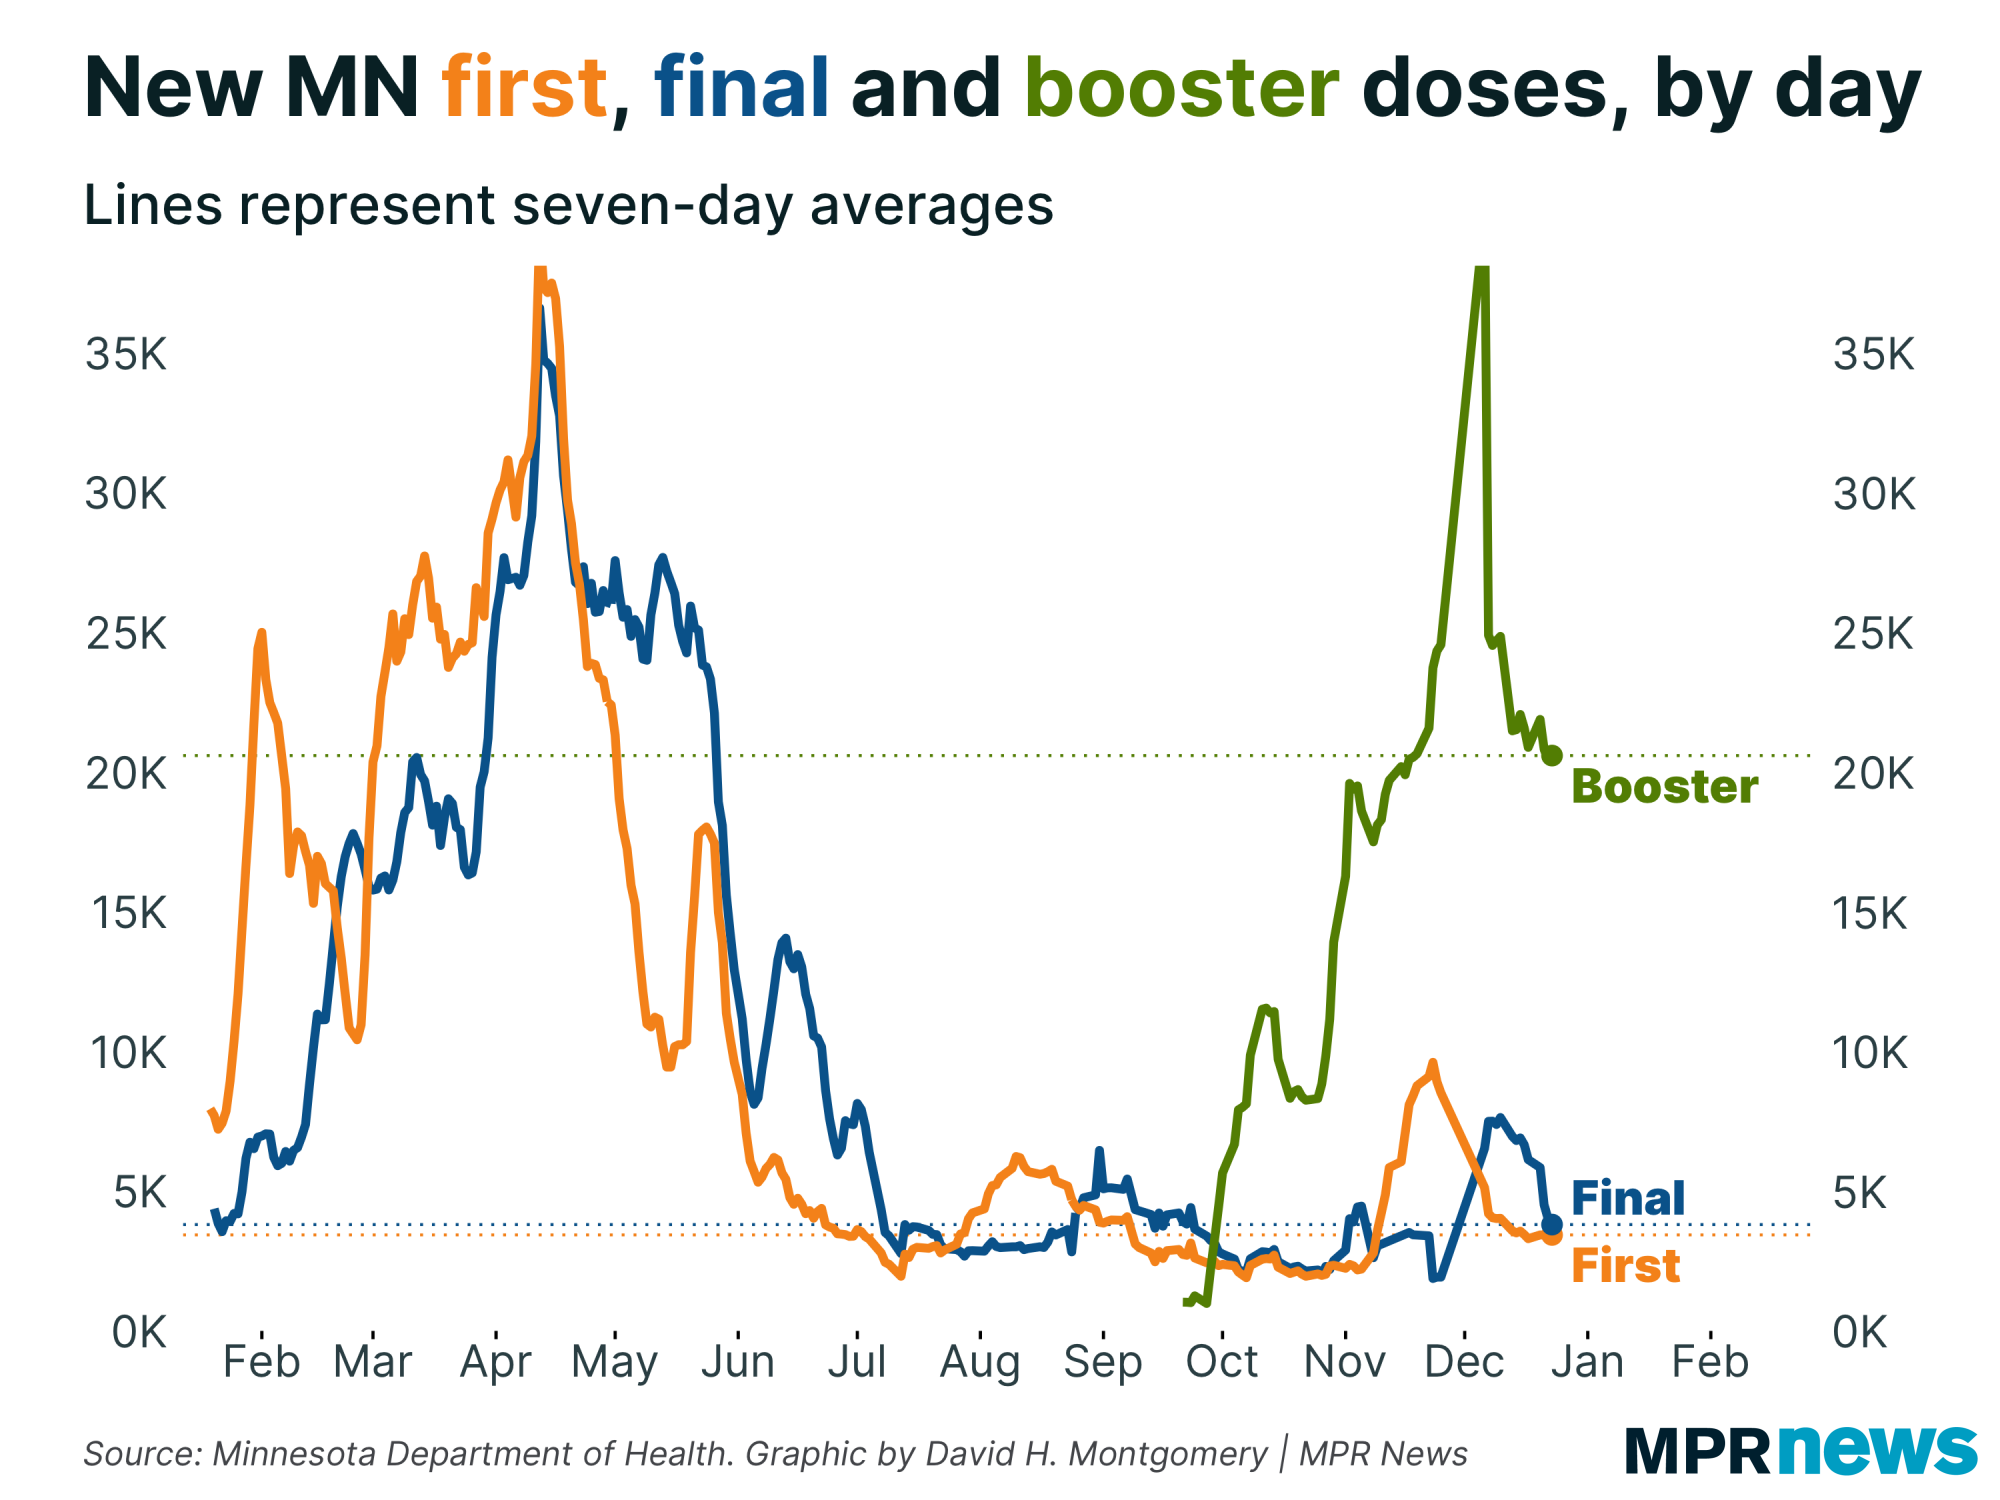
| Vaccination status on the eve of Christmas | | Around 71 percent of all Minnesotans have at least one does of COVID-19 vaccine. 65 percent are fully vaccinated, and 28 percent have a booster shot. |
| |
|
|
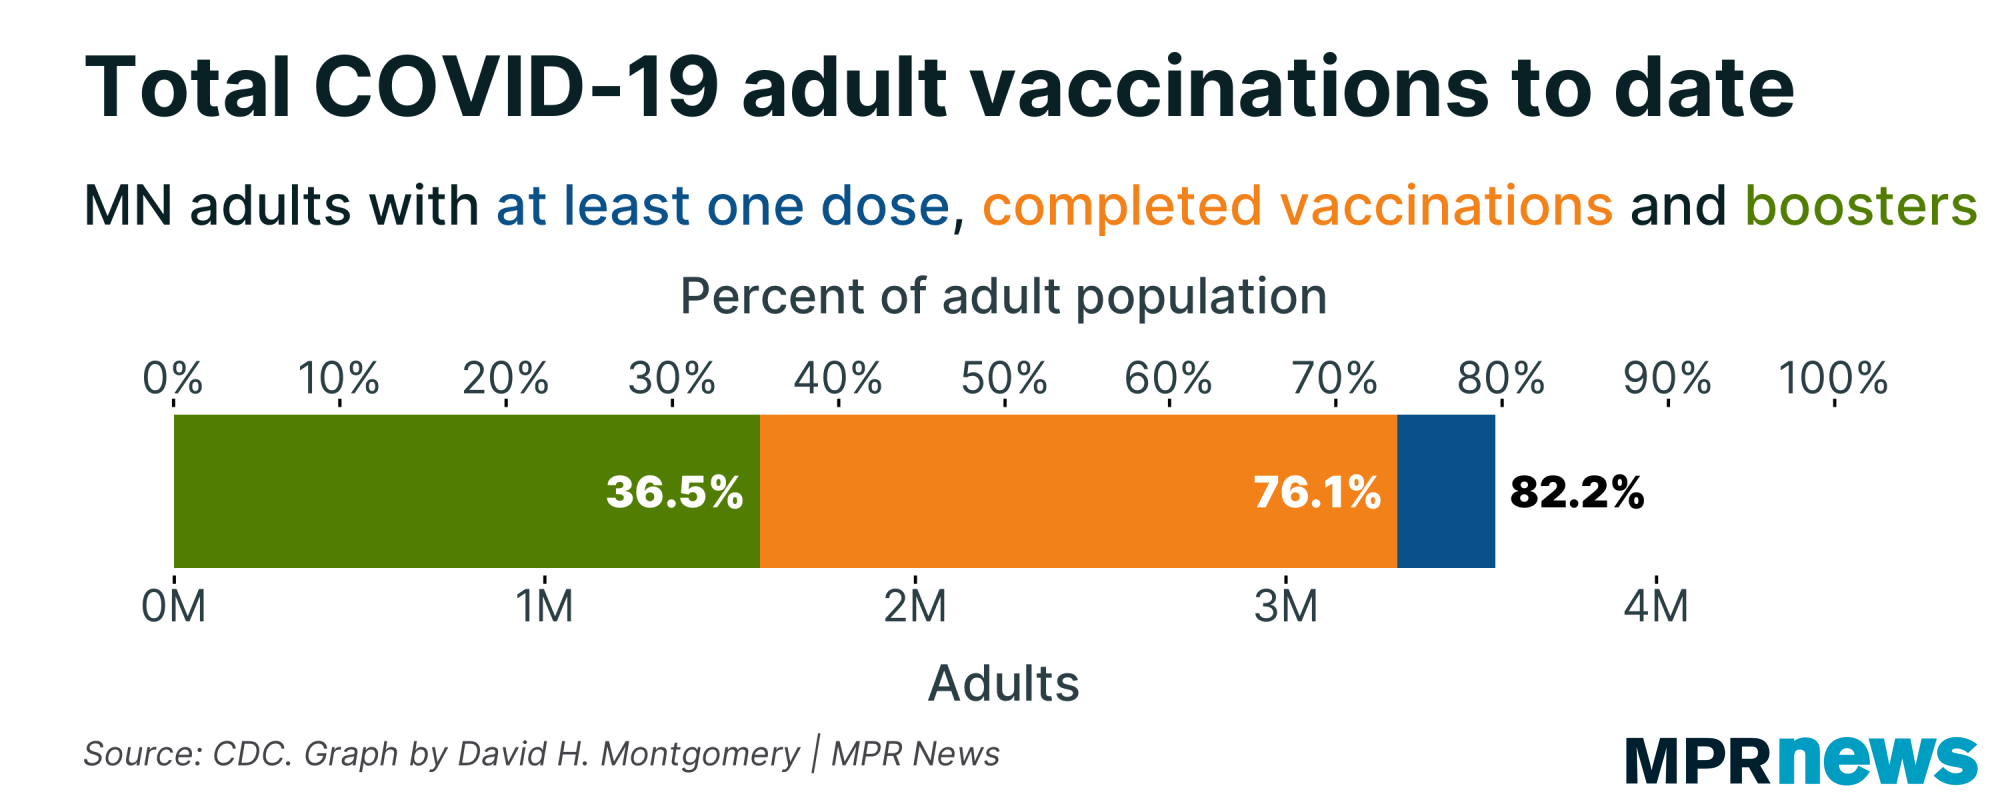
| Of course, more than 6 percent of the state are children under 5 who are ineligible to be vaccinated, and another 9 percent are children 5-11 who became eligible for vaccination relatively recently. About 75 percent of Minnesotans 12 or older are fully vaccinated; rates for adults 18 or older are slightly higher still. | |
|
|
|
| Overall, vaccination rates have largely leveled off with booster volume remaining fairly high. | | |
|
|
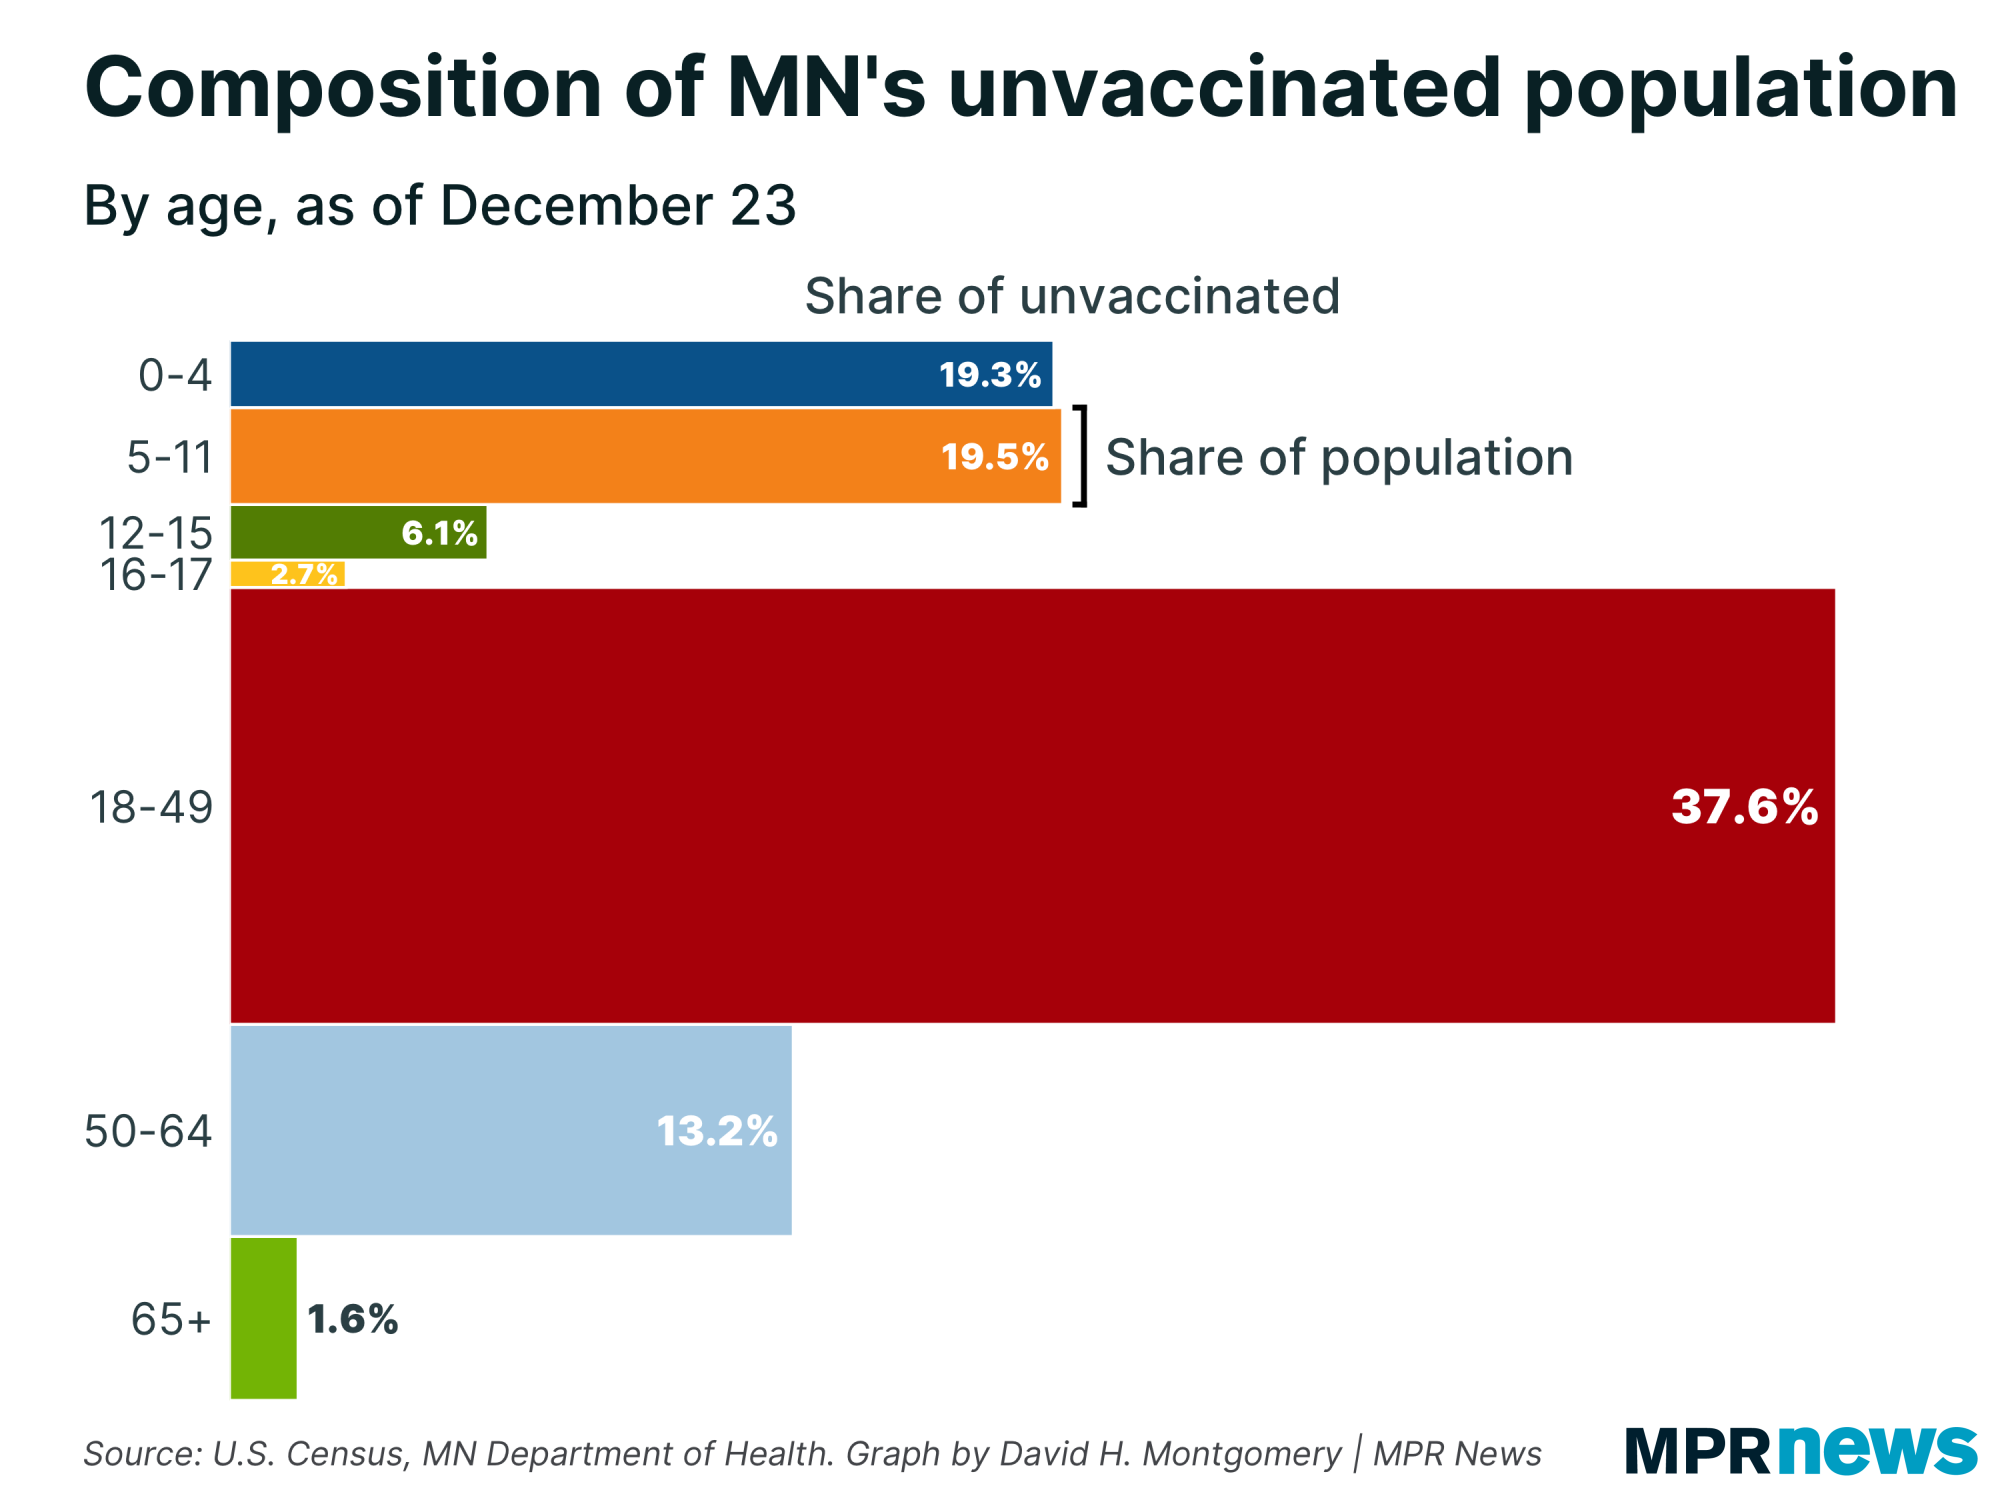
| In total there are about 1.8 million unvaccinated Minnesotans. Around 350,000 of these are ineligible kids under 5. Just 29,000 are seniors. The lion's share of unvaccinated Minnesotans now are working-age adults. | | |
|
|
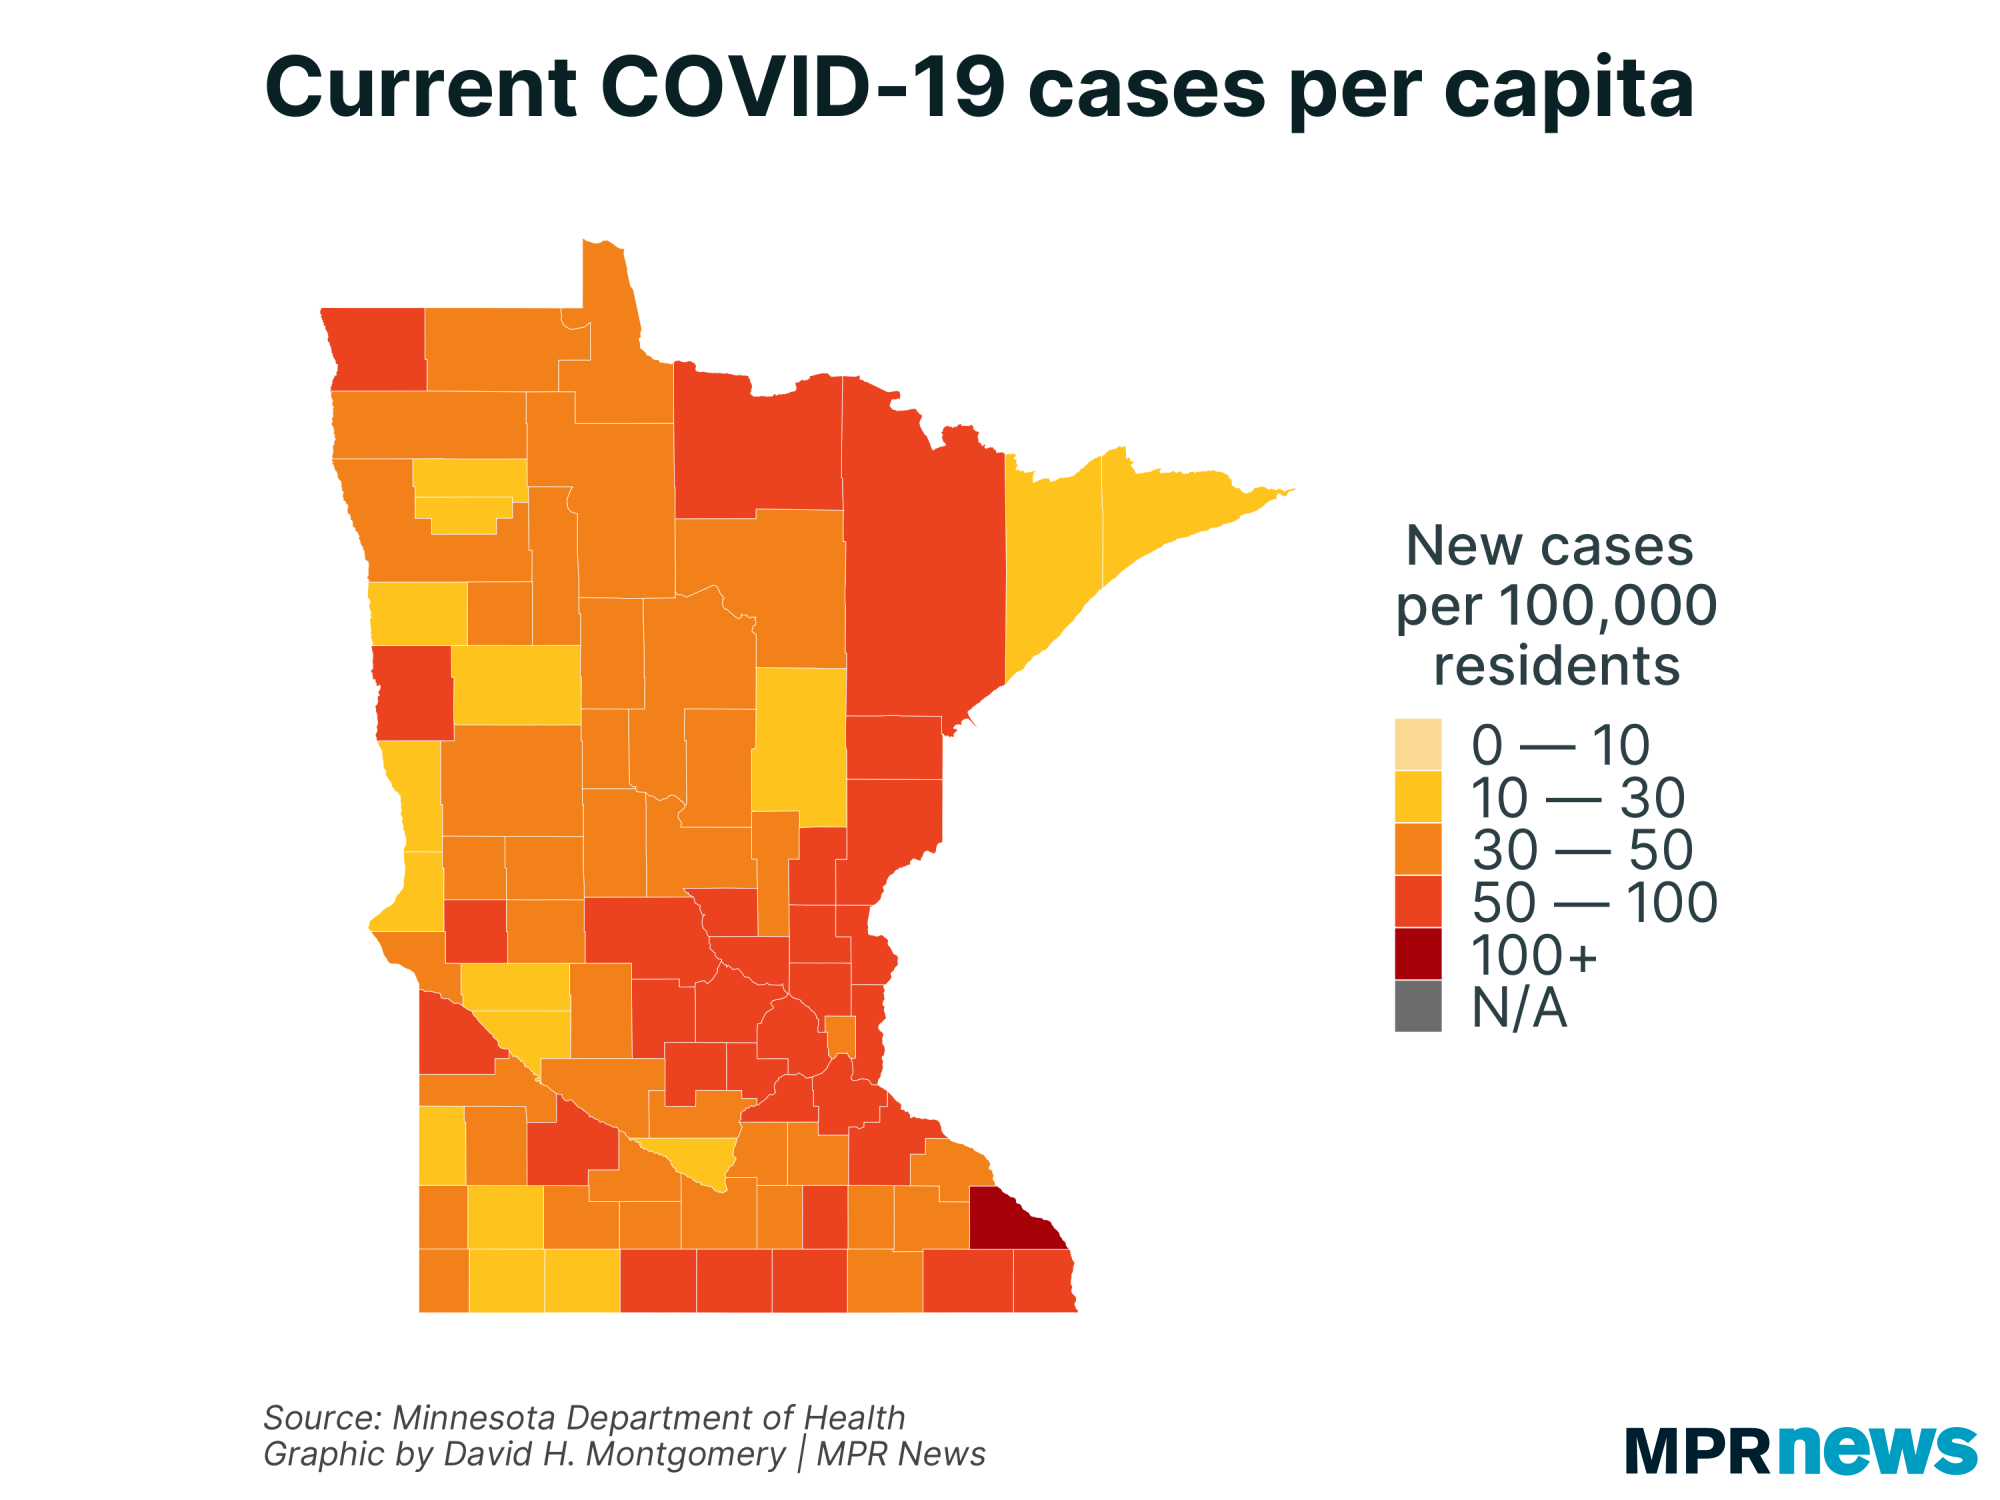
Western Minnesota seeing biggest case plunged
| | If you look at where COVID-19 cases are least prevalent, the answer is clear: rural counties in western Minnesota. |
| |
|
|
There are exceptions, but the east-west split here is clear.
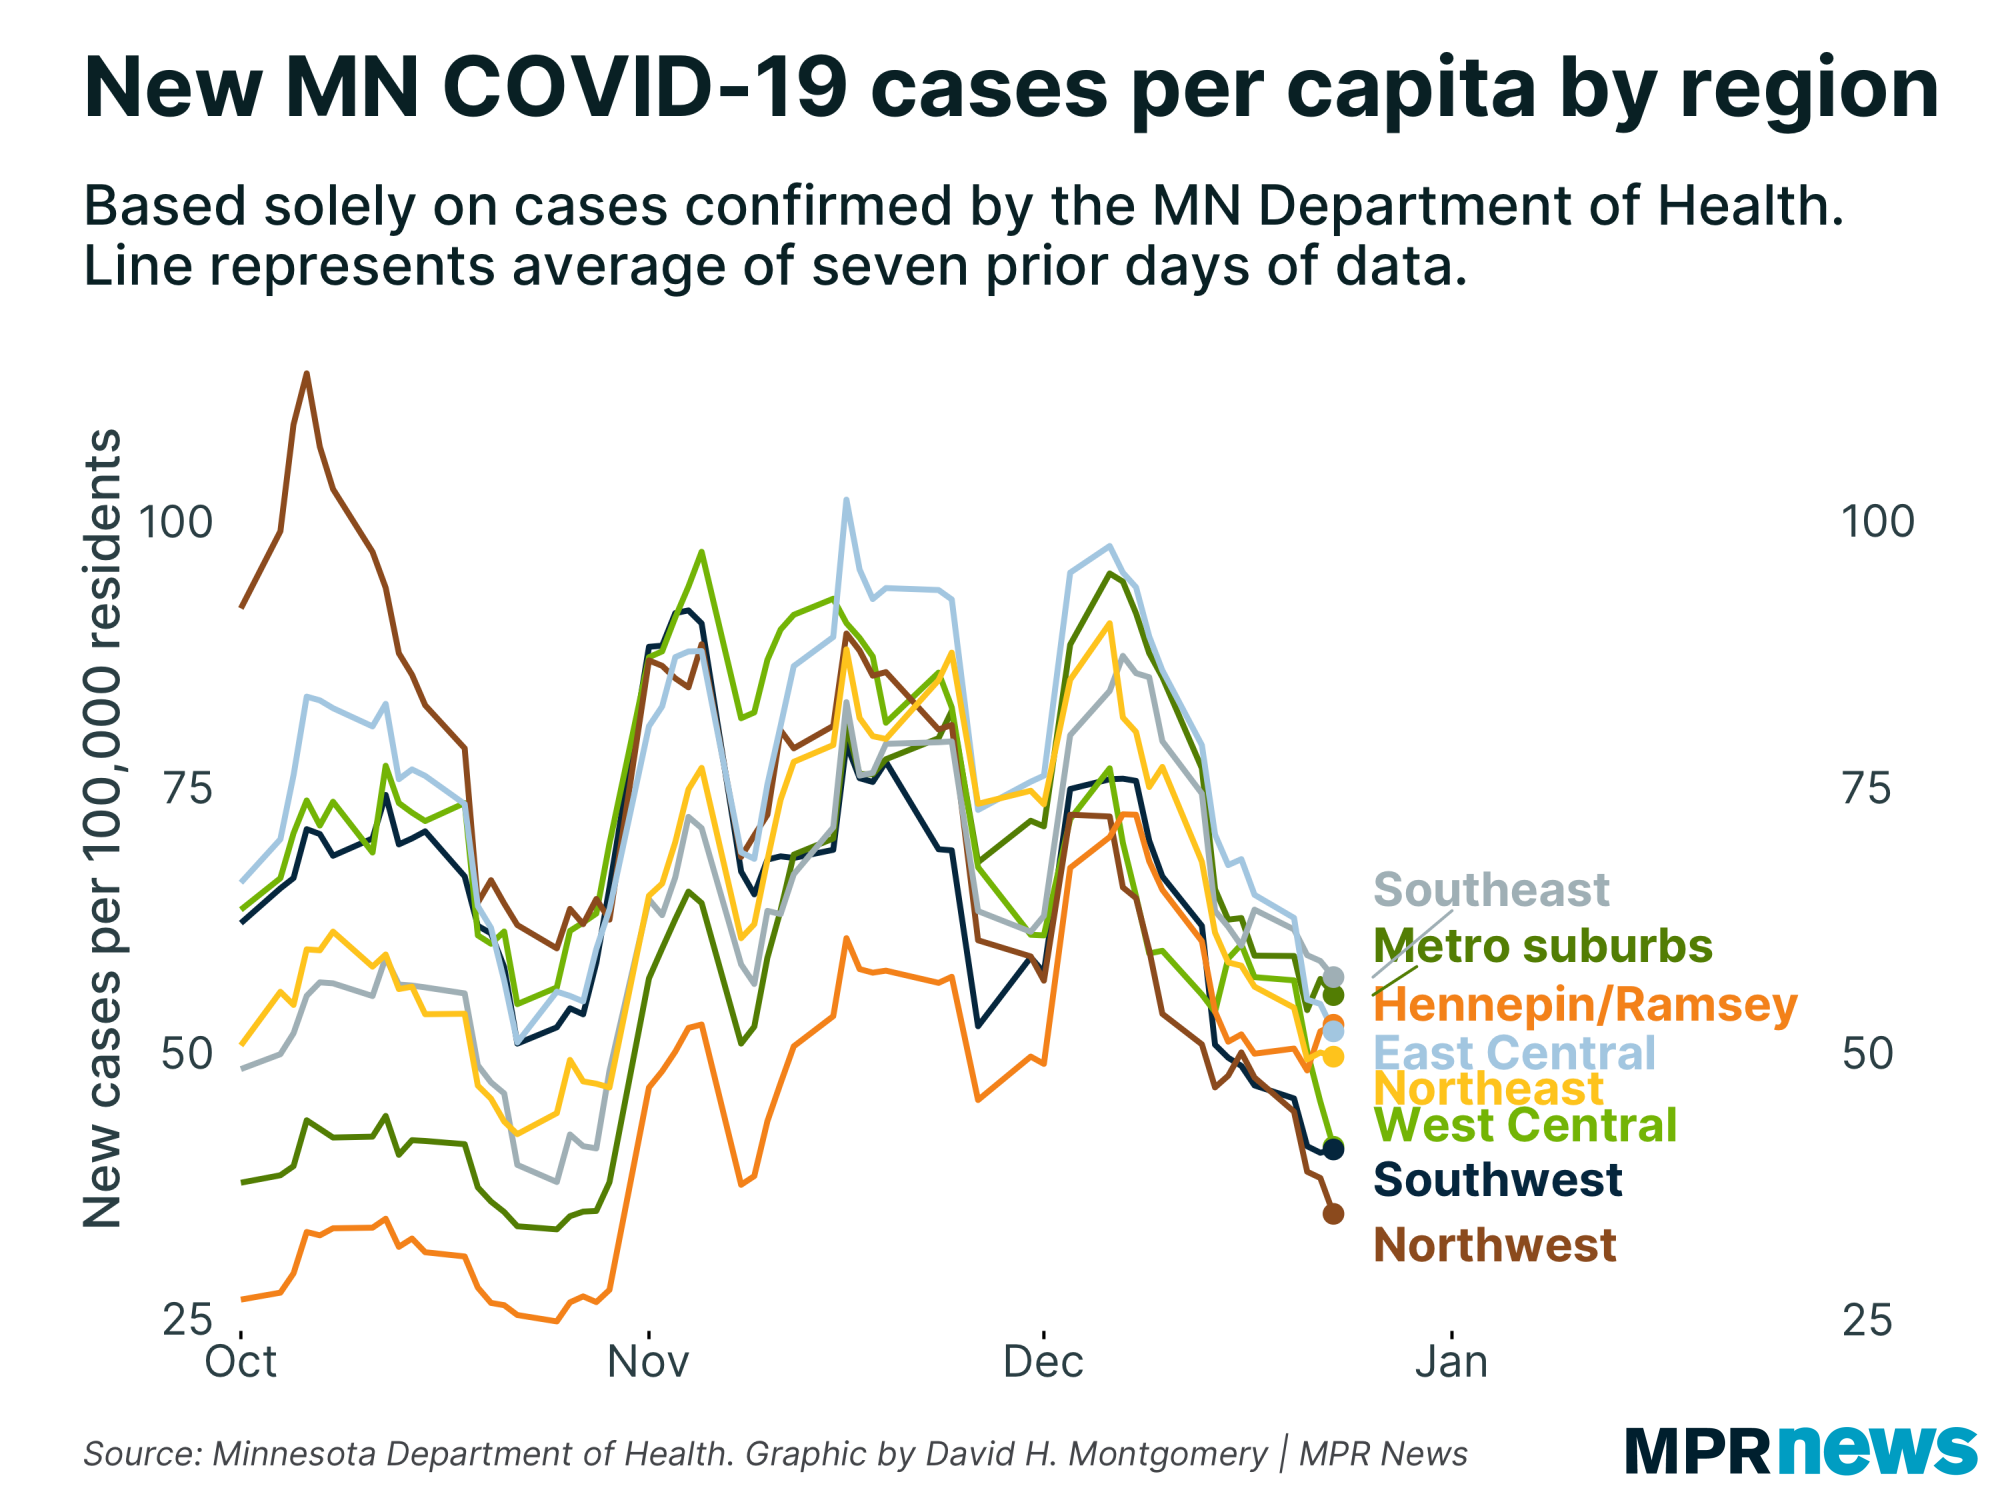
When you group by regions, as I like to do, you can see that all three of my western Minnesota regions have low and sharply falling case counts. | | |
|
|
What's particularly worth paying attention to here is that none of these regions are spiking. (Hennepin and Ramsey counties have recorded a minor uptick the last two days, but nothing big.)
Theoretically, Minnesota could record an omicron spike in one part of the state that could be masked in our overall data because of falling case counts everywhere. But so far, that doesn't appear to be happening in the data we have. |
| |
|
|
What's happening next?
|
If Minnesota's COVID-19 trends do change in the coming weeks, it could be difficult to tell. There will be no data reported on either Friday Dec. 24 or Friday Dec. 31, due to the holidays. That means big catch-up days the following week. All of that will throw off our seven-day averages, and could create phantom bumps or falls in the data.
Sample-date data will be more reliable, but this lags by a few days, and so can't catch big spikes as quickly. As always, I'll do my best to sort through it for you all.
Thanks for subscribing to this newsletter and for all of you who've sent me your feedback. As always, if you like this newsletter, please share it and the sign-up link with others who you think might enjoy it.
— David |
| |
|
|
%%[ if _MessageContext != "VAWP" then ]%%
Preference Center ❘ Unsubscribe You received this email because you subscribed or it was sent to you by a friend. This email was sent by: %%Member_Busname%%
%%Member_Addr%% %%Member_City%%, %%Member_State%%, %%Member_PostalCode%%
  |
%%[ endif ]%% |
|
| | |