%%[ SET @ViewURL = view_email_url
SET @ListID = ListID SET @SubChecker = _subscriberkey SET @EmailName = EmailName_ if @SubChecker == "ask@mpr.org" then insertde('ENT.newsletter_archive_2','VAWPURL',@ViewURL,'SubscriberKey',
@SubChecker,'EmailName',@EmailName,'Date',NOW(),'ListID',@ListID) ELSE endif ]%% |
%%[ if _MessageContext != "VAWP" then ]%% %%[ endif ]%% |
| Welcome back to COVID in Minnesota TODAY, an email newsletter from MPR News about understanding the latest developments in Minnesota's COVID-19 outbreak. | | |
|
|
Happy New Year, everyone! Though the fact that we're now in our third calendar year of this newsletter is not perhaps the happiest thought for anyone.
One thing is indisputable right now: Minnesota is seeing case counts and positivity rates shoot up.
What's less certain is what's behind that increase. There are two possibilities:
- A temporary bump driven by holiday gatherings, like we saw after Thanksgiving
- A huge spike driven by the new highly contagious omicron variant, as many other states and countries have seen in the past month
Both are surely having some effect. But I've been cautious about deciding which one is dominant right now — until today. Right now, I'm pretty sure that Minnesota is seeing the early stages of a significant omicron surge. I'll explain why I think this below. | | |
|
|
Three things to know
| - Cases are rising dramatically in recent days
- This could be a holiday bump, but its geographic concentration in the Twin Cities suggests this might be an omicron-fueled spike
- 2021 was nearly as deadly a year in Minnesota as 2020 was, with protection from vaccines battling against deadlier virus variants
|
| |
|
|
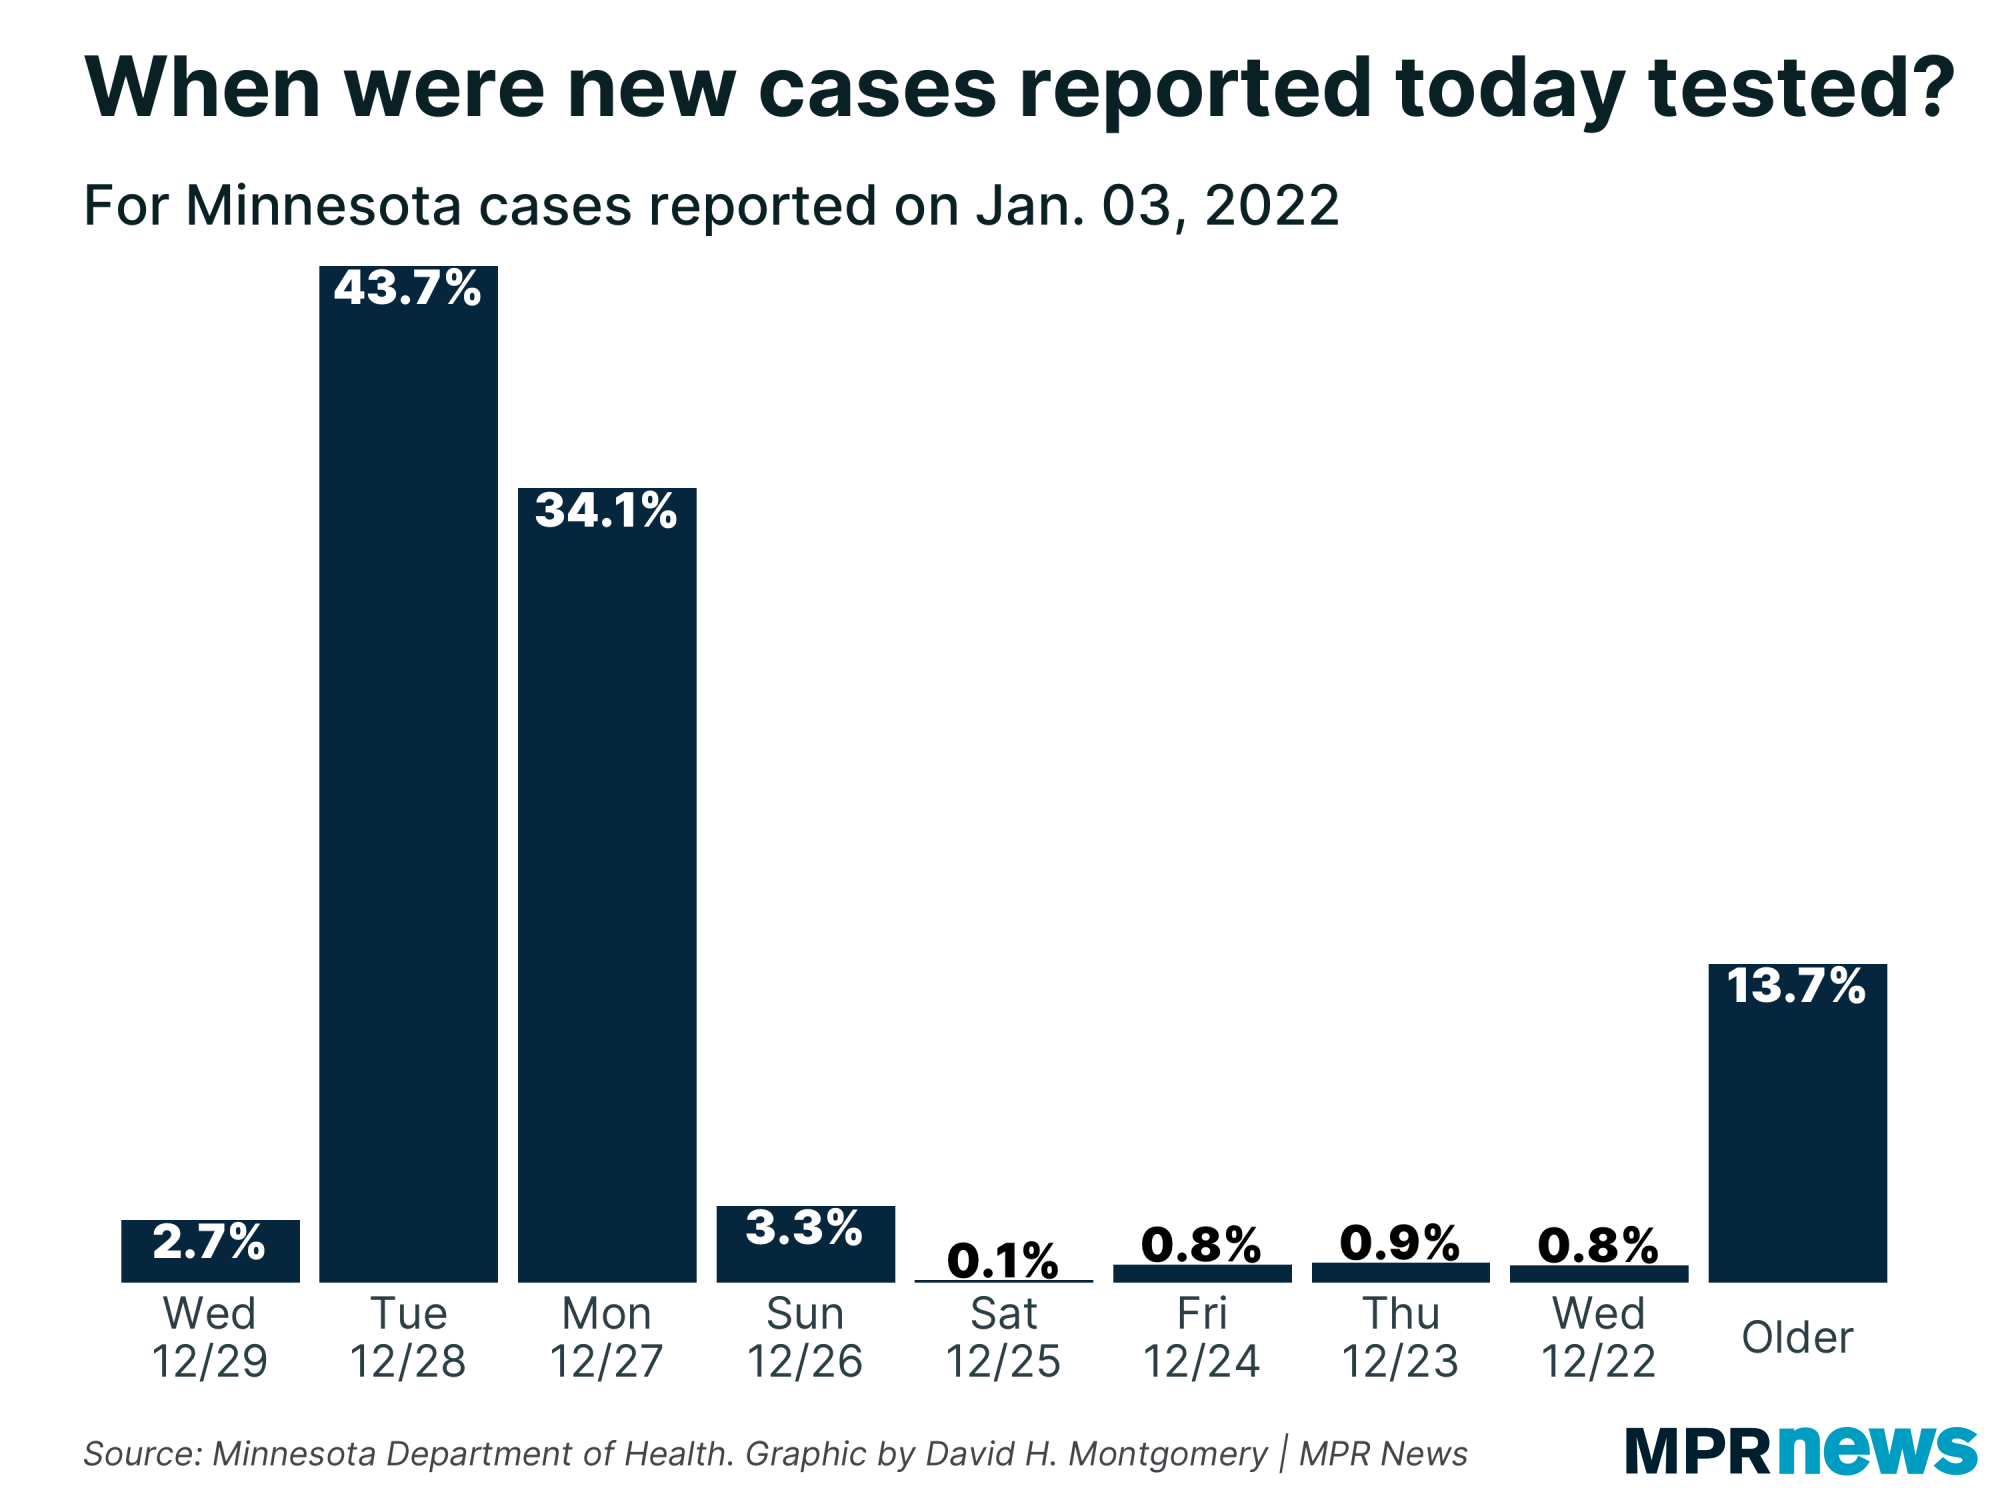
I'll start off with a caveat: Most of our data about COVID-19 in Minnesota right now is about a week out of date. You take our normal lag of a few days, then add to that disruption from the holidays. Today's report was actually the report we'd have ordinarily gotten on Friday, had Friday not been New Year's Eve. Tomorrow we'll get a giant report with four days of data in one.
That means almost all the new cases in today's report are actually from tests conducted last Monday and Tuesday. These are showing where we were right after Christmas (or older!), not where we are today. |
| |
|
|
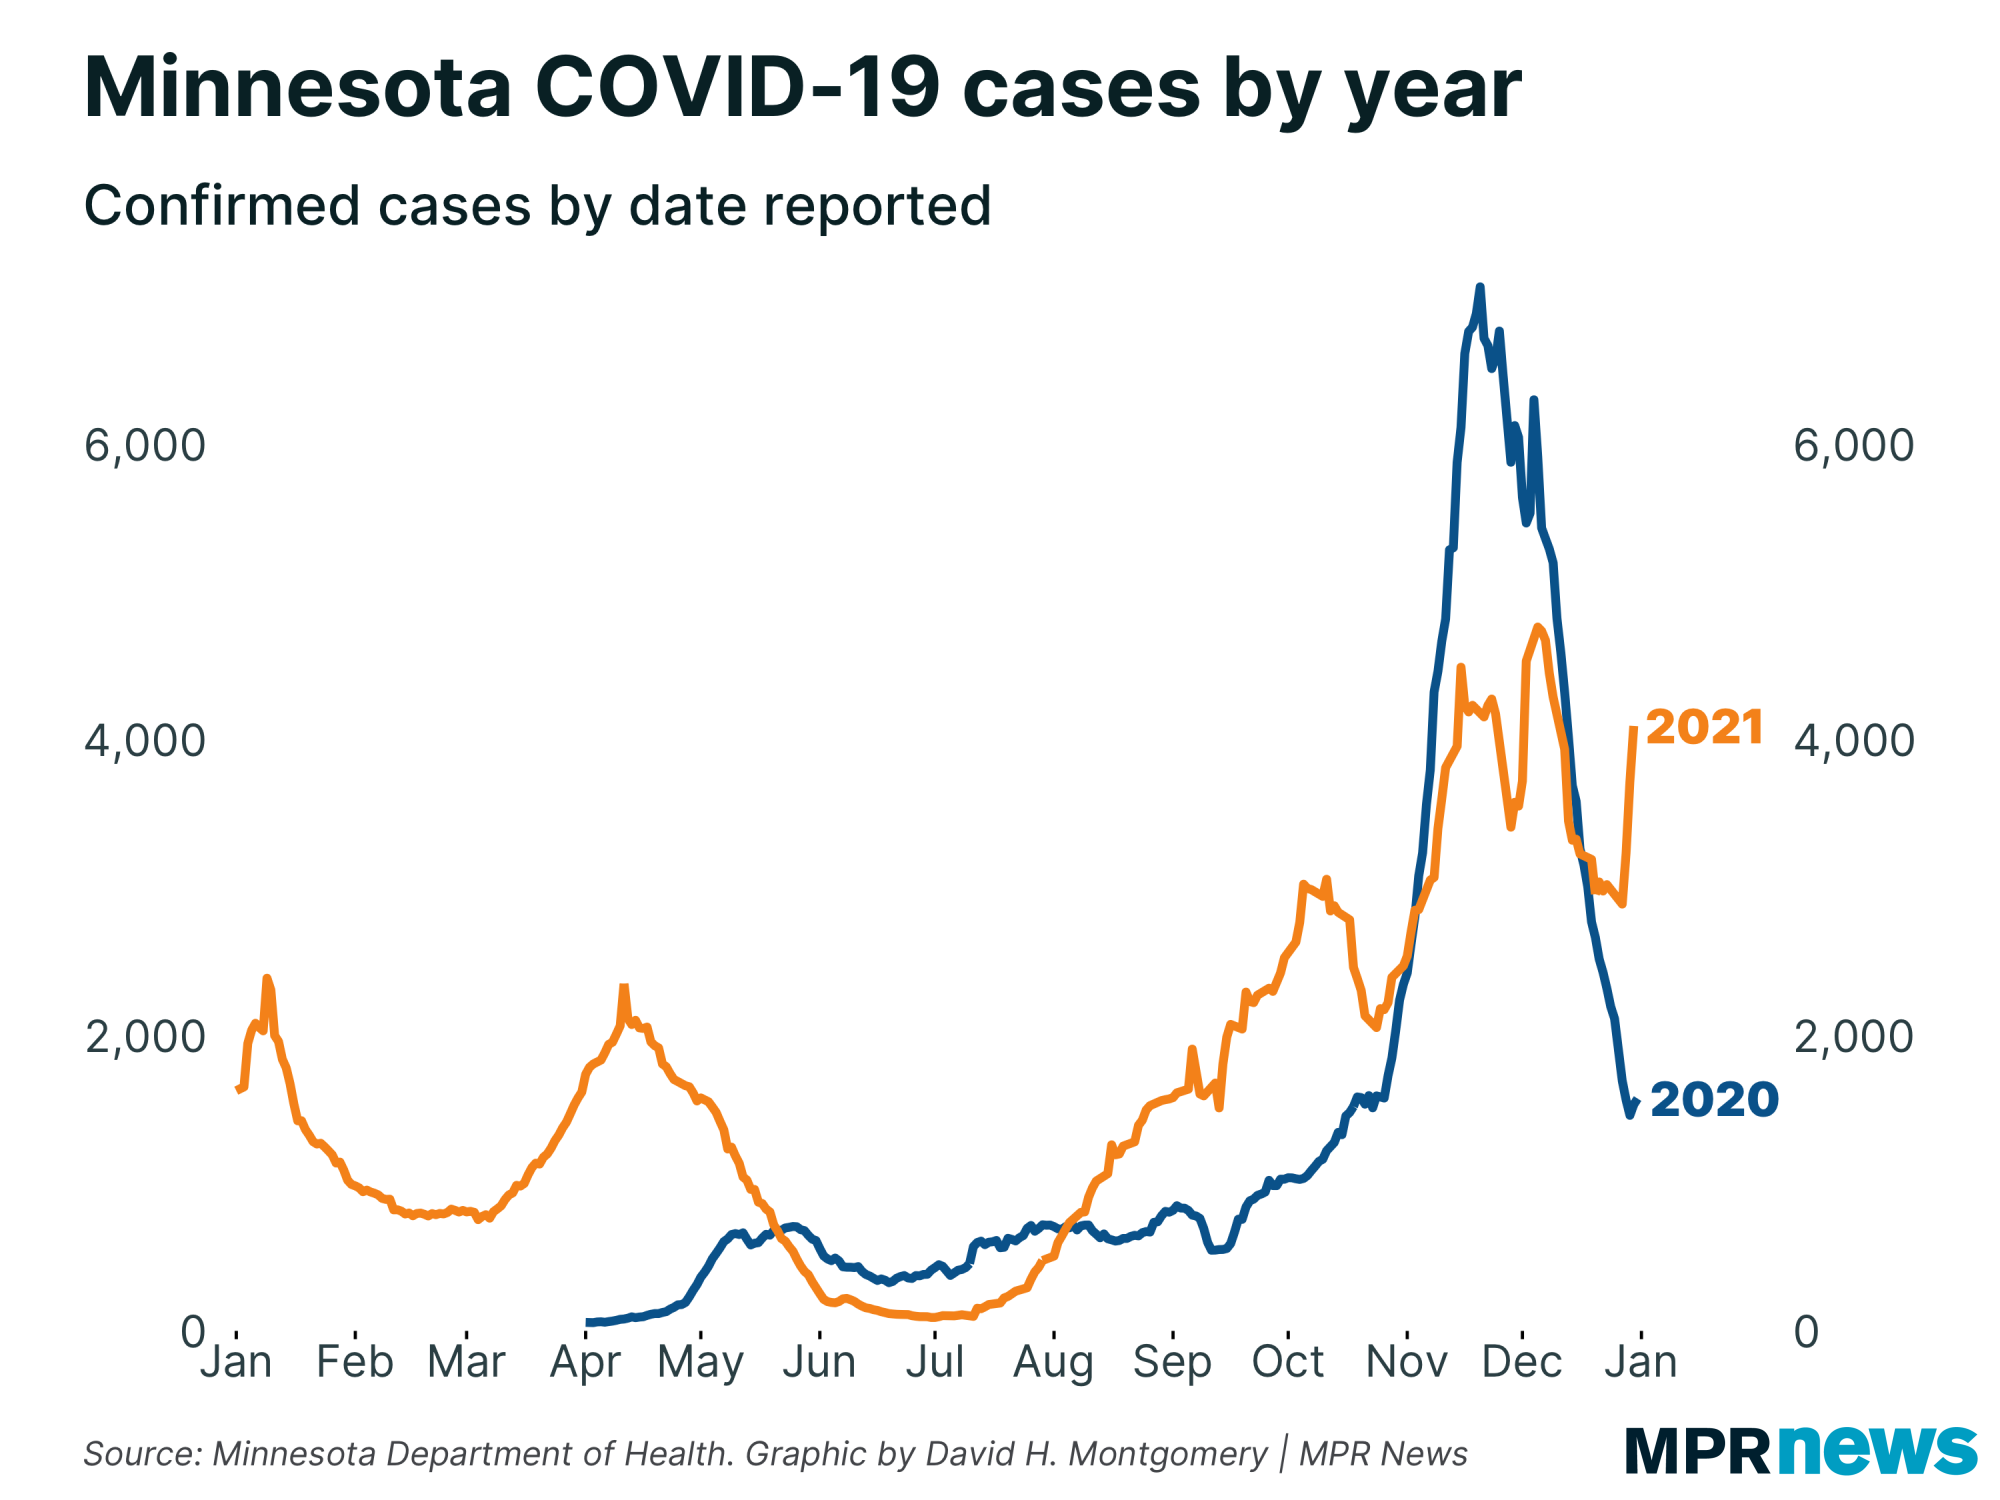
| That said, what this lagged data — which doesn't really get into 2022 year — shows is a sharp uptick in confirmed cases: | | |
|
|
This happened in just three reports — our rolling average hit a low of about 2,900 cases per day in last Tuesday's report, then rose to 3,200 on Wednesday, 3,700 on Thursday, and 4,100 in today's report (which is really Friday's). Three days isn't terribly long to declare something a trend, but this is of a significant magnitude.
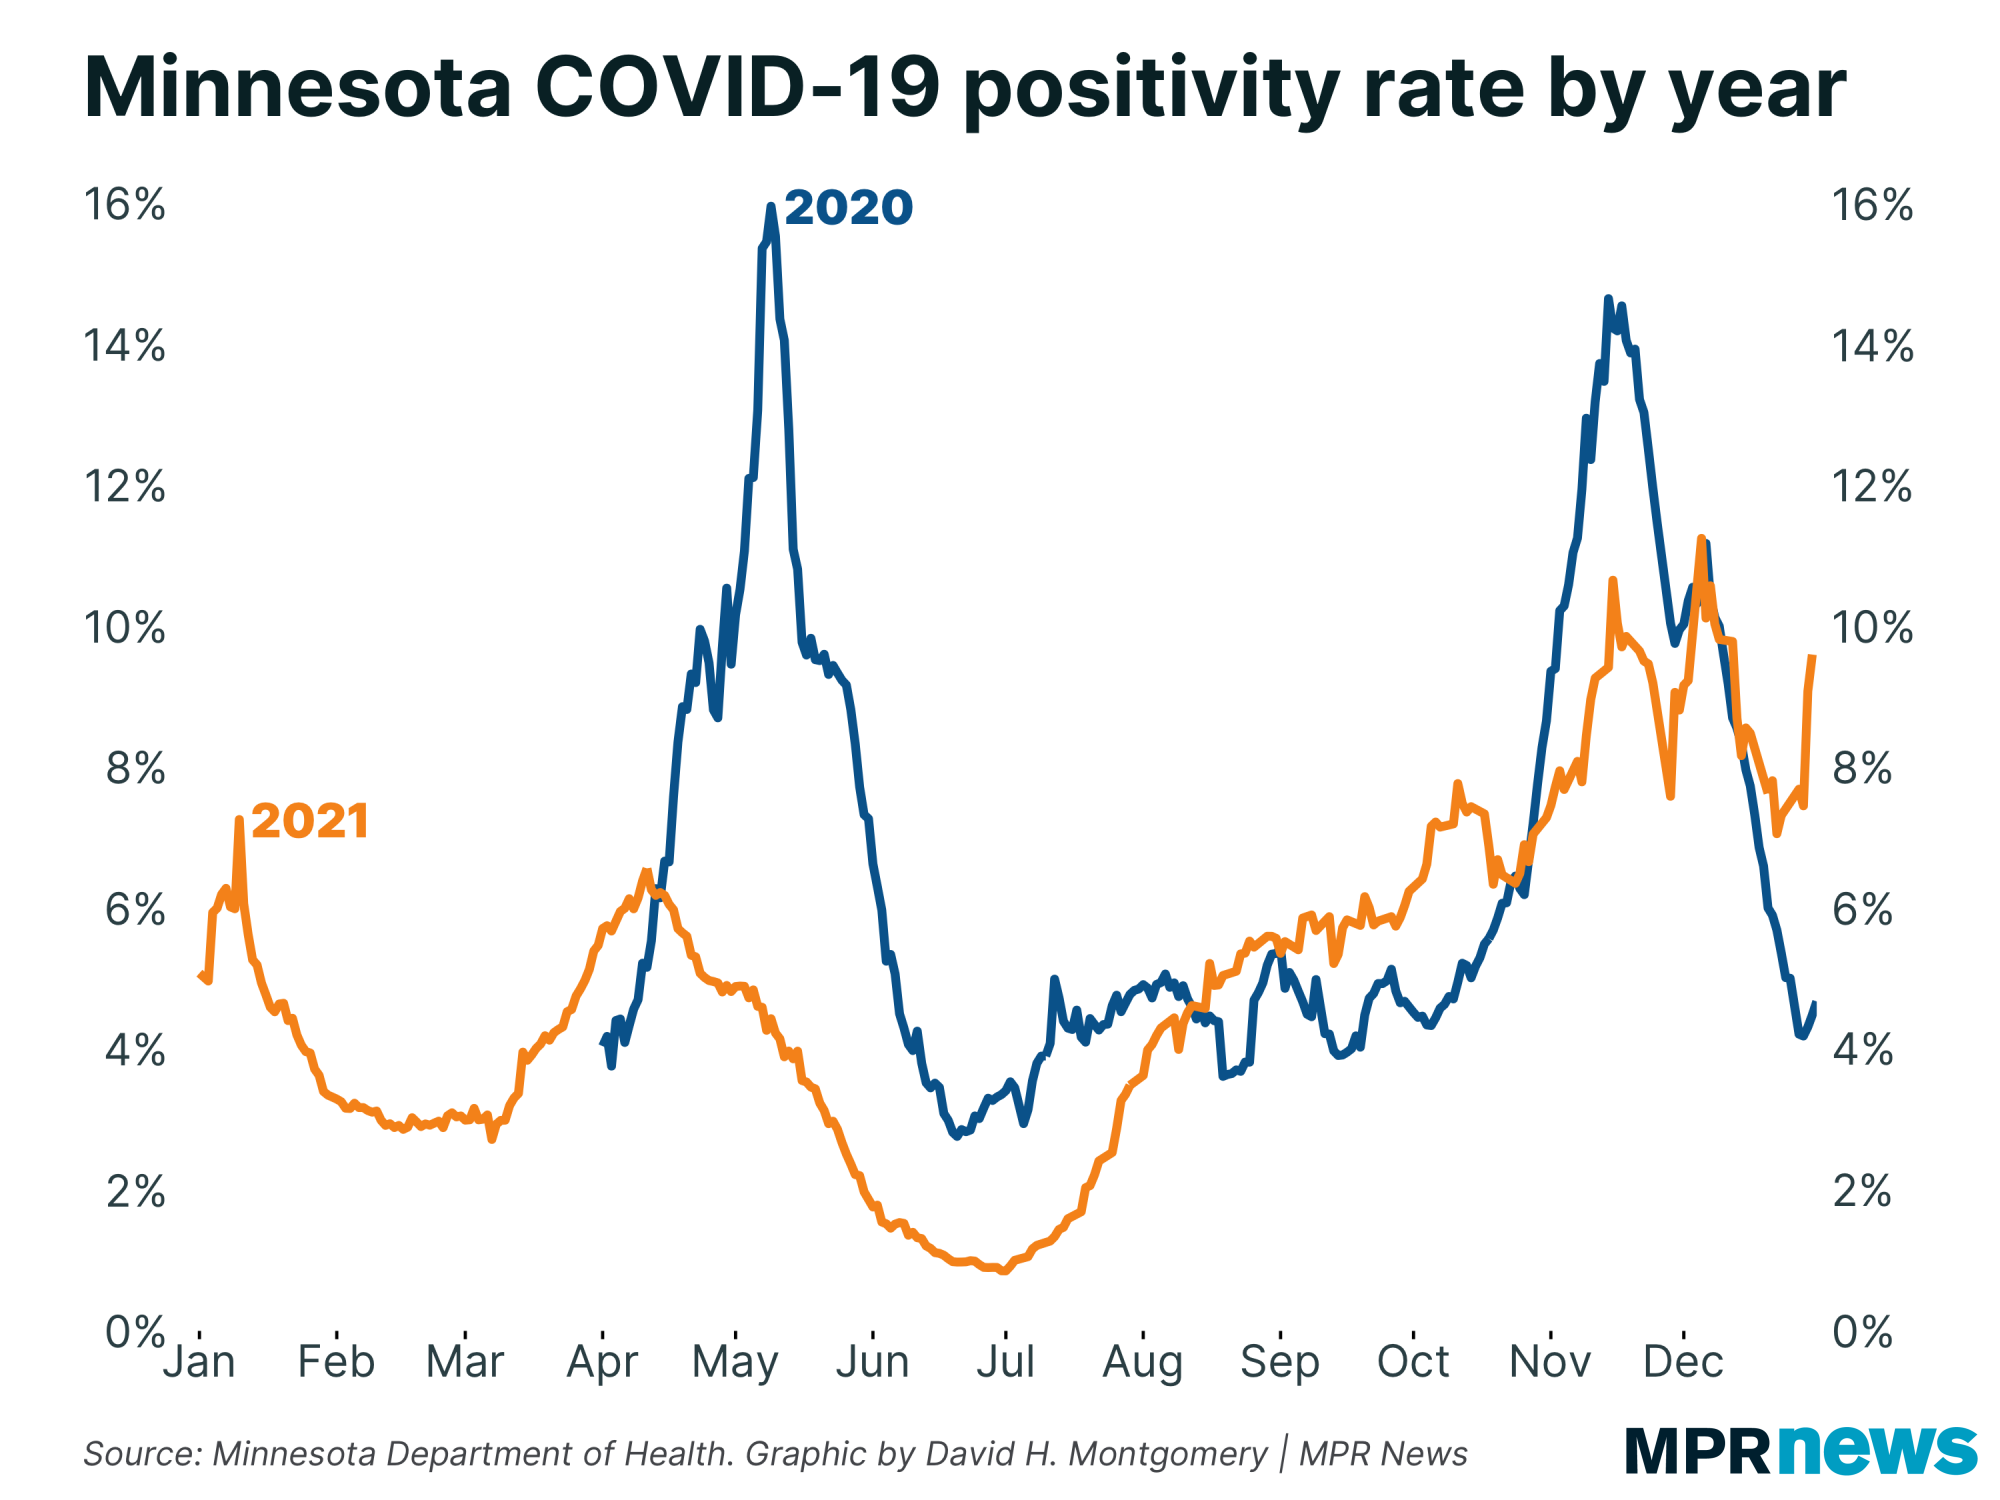
It also doesn't appear to be a data artifact, either. We see the same upward spike in positivity rate: |
| |
|
|
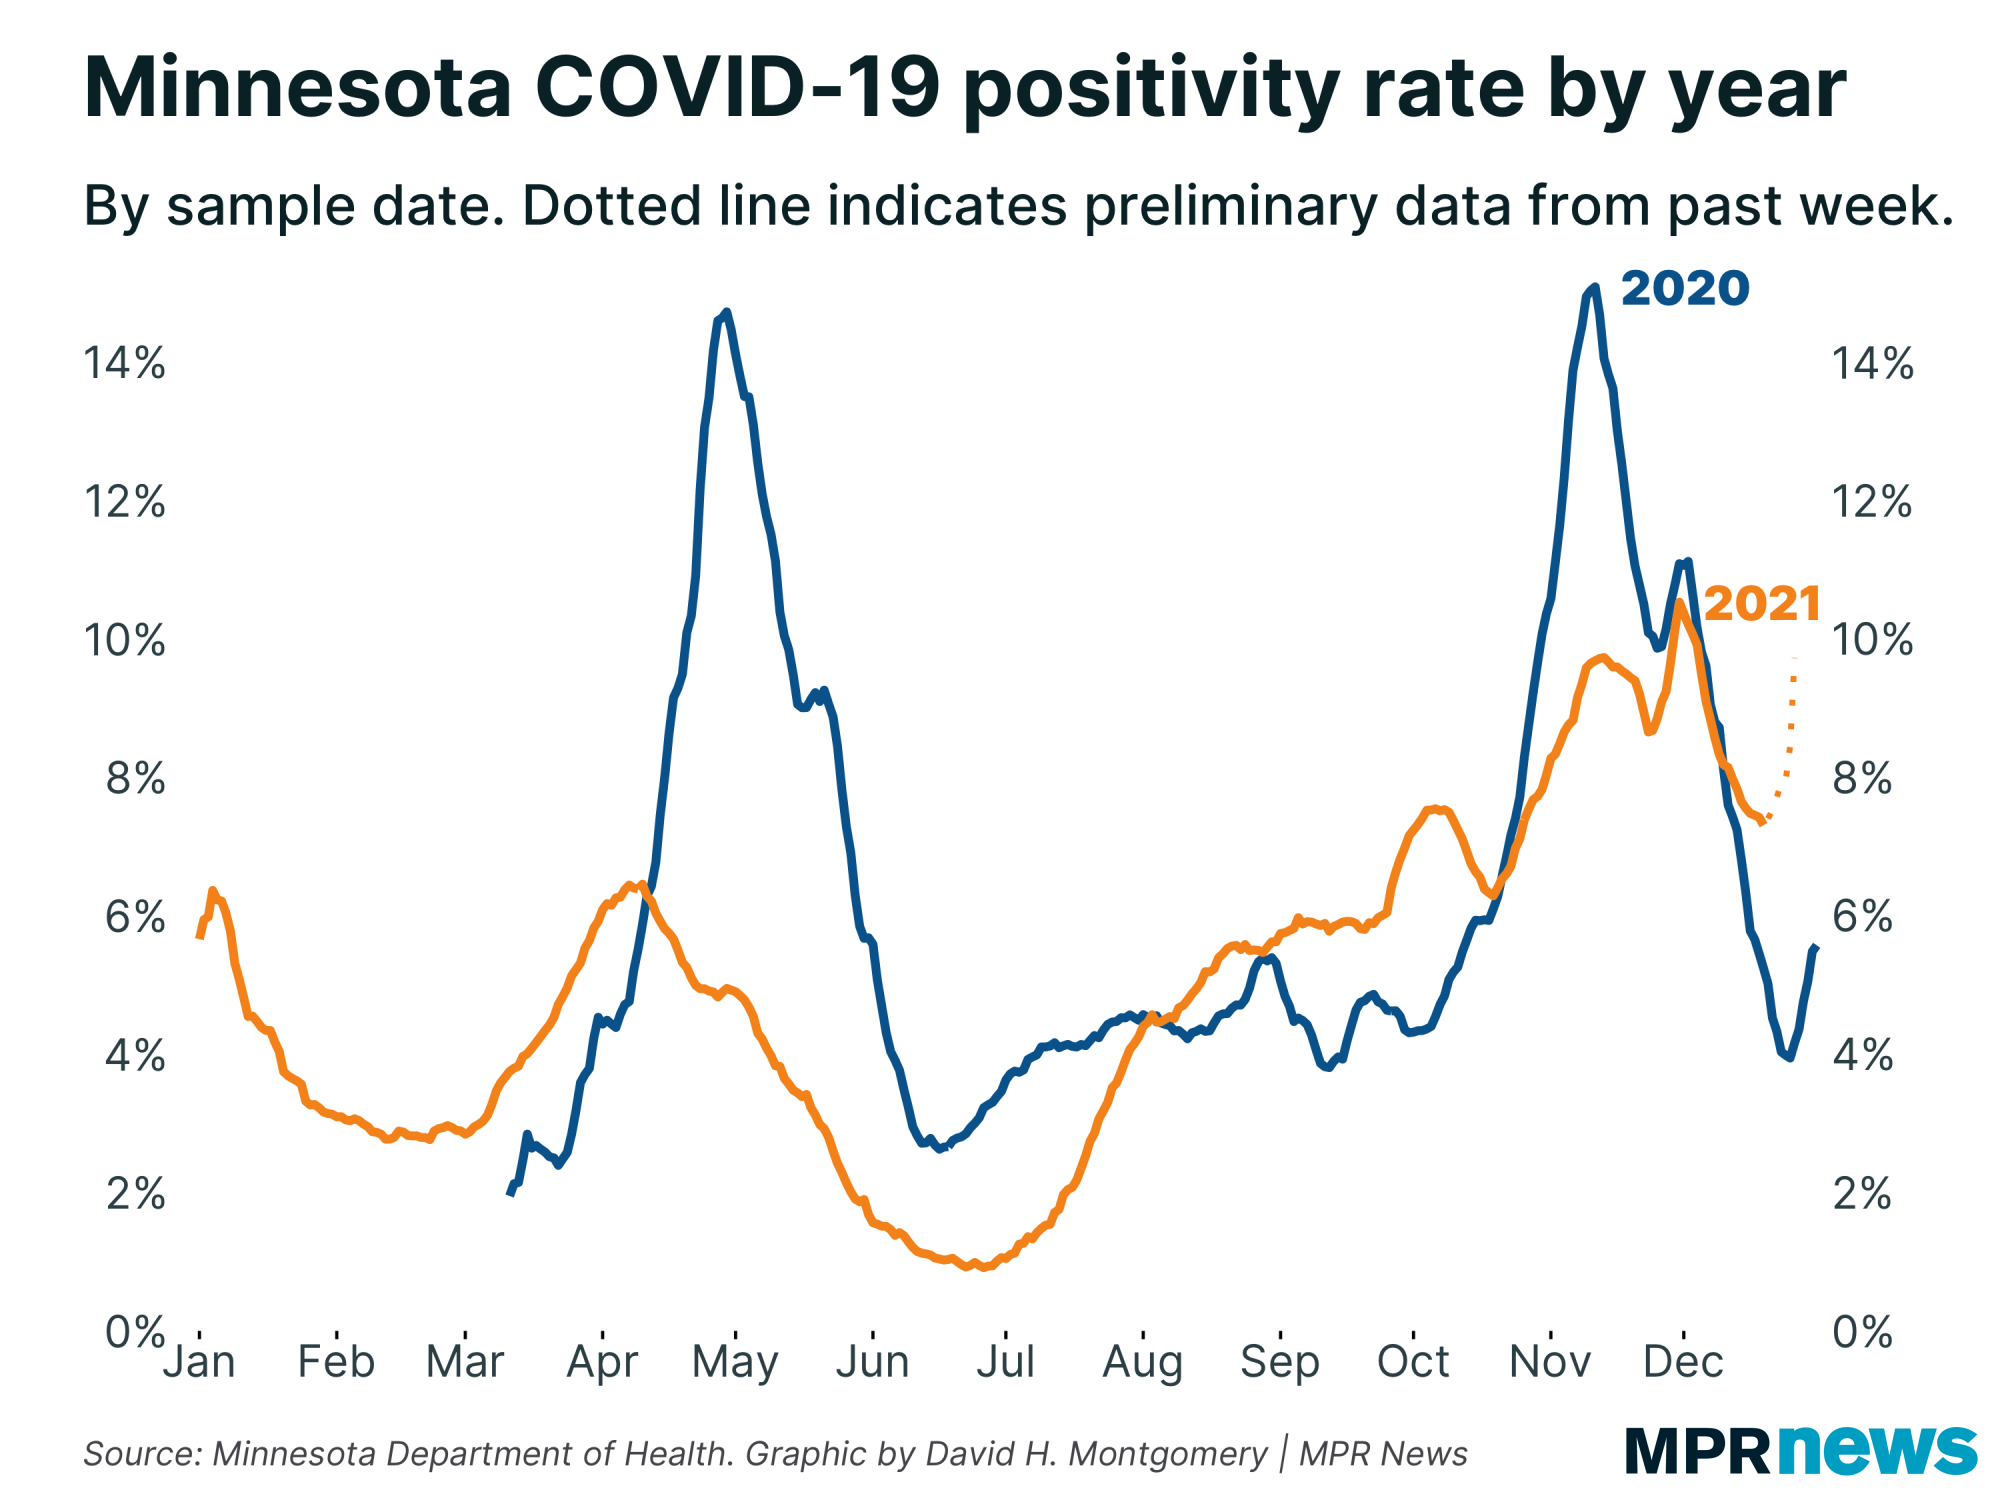
| One silver lining to our reporting delays: For once our sample-date data, with its one-week lag, isn't significantly more out-of-date than report-date data. And positivity rate by sample date tells the same story. | | |
|
|
So the argument for this being a holiday spike is in the above chart. As you can see, Minnesota's positivity rate by sample date spiked at the end of December 2020, and it appears to have spiked at the end of December 2021. We're spiking a couple of days earlier here, but it's pretty similar. (You want to look at sample-date data for this, because the Minnesota Department of Health's reporting practices aren't necessarily identical to a year ago.)
The holiday is certainly a part of this, and once data from New Year's shows up, late this week or early next week, that will likely contribute to a further bump. But here's why I'm now leaning to believing that an omicron surge is behind what we're seeing now, in one chart: |
| |
|
|
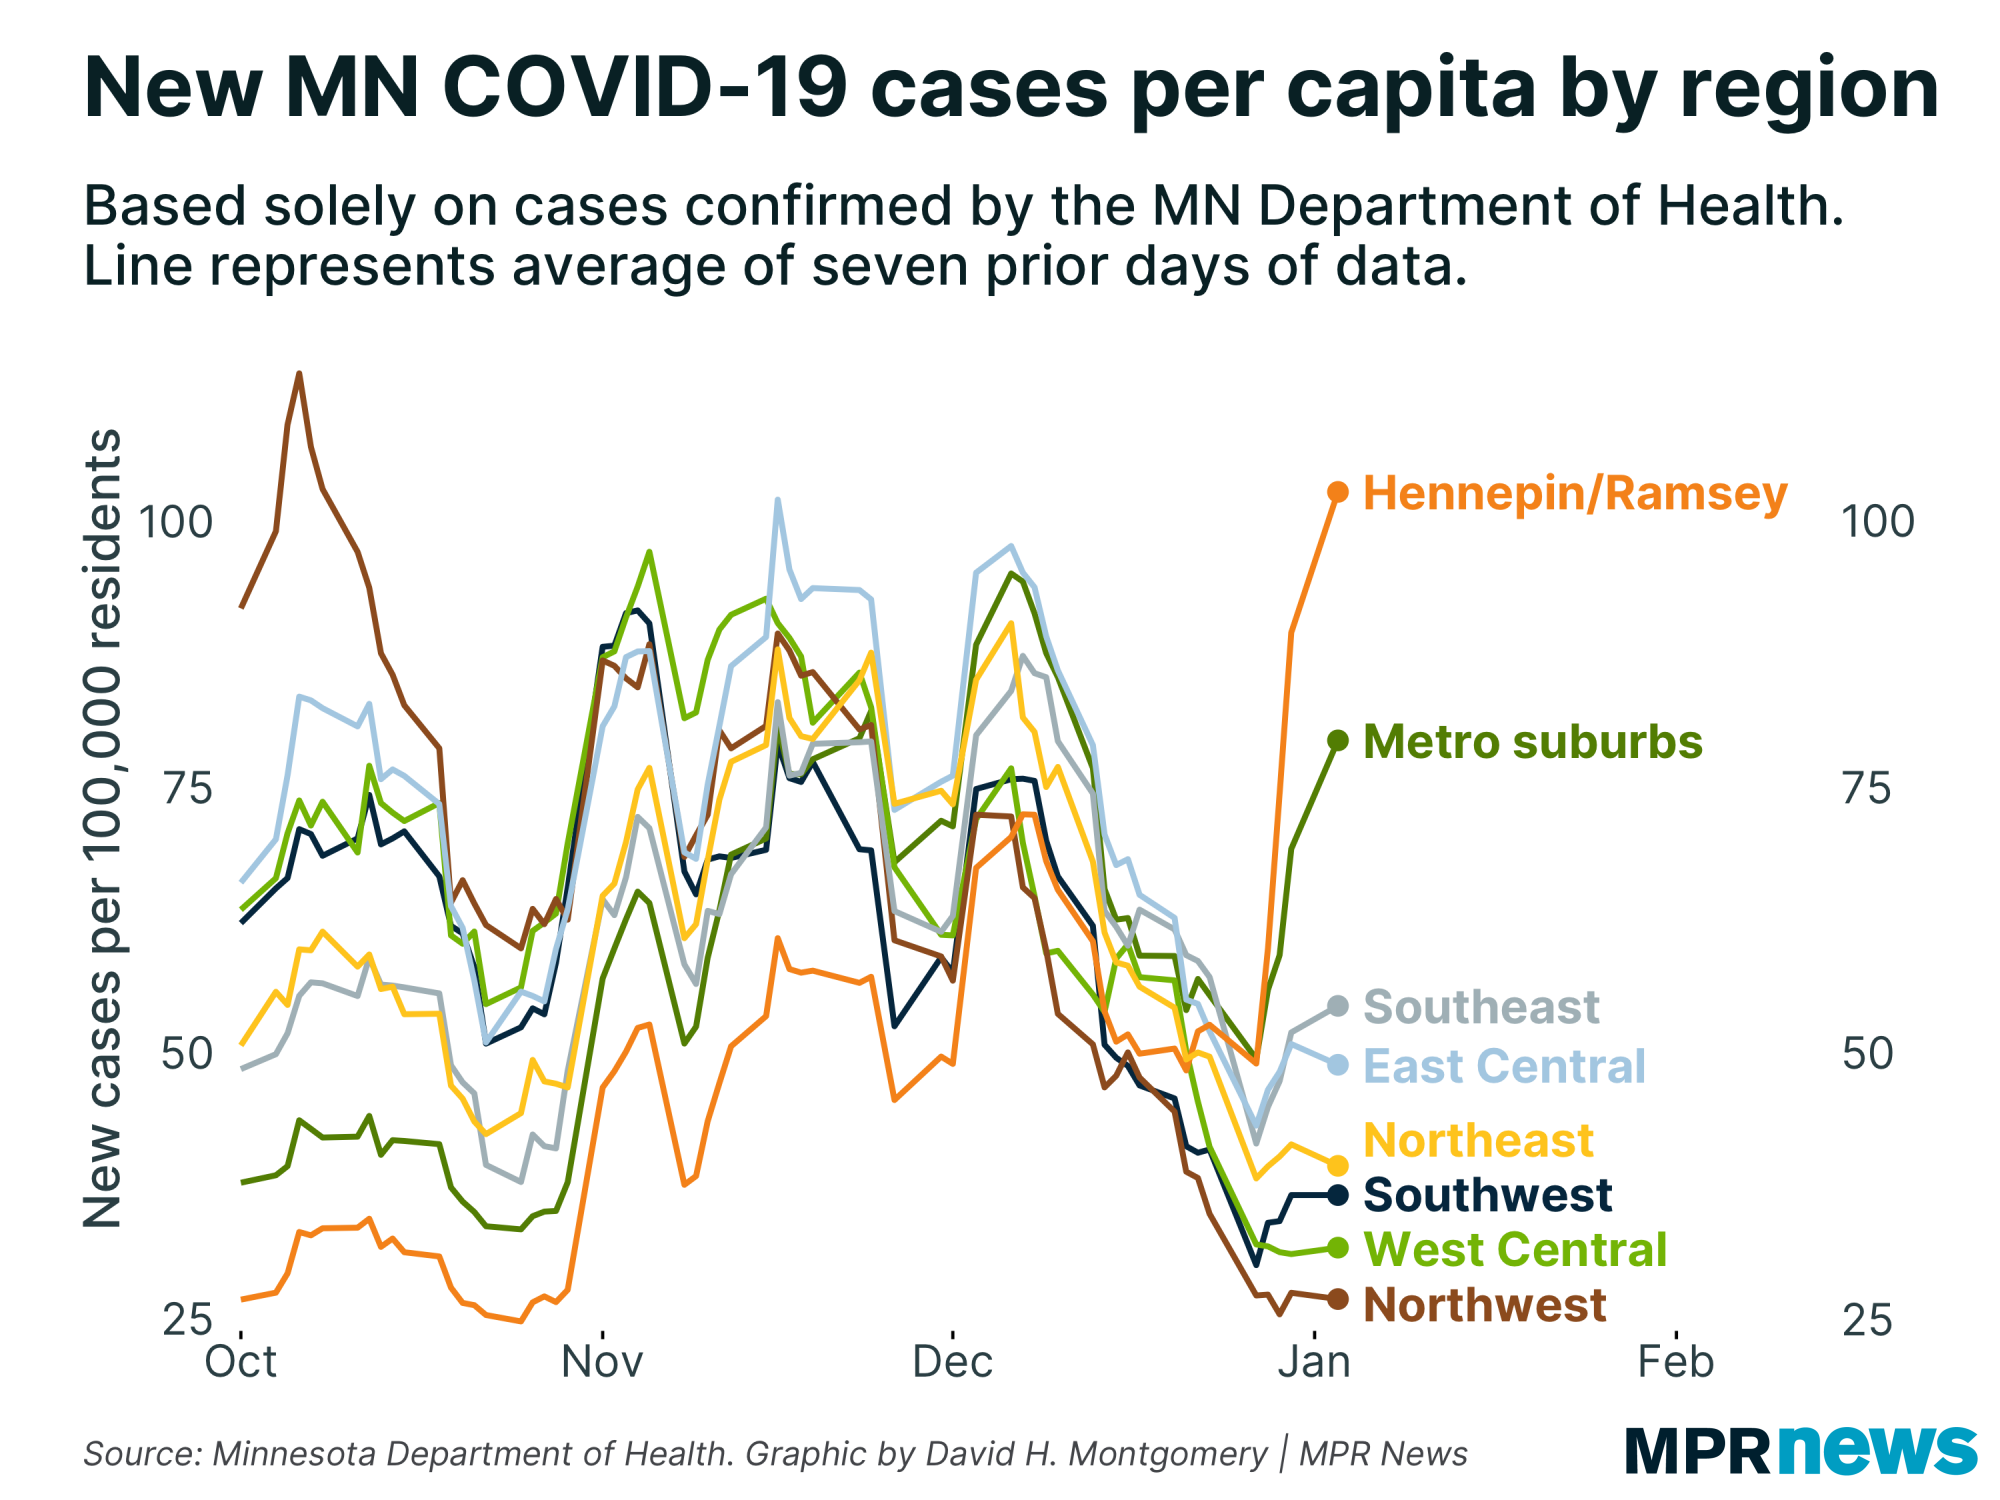
If you look back at the start of December, you can see Minnesota's post-Thanksgiving bump. And in particular, you can see how it happened pretty much everywhere.
Now look to the end of December — where we are now. Notice how cases are relatively flat in most of Minnesota — but have skyrocketed in the Twin Cities metro area.
This is based on report-date data, so it's possible there's something going on with the data here. But what this says to me is that we're seeing something different. There's something going on in the Twin Cities that isn't going on — so far — in the rest of Minnesota. And since they have Christmas in greater Minnesota, too, my hypothesis is omicron.
And note the magnitude here. Average cases in Hennepin and Ramsey counties have basically doubled in a week.
It's possible that the next few days of data will show this to be a fluke. But I'm not betting on it. |
| |
|
|
A few frequently asked questions
|
In my daily Twitter threads updating people on the latest COVID stats, I get a few questions and comments all the time, and I wanted to take a few minutes to round up a sort of FAQ:
Q. At-home COVID tests aren't included in these numbers. Since these have become increasingly popular, could our case numbers be completely missing big changes like an omicron surge?
A. The fact that at-home tests aren't included in the data is surely having an effect on the data's quality. But "having an effect" is not the same as "making worthless."
First, remember that not only are positive at-home tests not counted, but neither are negative at-home tests. The pandemic has taught us the importance of controlling for testing volume, or at the very least using it to contextualize case counts. If Minnesota has a 10 percent positivity rate, and we added 5,000 new positive at-home tests and 45,000 new negative at-home tests, our positivity rate wouldn't change. And I suspect that counting all these at-home rapid tests would, if anything, lower Minnesota's positivity rate. That's because a lot of people respond to a positive rapid test by going to get it confirmed with a PCR test — which get counted. But I'd guess most people (or at least more people) will accept their negative rapid test. This is guesswork and could be wrong. But I'm not sure there's any solid groundwork for believing that counting all these at-home tests would increase Minnesota's positivity rate.
Second, even if not counting at-home tests in Minnesota were distorting our stats, remember that none of the other states count at-home tests, either. And yet this hasn't stopped places like New York or Illinois from showing huge, dramatic omicron spikes. And it won't stop Minnesota from showing one, either. Maybe not counting these tests causes us to be a little late picking up a big spike (or a fall!), or affects the scale. But our formal testing system is absolutely still capable of picking up big waves, even without at-home tests included.
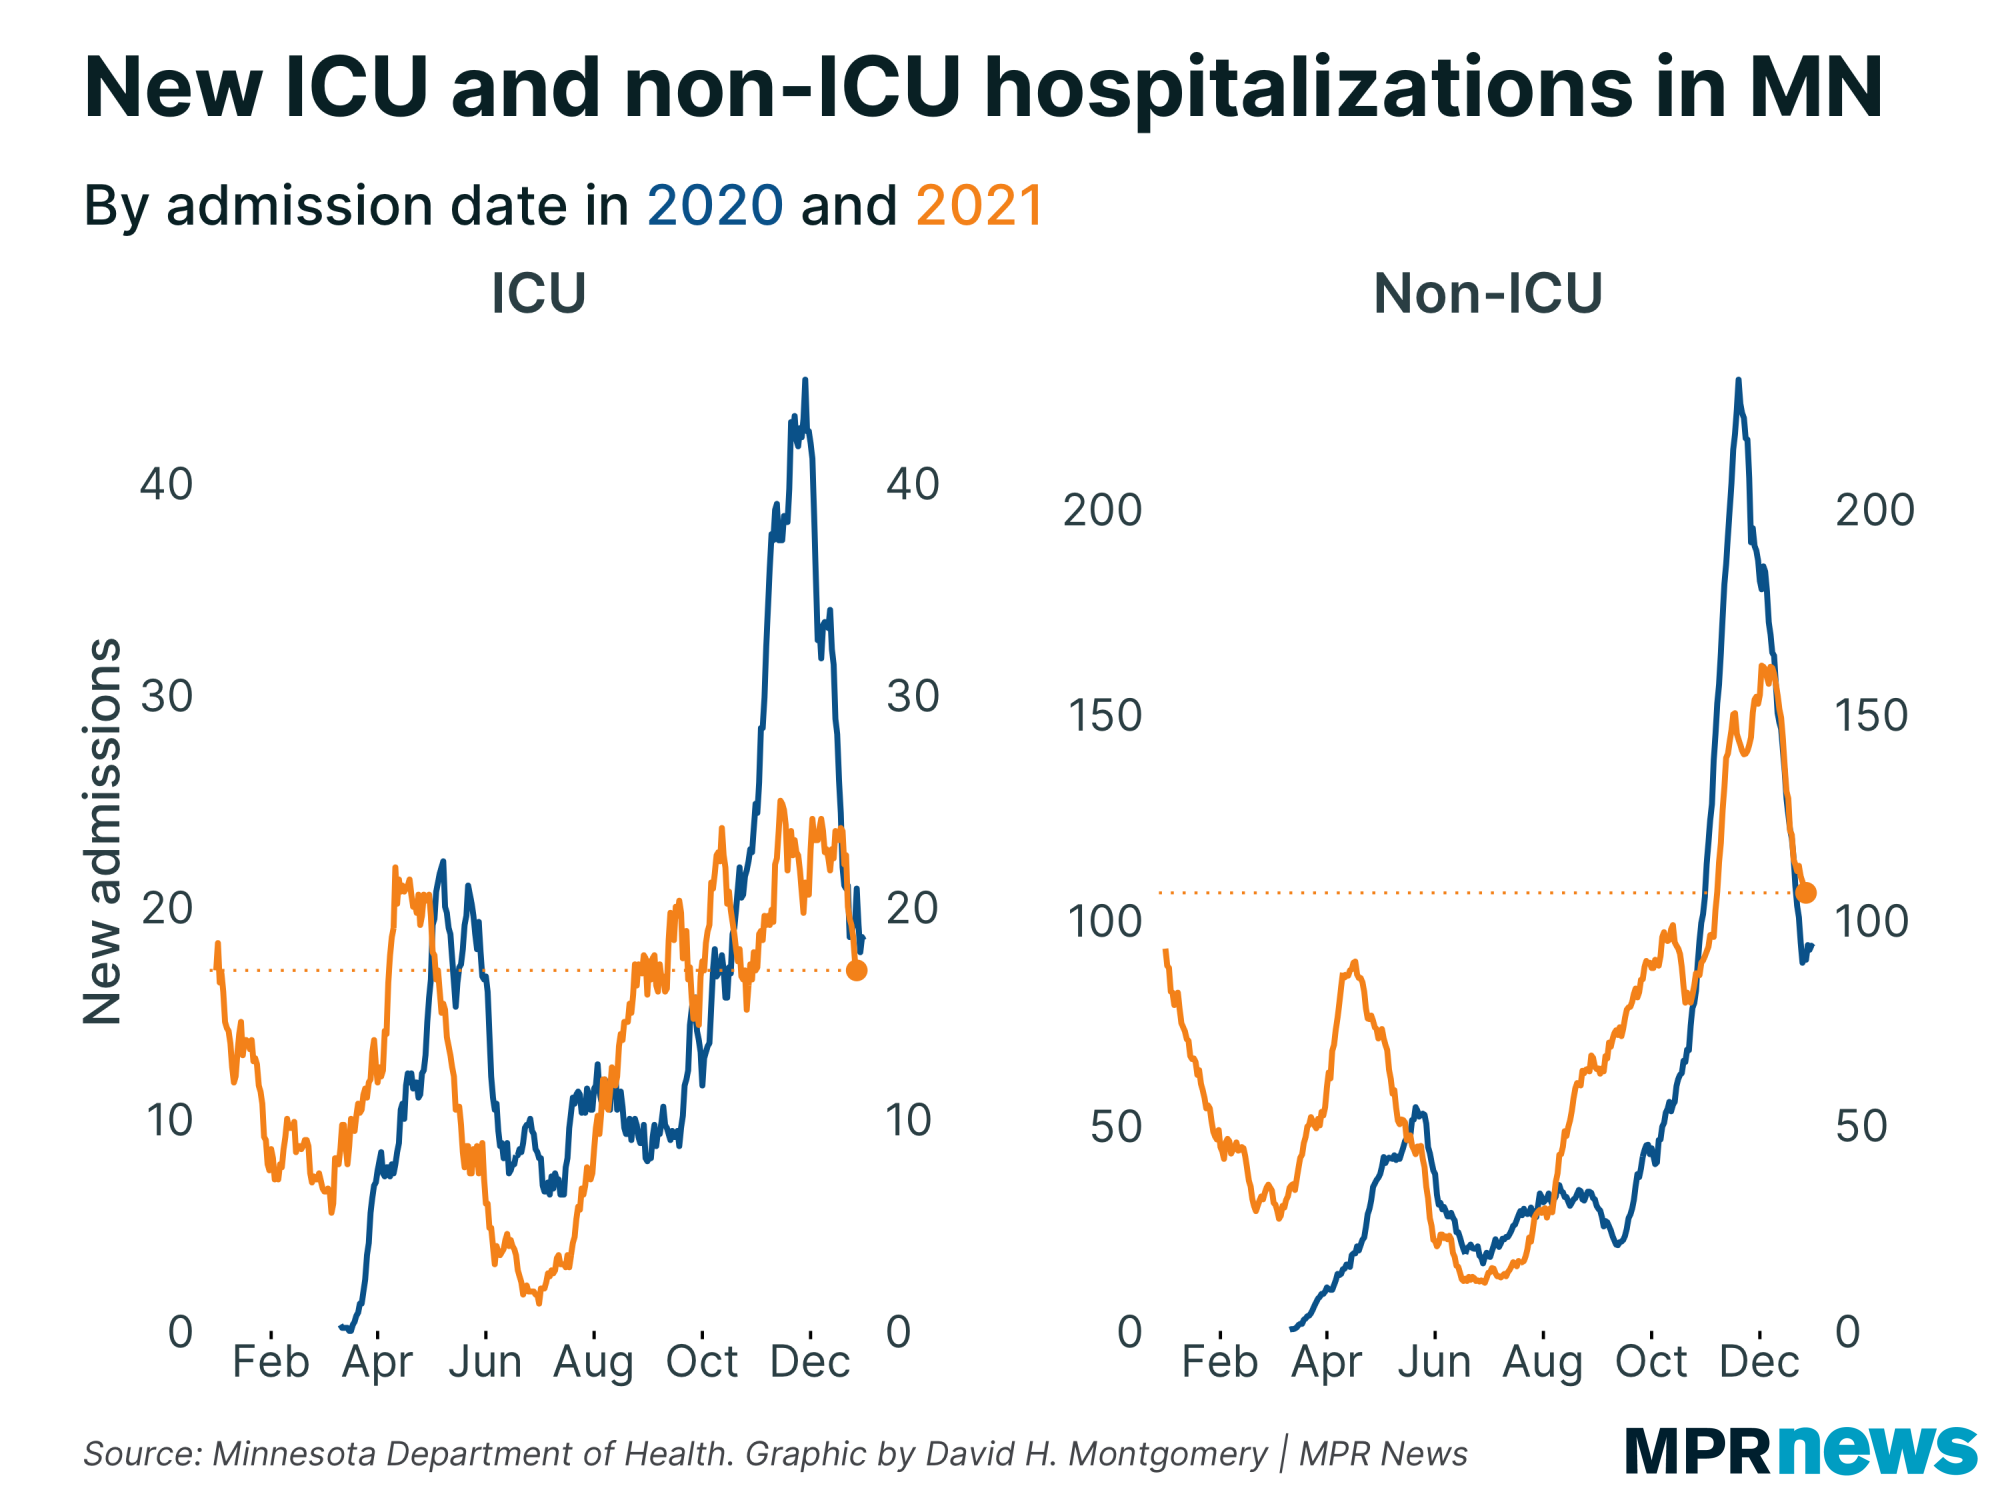
Q. With reports that omicron is less likely to result in serious illness, and so many people vaccinated (which also protects against serious illness), haven't cases become useless? Shouldn't we prioritize hospitalization numbers instead?
Hospital admission rates and bed counts are extremely valuable metrics for tracking the spread of COVID-19! In some ways hospitalizations and deaths are what really matter, and counts of mild or asymptomatic infections are important primarily because those people with mild cases can infect others who have worse outcomes.
But case counts (especially when adjusted for testing volume via positivity rate) have another crucial purpose. They are — or have been — a leading indicator, one that can roughly predict hospitalization figures a few days ahead of time.
The big question is, will cases continue to be a leading indicator for hospitalizations?
Theoretically these two stats could decouple, a world where cases can surge because lots of people have mild sickness, but hospitalizations barely budge because very few people get serious illness.
But — as of literally today — that hasn't happened yet. Cases and hospitalizations have tracked each other very closely pretty much all pandemic. More people with mild infections has gone along with more people with serious infections. |
| |
|
|
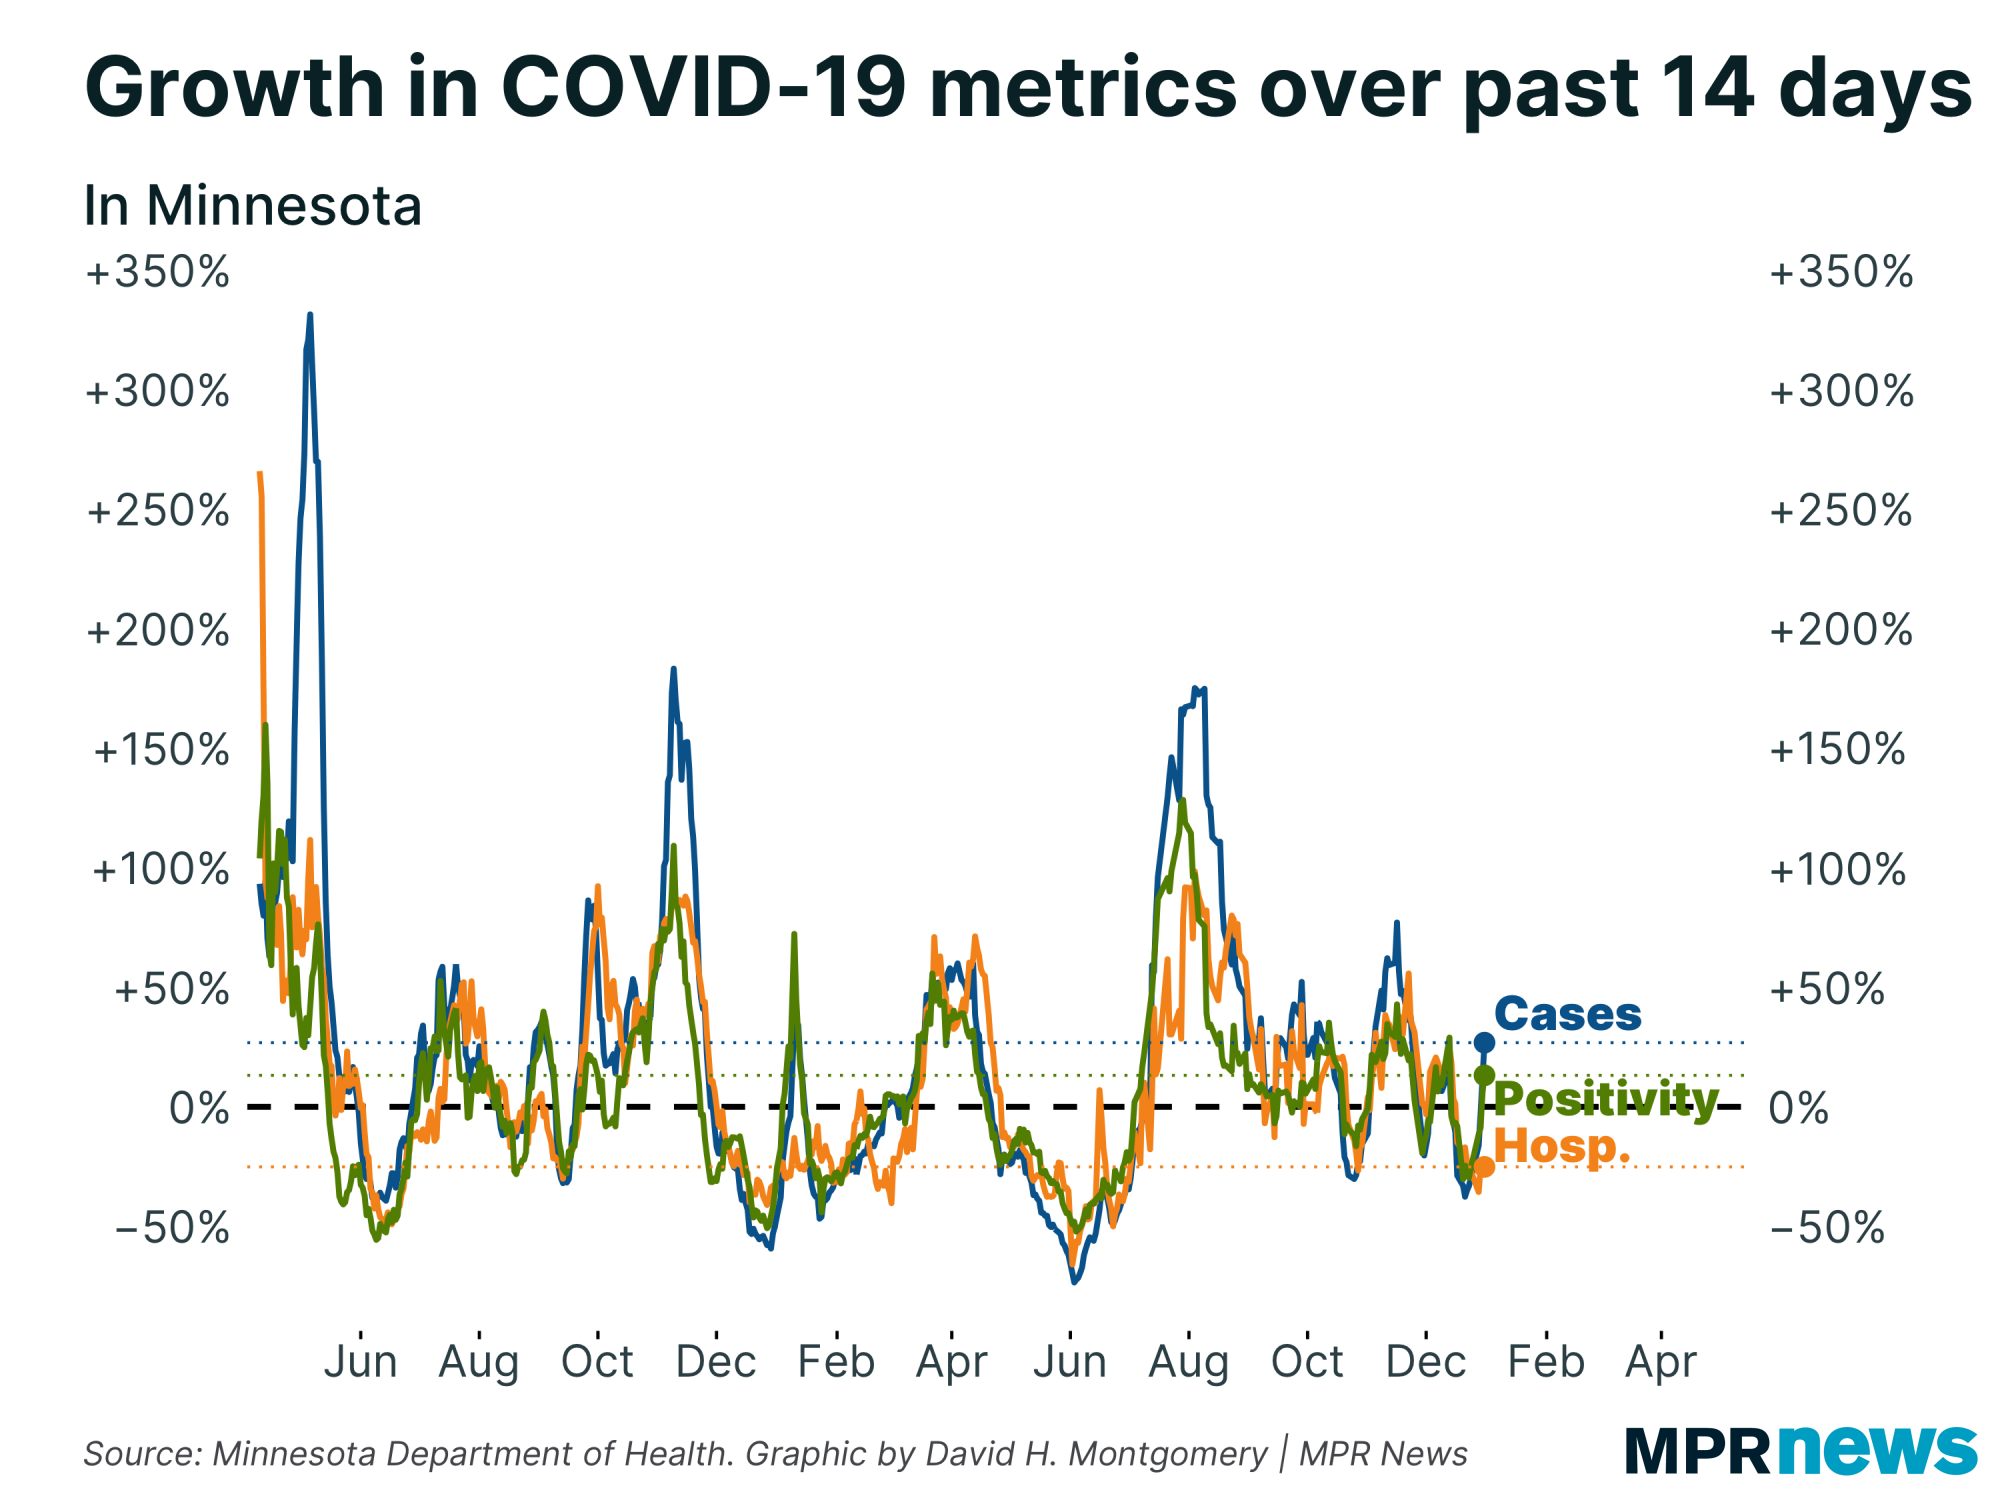
| I emphasized that this is as of today because a few days ago cases shot upward, and hospitalizations are still declining: | | |
|
|
Based on past patterns, I would expect hospital admissions to start rising again in a few days, matching our rise in case counts. It's possible that omicron will break this relationship, and I'll be watching for it. Or maybe some future variant, or future level of herd immunity, will break it. But that hasn't happened yet.
Q. Does Minnesota have wastewater monitoring for COVID-19 levels?
One of the more intriguing discoveries this pandemic is that COVID-19 surges can be tracked by searching for viral loads in people's sewage. Minnesota does have groups tracking this, including at the University of Minnesota and the Met Council.
What we don't have, to the best of my knowledge, is a dashboard or sorts publishing daily, current updates from that wastewater analysis for public quantitative use. If we had that resource — and please let me know if it exists — I'd absolutely use it as part of my regular rotation of charts. It's just that as far as I'm aware, that data's not publicly available.
That's all for today; I may add more FAQs in future newsletters. |
| |
|
|
Below, I'll explore a few more stats about Minnesota's COVID-19 outbreak. If you want to learn more, I also recommend these other articles:
| | |
|
|
| Minnesota's second year of COVID by the numbers |
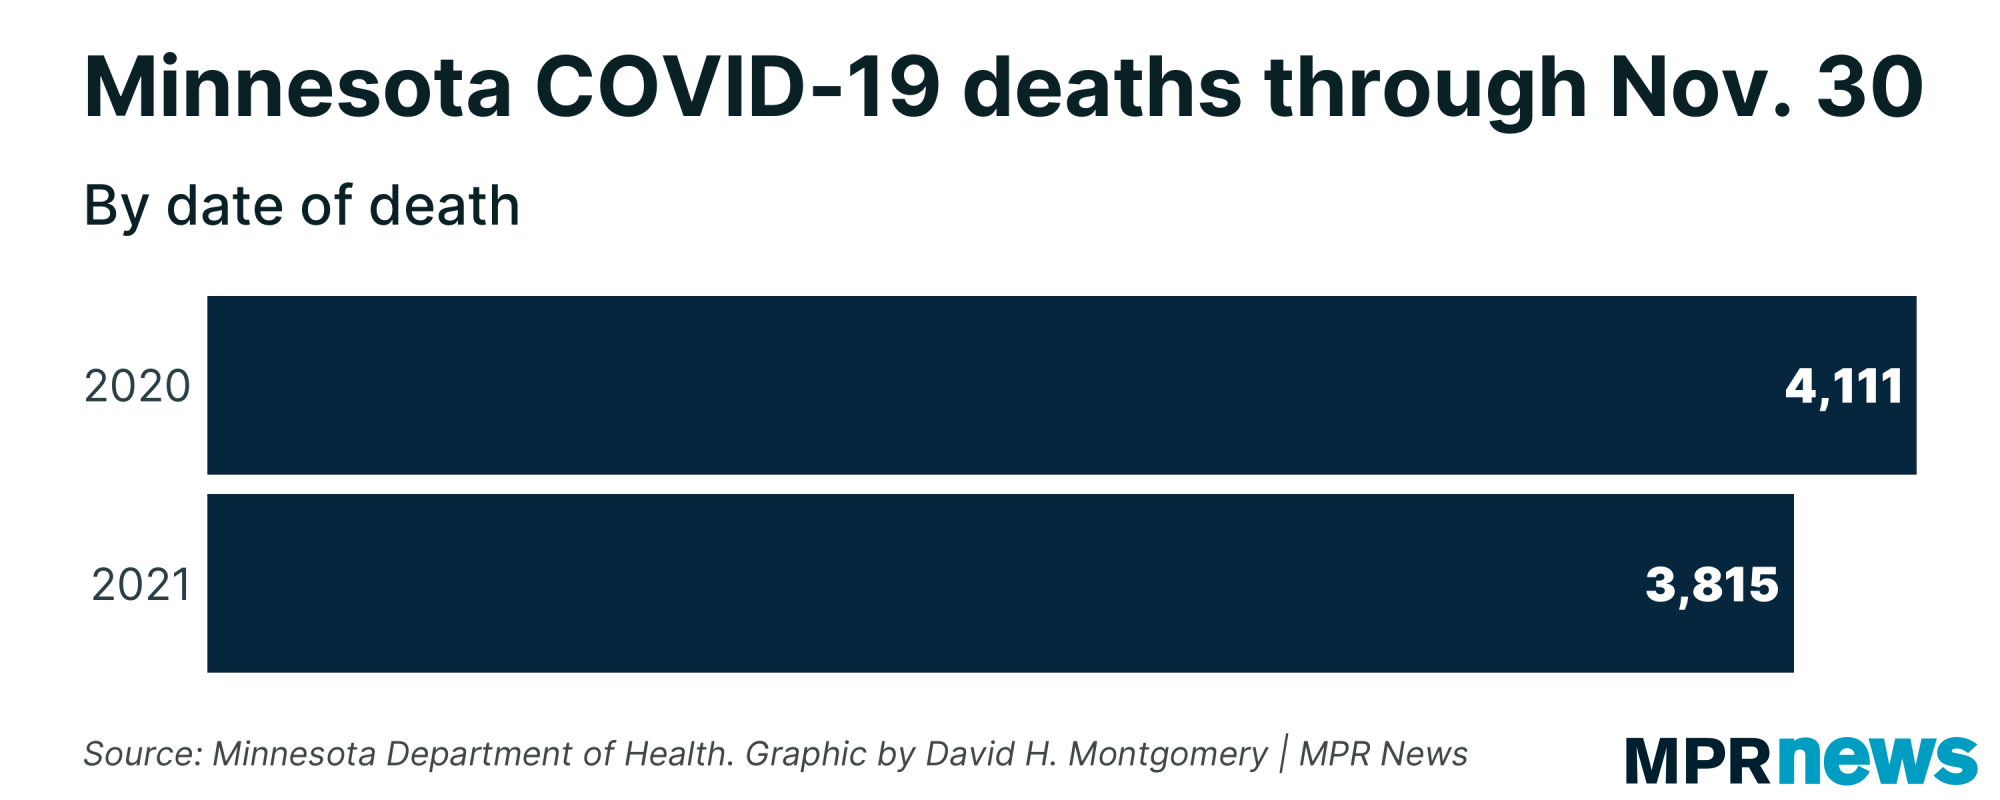
I wrote an article for MPR News' website rounding up some of the key stats from Minnesota's 2021 in COVID. You should read the full article for everything, but I wanted to highlight some of the figures on death rate for you here.
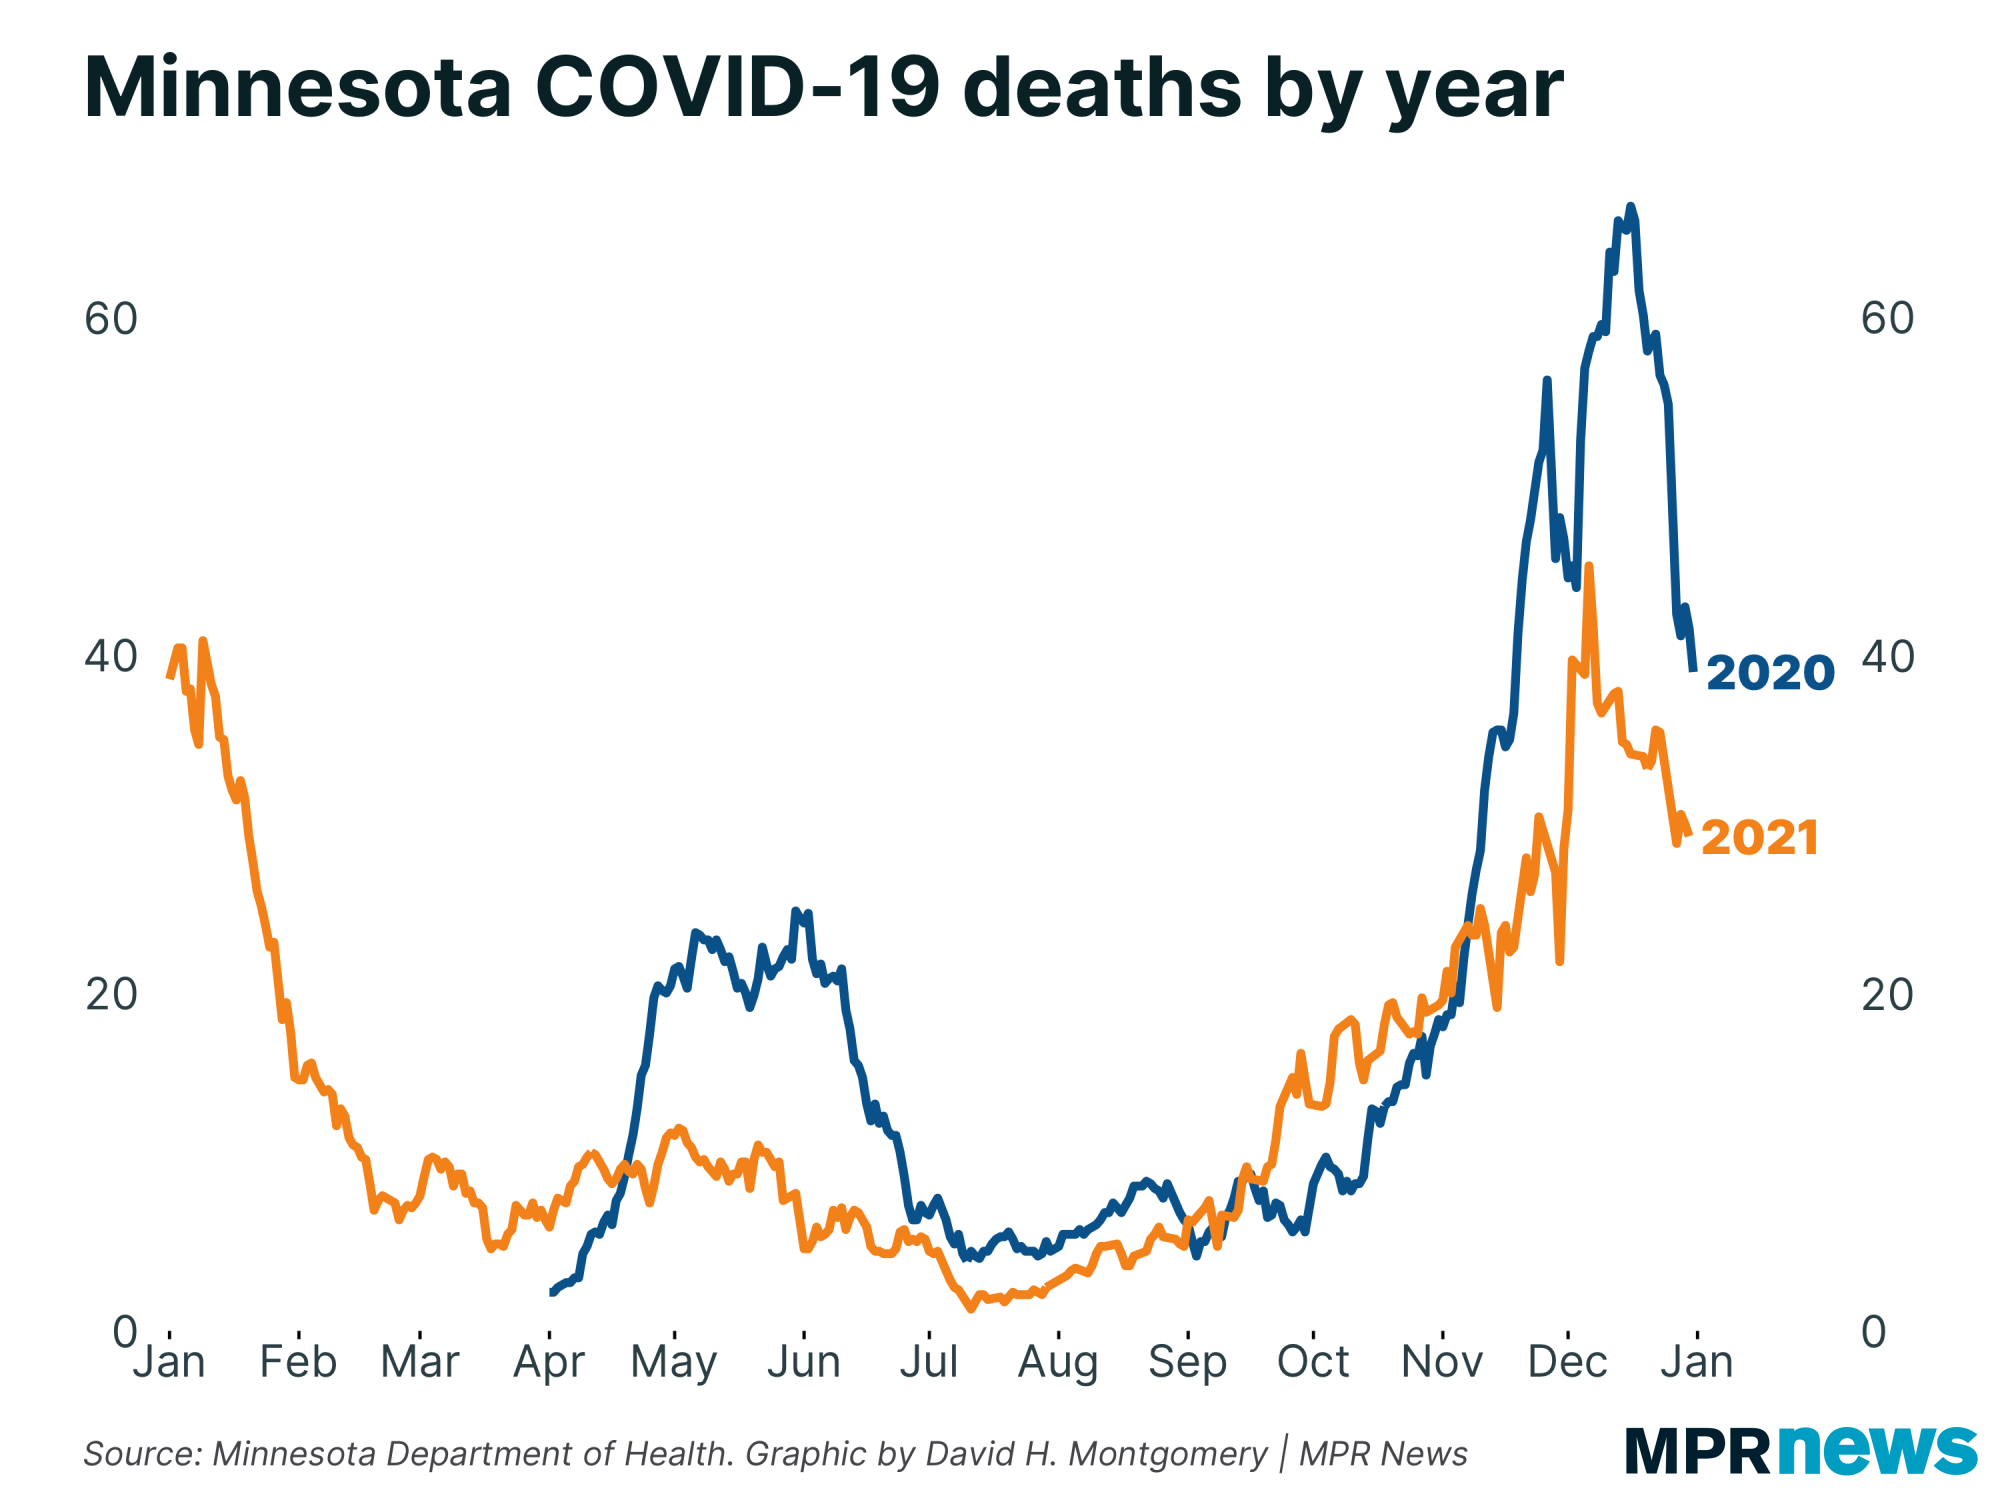
First, our incomplete figures for deaths in 2021 (reporting lags mean we won't be able to get a rough death count for the year for a few more weeks) show 2021 running slightly behind 2020's count of COVID-19 deaths. (And note that Minnesota's first COVID death didn't happen until late March, 2020, which means 2020 accomplished that in less time.) |
| |
|
|
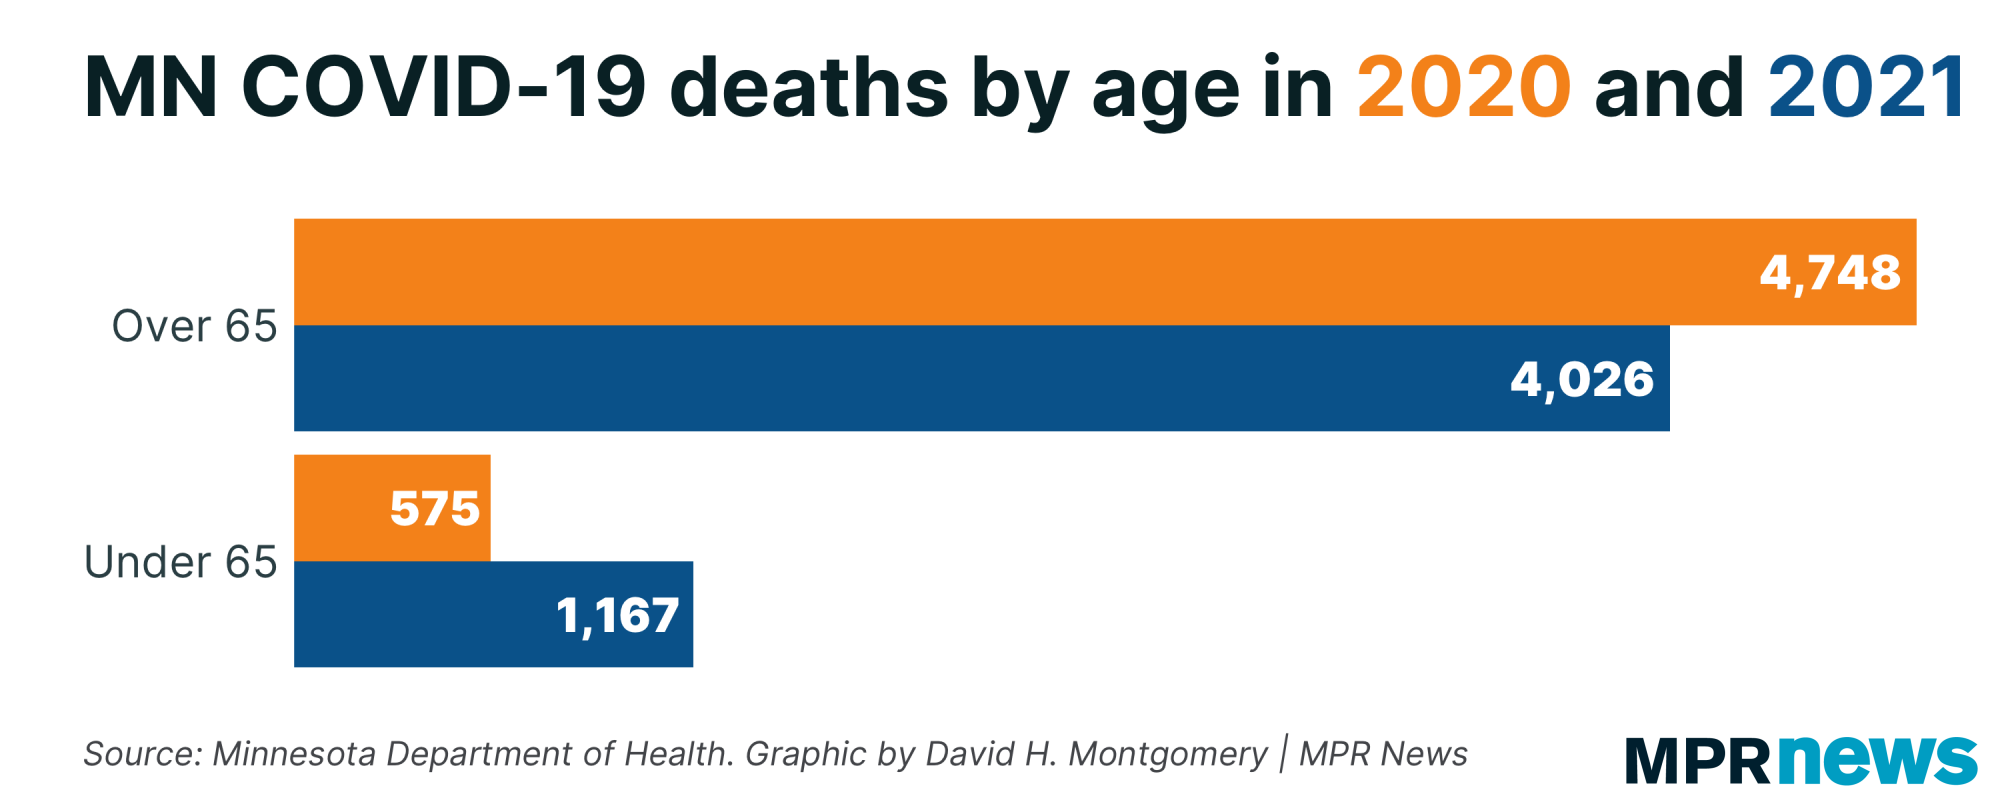
But even if the death totals are roughly similar, the composition of these deaths have changed dramatically in 2021, when vaccines were available but the virus mutated to be deadlier.
One big change: the death rate fell in 2021 for seniors, who are most vulnerable to the disease but are also heavily vaccinated. The death rate actually rose for Minnesotans under 65, who have lower vaccination rates. |
| |
|
|
(If you're trying to compare the numbers in these charts and finding they don't add up, that's not a problem with your math or my math. Some of these numbers are from death-date data, and others are from report-date data.)
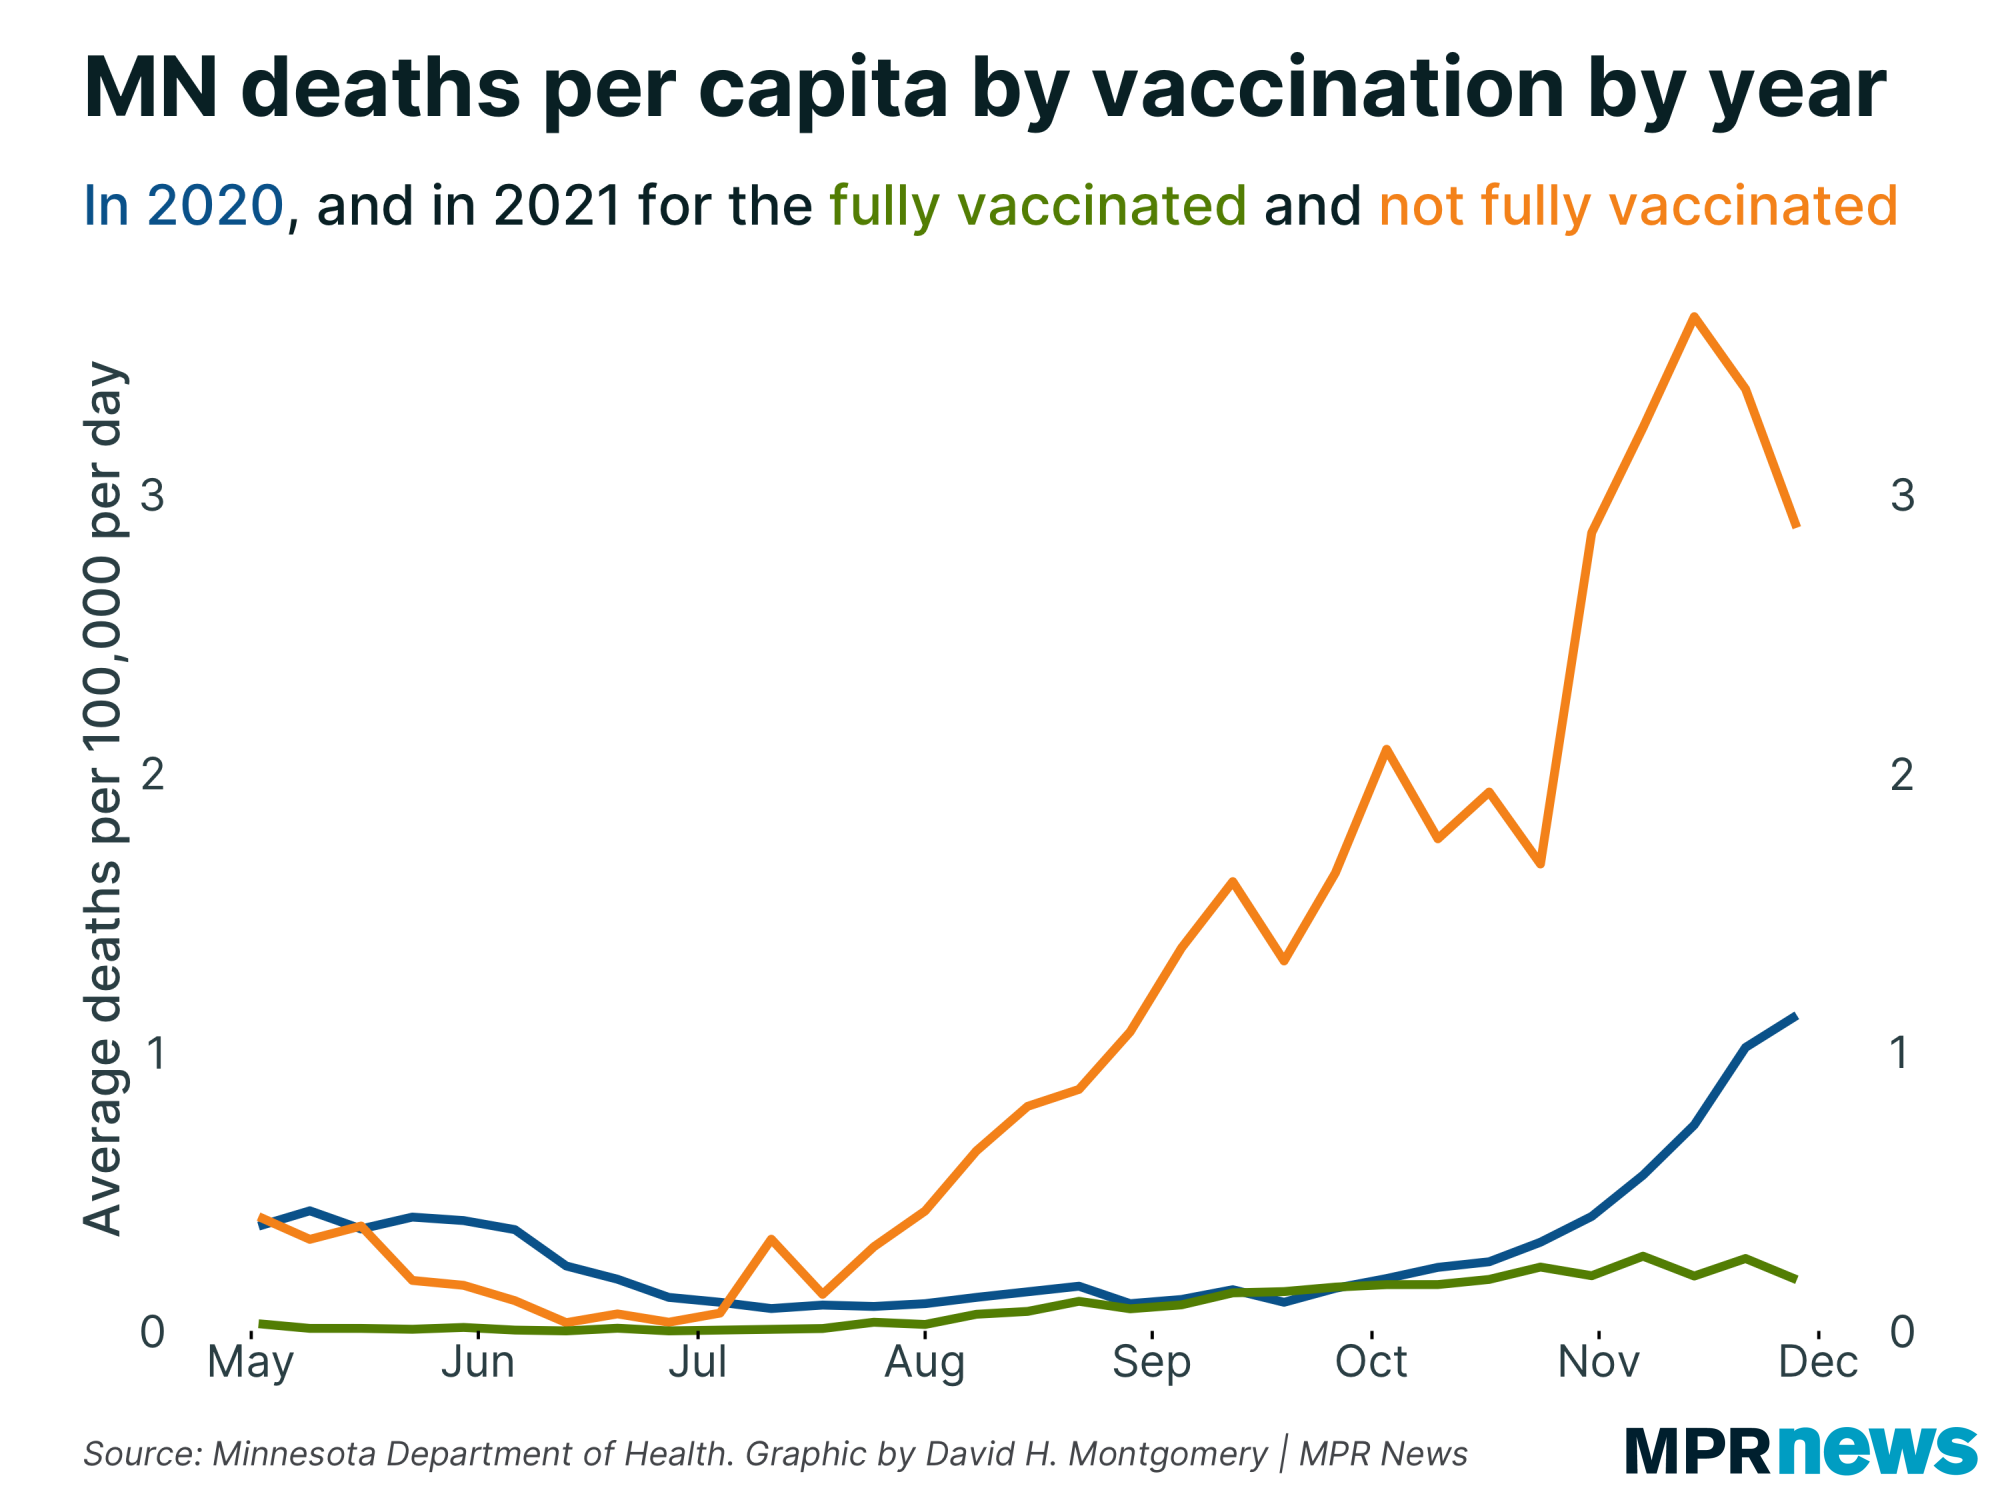
Finally, I took charts you've seen from me before — comparing Minnesota's death rate by vaccination status — and tweaked them to add another line: 2020, when no one was fully vaccinated.
This shows a striking fact: the per capita death rate for unvaccinated Minnesotans right now is several times higher than the death rate for unvaccinated Minnesotans was a year ago. (The death rate for vaccinated Minnesotans right now is much lower than either.) |
| |
|
|
This is especially striking given that the unvaccinated population today is almost 98 percent under 65.
In case you're wondering, by the way, Minnesota is still seeing newly reported deaths fall, and will likely continue to see this happen for some time to come, whatever happens with omicron. That's because, as we all know by now, death rates lag case counts by weeks. |
| |
|
|
Reinfection rates rising
|
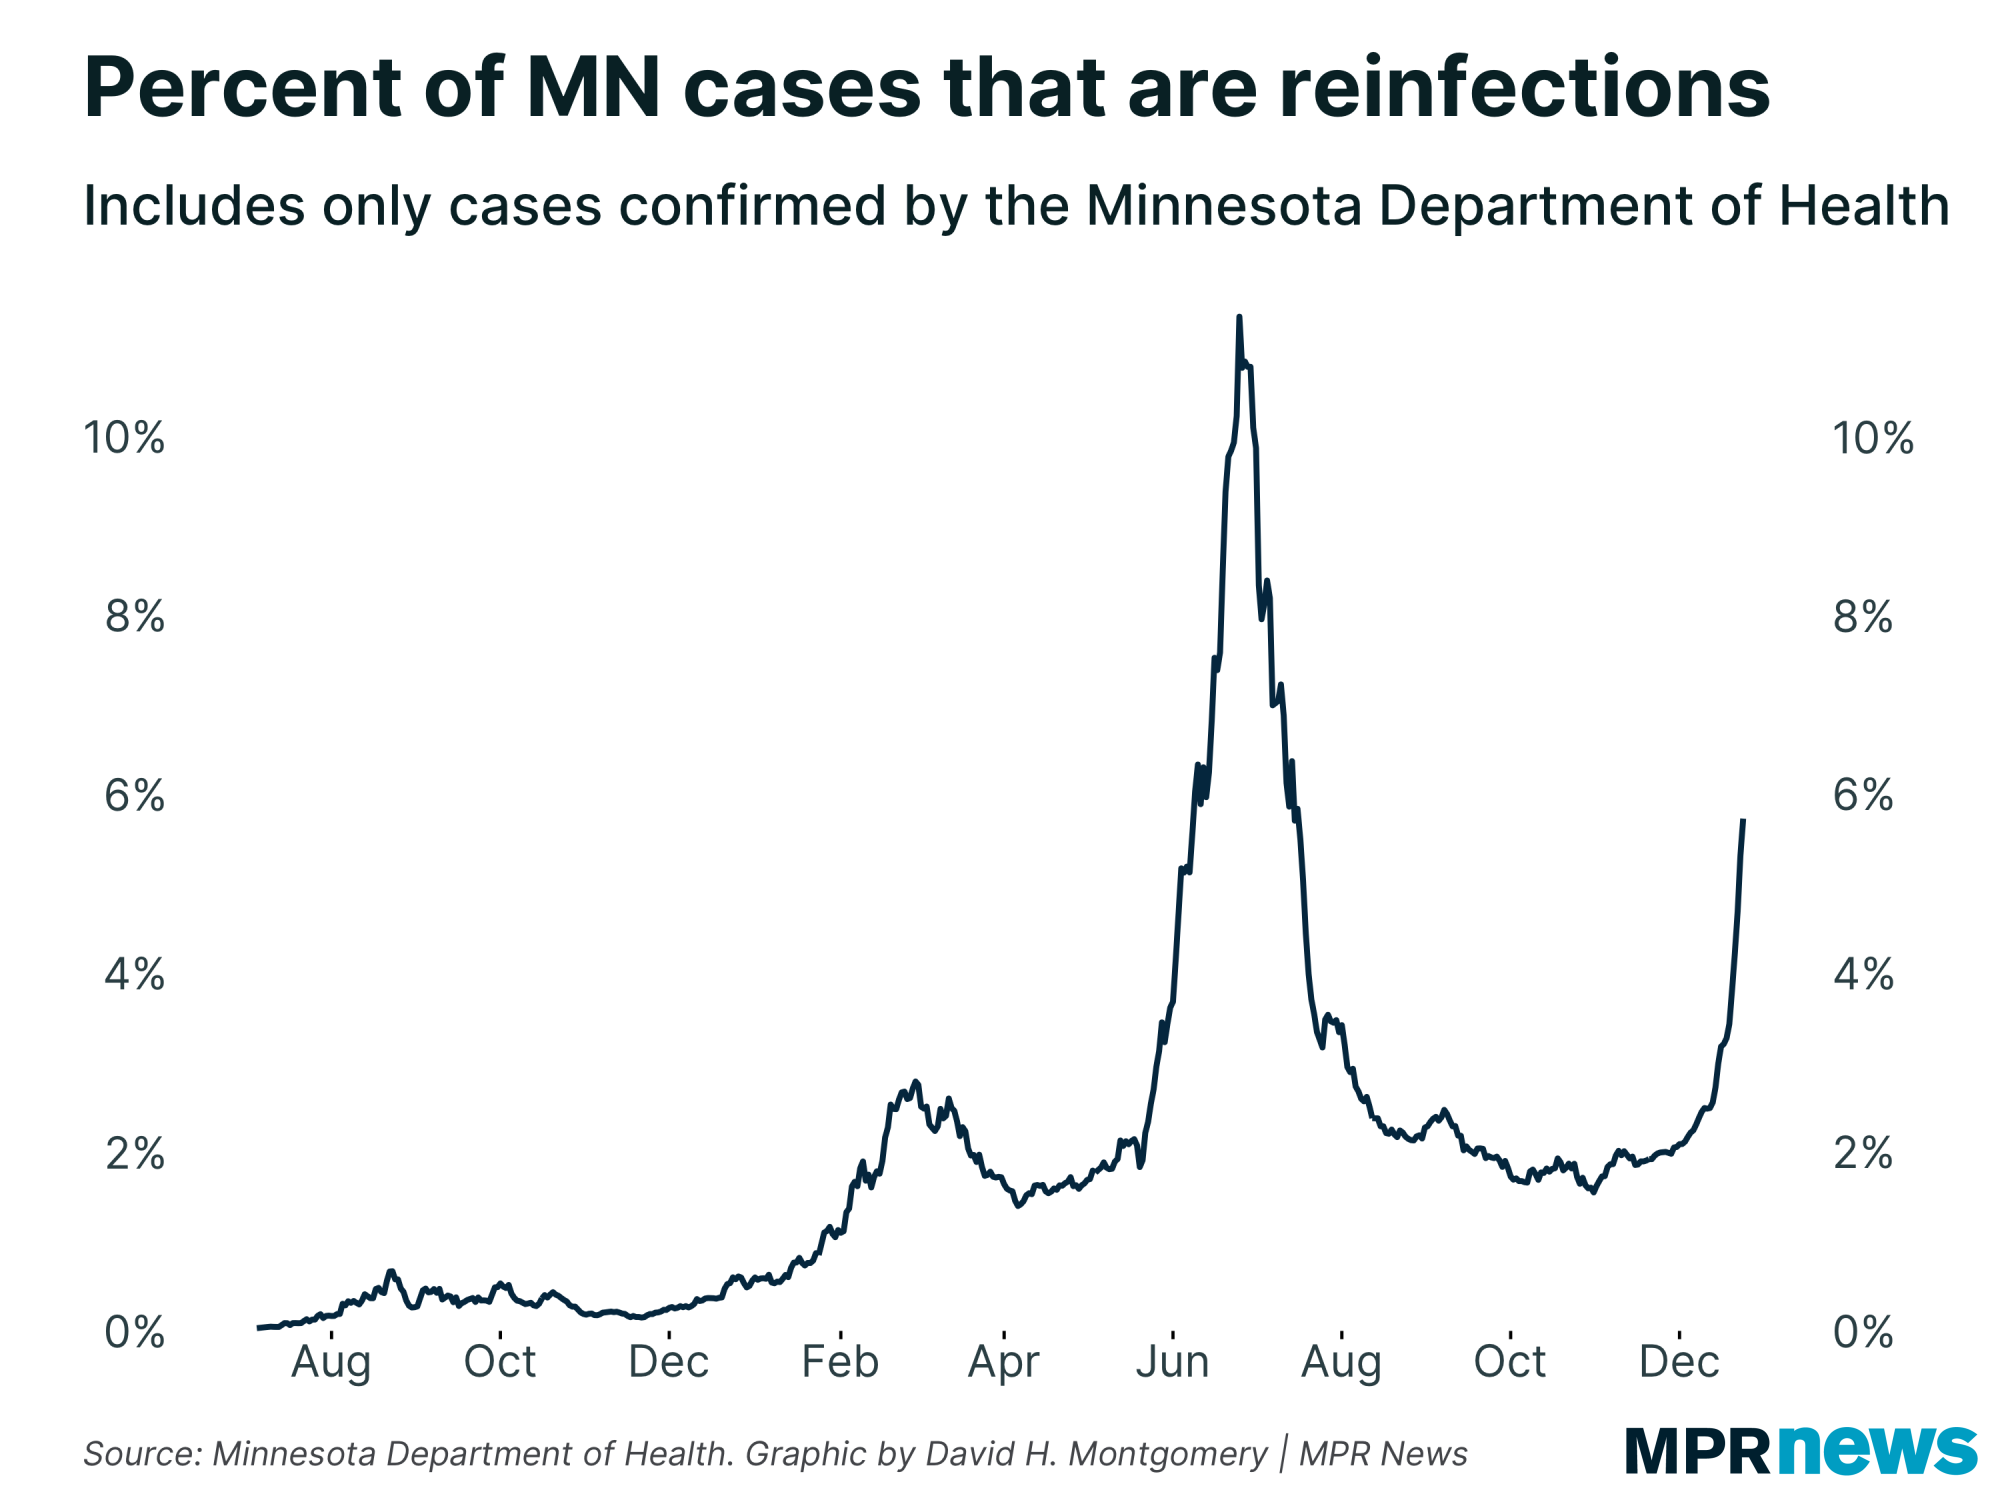
One of the most interesting stats I'm monitoring right now is the percent of all COVID-19 cases in Minnesota that are confirmed reinfections. (The "confirmed" there is doing a lot of weight — if I've caught COVID-19 twice, but only one of those was confirmed by an official test, then I don't show up in the stats as a reinfection.)
This number has been pretty low most of the pandemic — honestly lower than I'd expect. The share of all cases that are breakthroughs, for example, is much, much higher. I'm not sure what that means — possibly a factor of all the unconfirmed cases we've had.
But what's interesting is the three periods when our reinfection percent has risen. One was February and March 2021. One was June and July of 2021, and the other is right now. |
| |
|
|
What do all three of those periods have in common?
This is an observation of correlation and not causation, so don't read too much into this. (And also note that June and July in particular, and February and March to a lesser degree, were lulls in between COVID waves here. So these high percentages are of much smaller case totals, which could be a key factor here.) But I find it very striking nonetheless that Minnesota has seen its reinfection rate rise three times, all when new variants that have at least some evasion of existing immunity were entering the scene. | |
|
|
|
What's happening next?
| Lots of open questions right now:
- Will Minnesota's case counts continue to surge upward?
- How high will they get?
- How long until a peak?
- Will this lead to a rise in hospitalizations?
- Will this case spike spread to Greater Minnesota? How long will this take?
I'll keep watching all of that, and will be looking forward to next week when our data starts to finally get back to normal post-holidays.
Thanks for subscribing to this newsletter and for all of you who've sent me your feedback. As always, if you like this newsletter, please share it and the sign-up link with others who you think might enjoy it.
— David | |
|
|
|
%%[ if _MessageContext != "VAWP" then ]%%
Preference Center ❘ Unsubscribe You received this email because you subscribed or it was sent to you by a friend. This email was sent by: %%Member_Busname%%
%%Member_Addr%% %%Member_City%%, %%Member_State%%, %%Member_PostalCode%%
  |
%%[ endif ]%% |
|
| | |