| Welcome back to COVID in Minnesota TODAY, an email newsletter from MPR News about understanding the latest developments in Minnesota's COVID-19 outbreak. | | |
|
|
The steady stream of good news about Minnesota's COVID-19 outbreak we've had for the past month may have petered to a halt. Case counts have at the very least stopped falling, and may have begun a delta variant-fueled rise.
So far, though, there's not much reason to panic. The upticks in cases have been, if real, very modest in scale so far. And so far other metrics like hospitalizations haven't noticeably increased in the way we saw in past waves (though it's possible it's still too early).
I'll dive into all of this below. |
| |
|
|
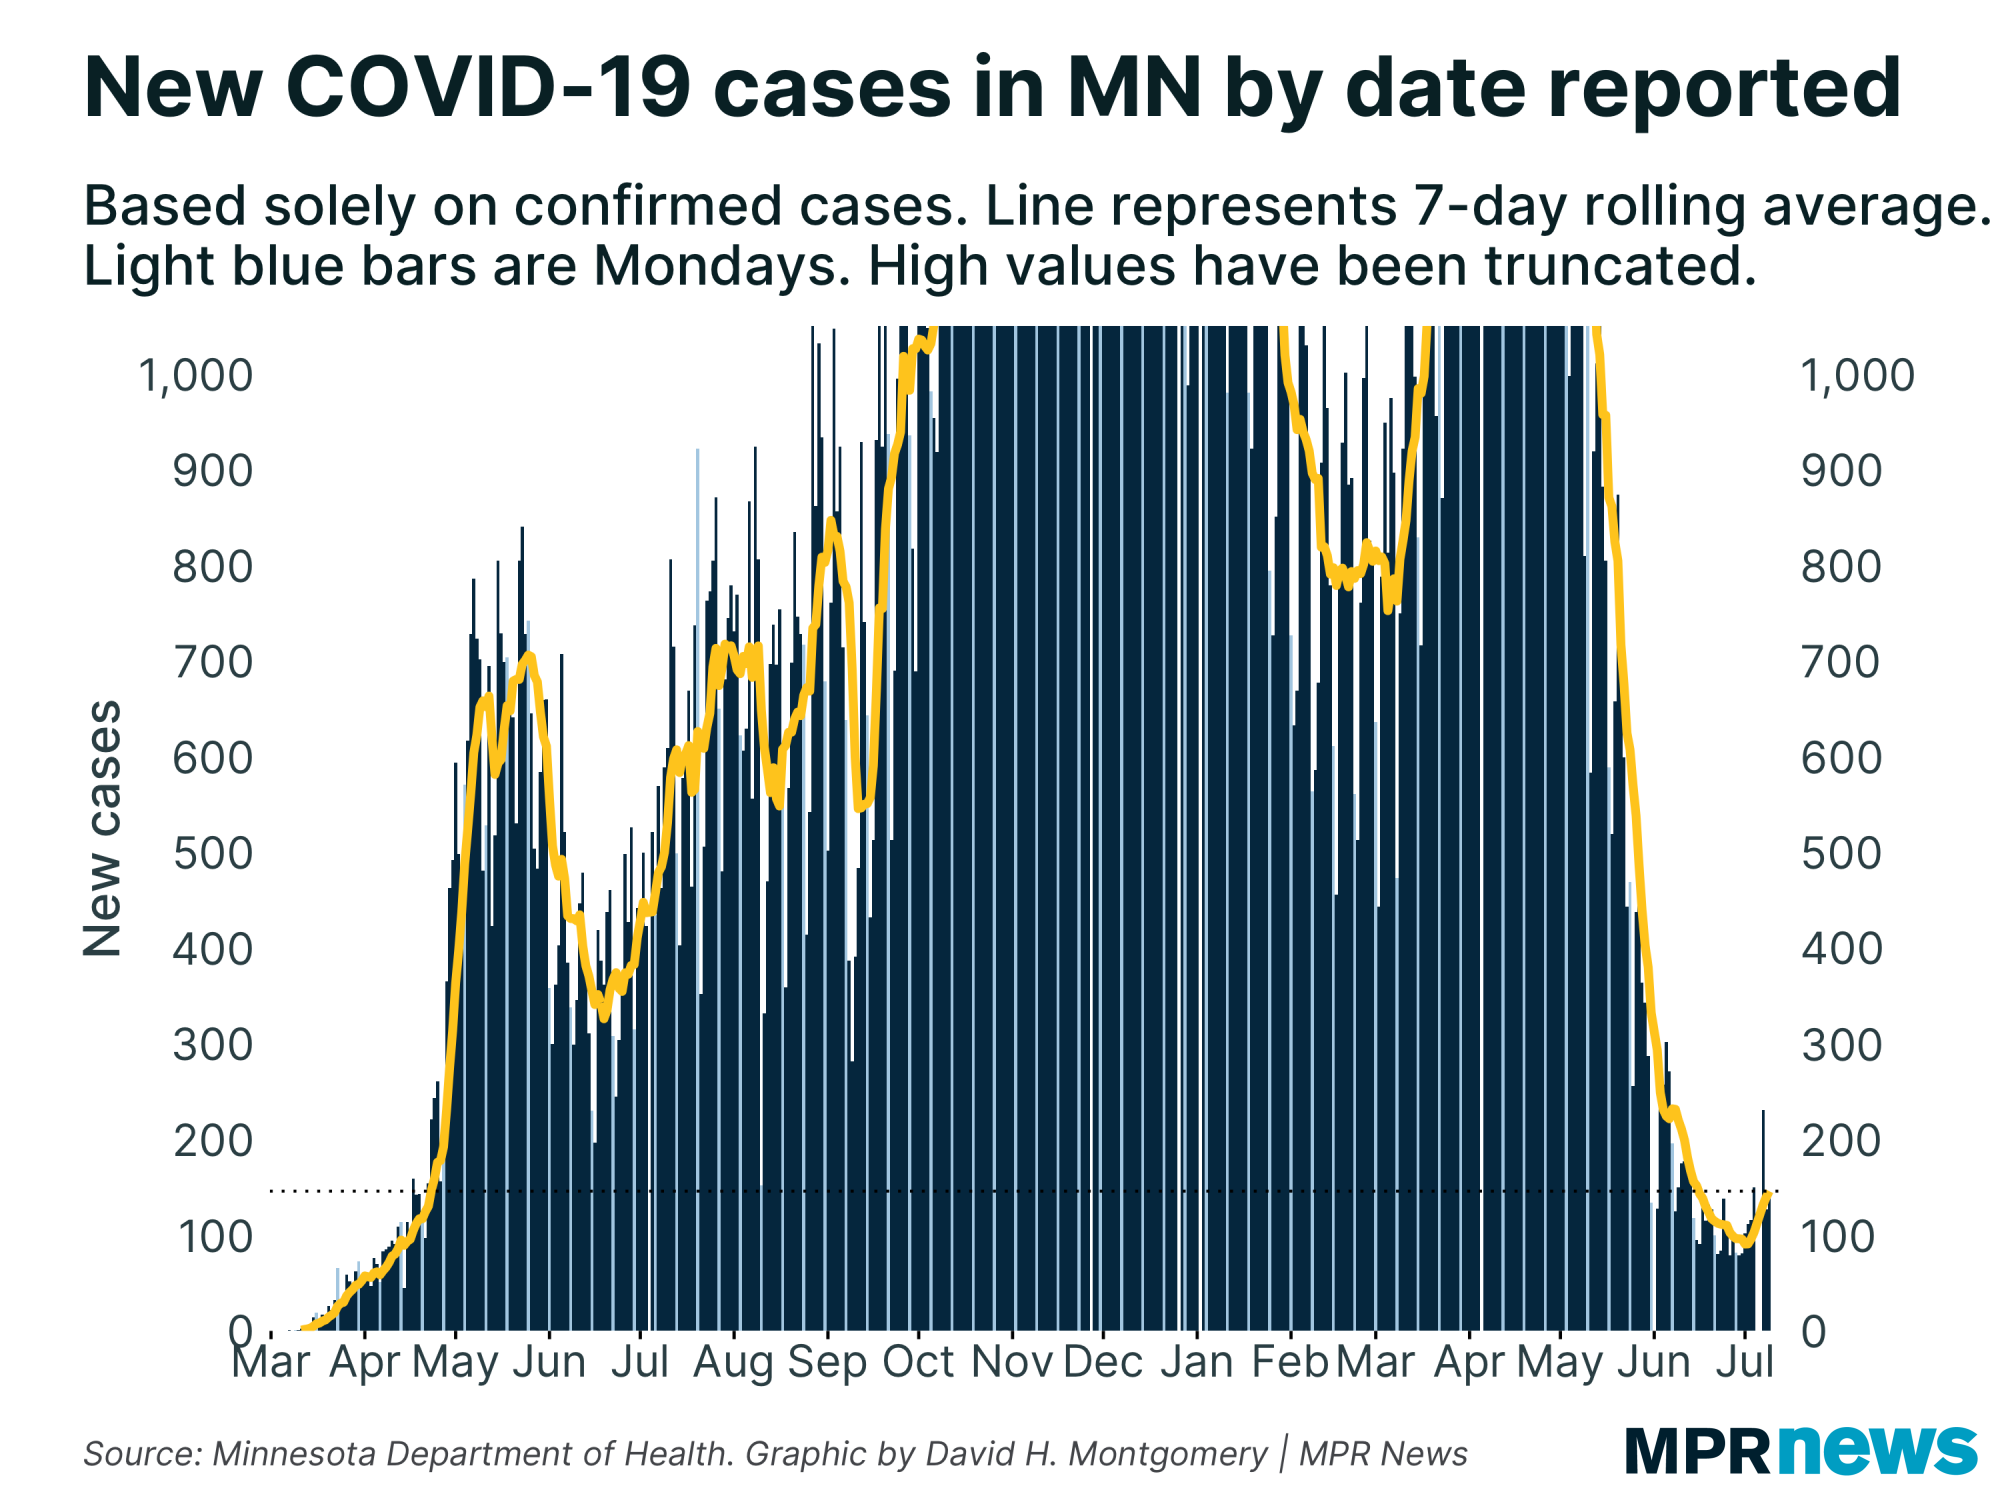
| Case counts in Minnesota bottomed out about a week ago at an average of 90 cases per day. Since then, that average has rebounded for six straight days, up to around 140 cases per day. (It's possible this is inflated a little by holiday weekend reporting artifacts — that big one-day spike in the bars is definitely artificial; the line somewhat controls for it. But even accounting for this, there is a clear upward trend). |
| |
|
|
This is of course concerning — it's not good to see more people getting sick, especially when the existence of the highly contagious delta variant gives us good reason to believe this isn't just random.
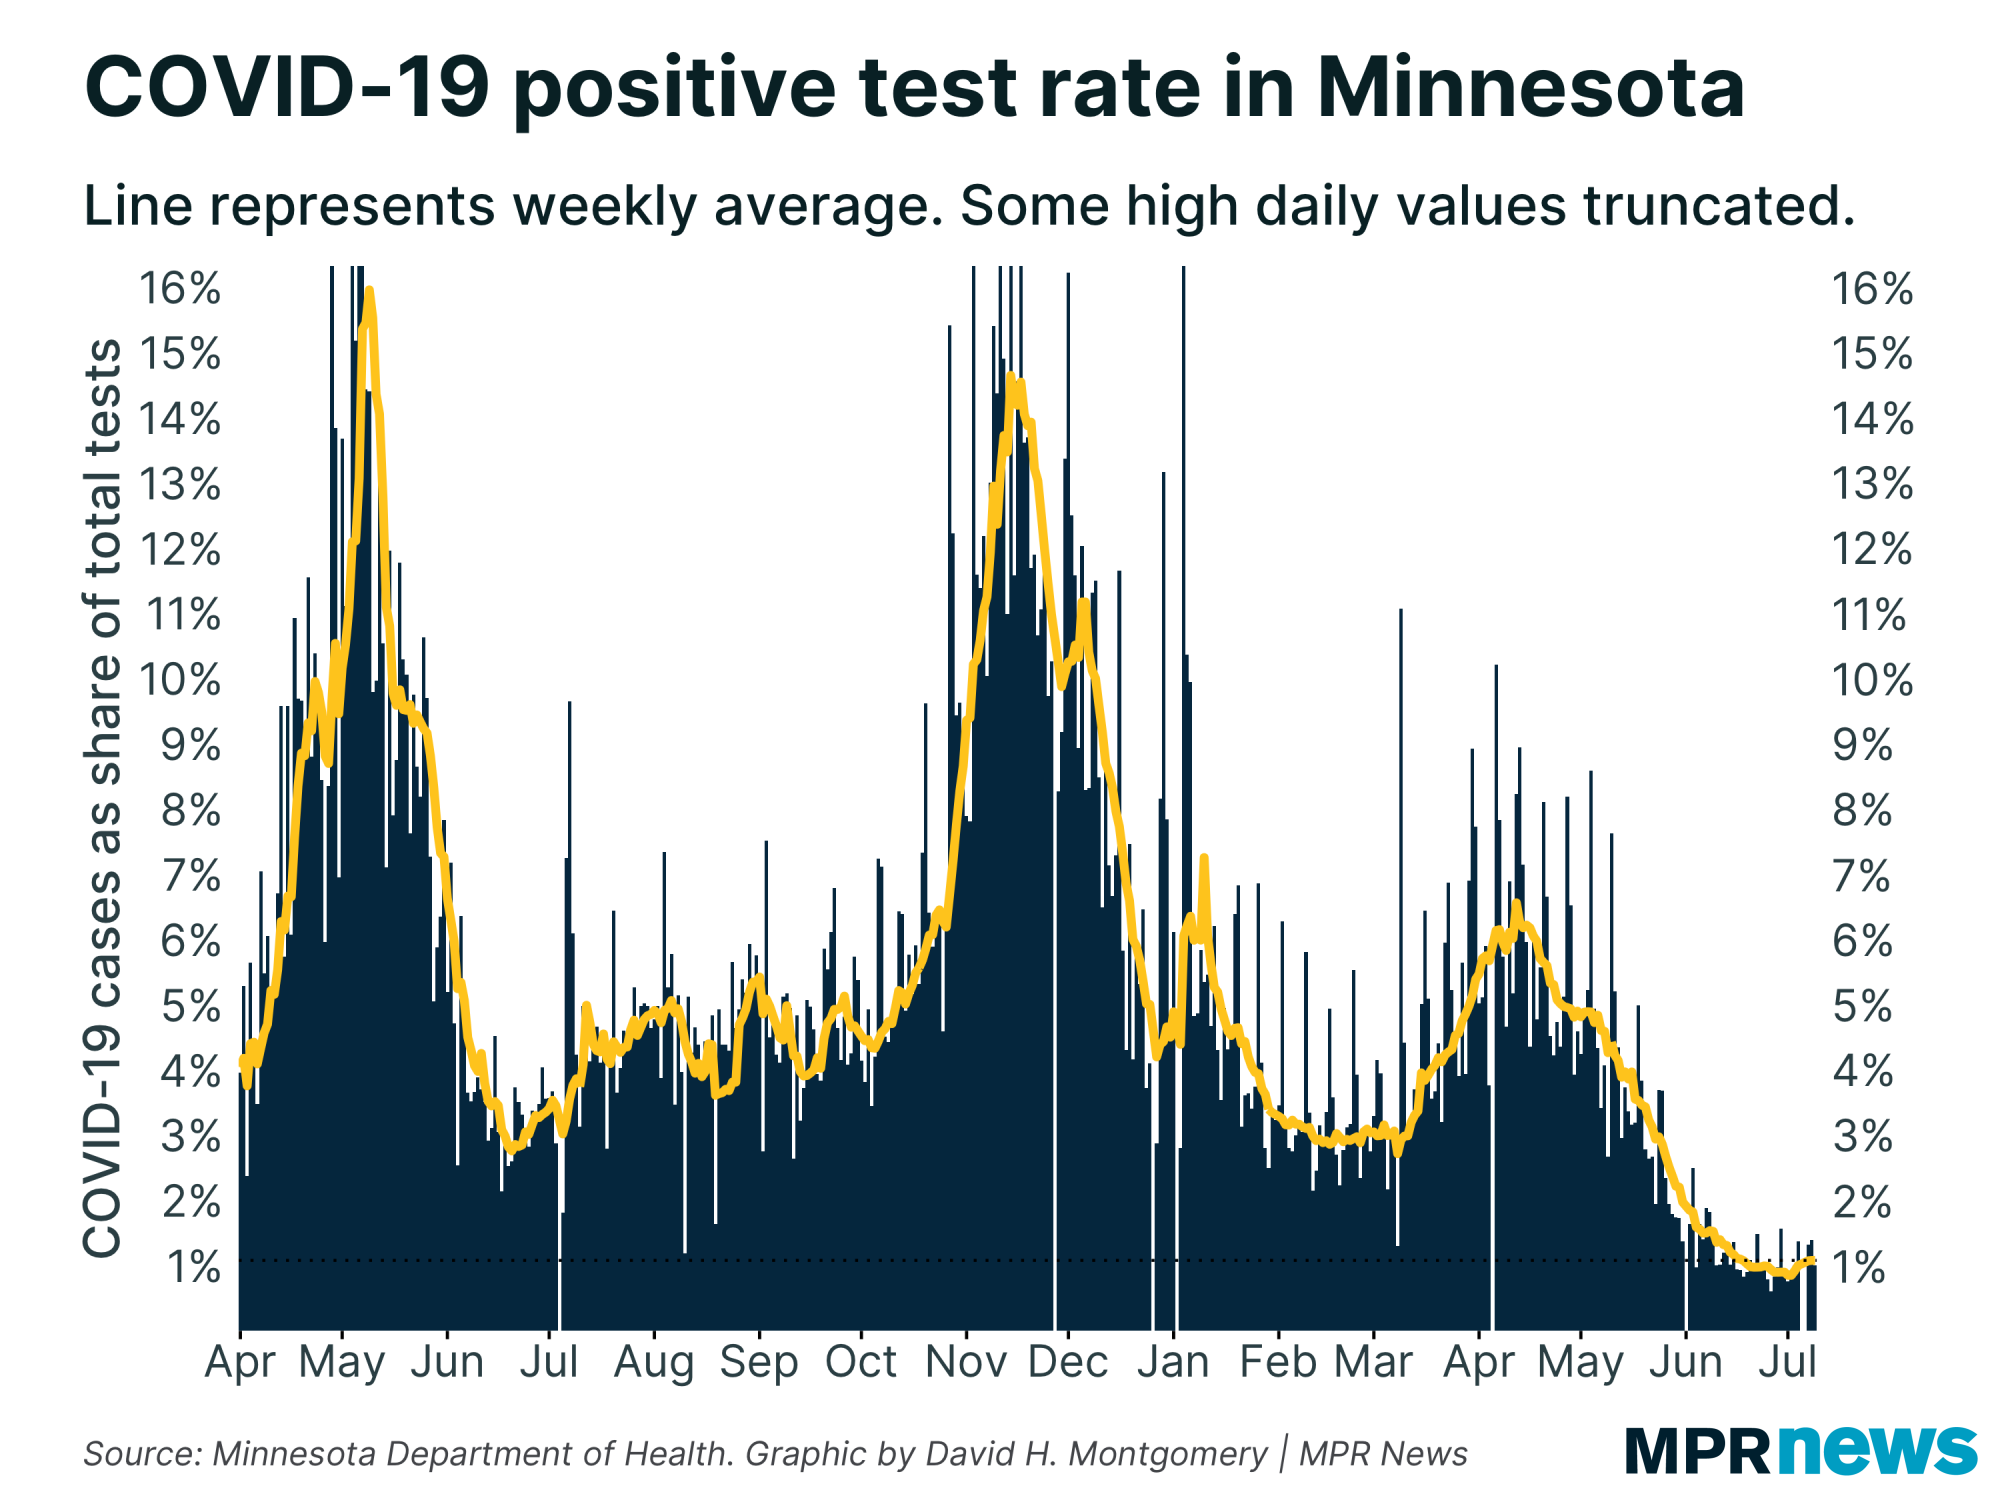
But it's also important to keep in mind the magnitude of the change so far. We're still averaging about 140 cases per day with a 1.1 percent positivity rate, which at any time before mid-June would have seemed amazingly good! We've gone up by about 50 cases per day over the course of a week. Back in March and April, it wasn't uncommon for this average to go up by 50 cases in a day.
There's nothing to say this can't accelerate, of course. It's always hard to tell in the moment whether a given rise in cases is going to peak tomorrow, or keep increasing for weeks to come.
But remember: Minnesota's spring 2021 wave was pretty mild, and at the time that hit fewer than 20 percent of Minnesotans were fully vaccinated. Today 52 percent are, plus untold numbers of others with resistance from prior infection. Delta variant or no, the number of Minnesotans who are susceptible to infection at this point is probably pretty small — though that's of course small consolation to those who do get sick at this point. |
| |
|
|
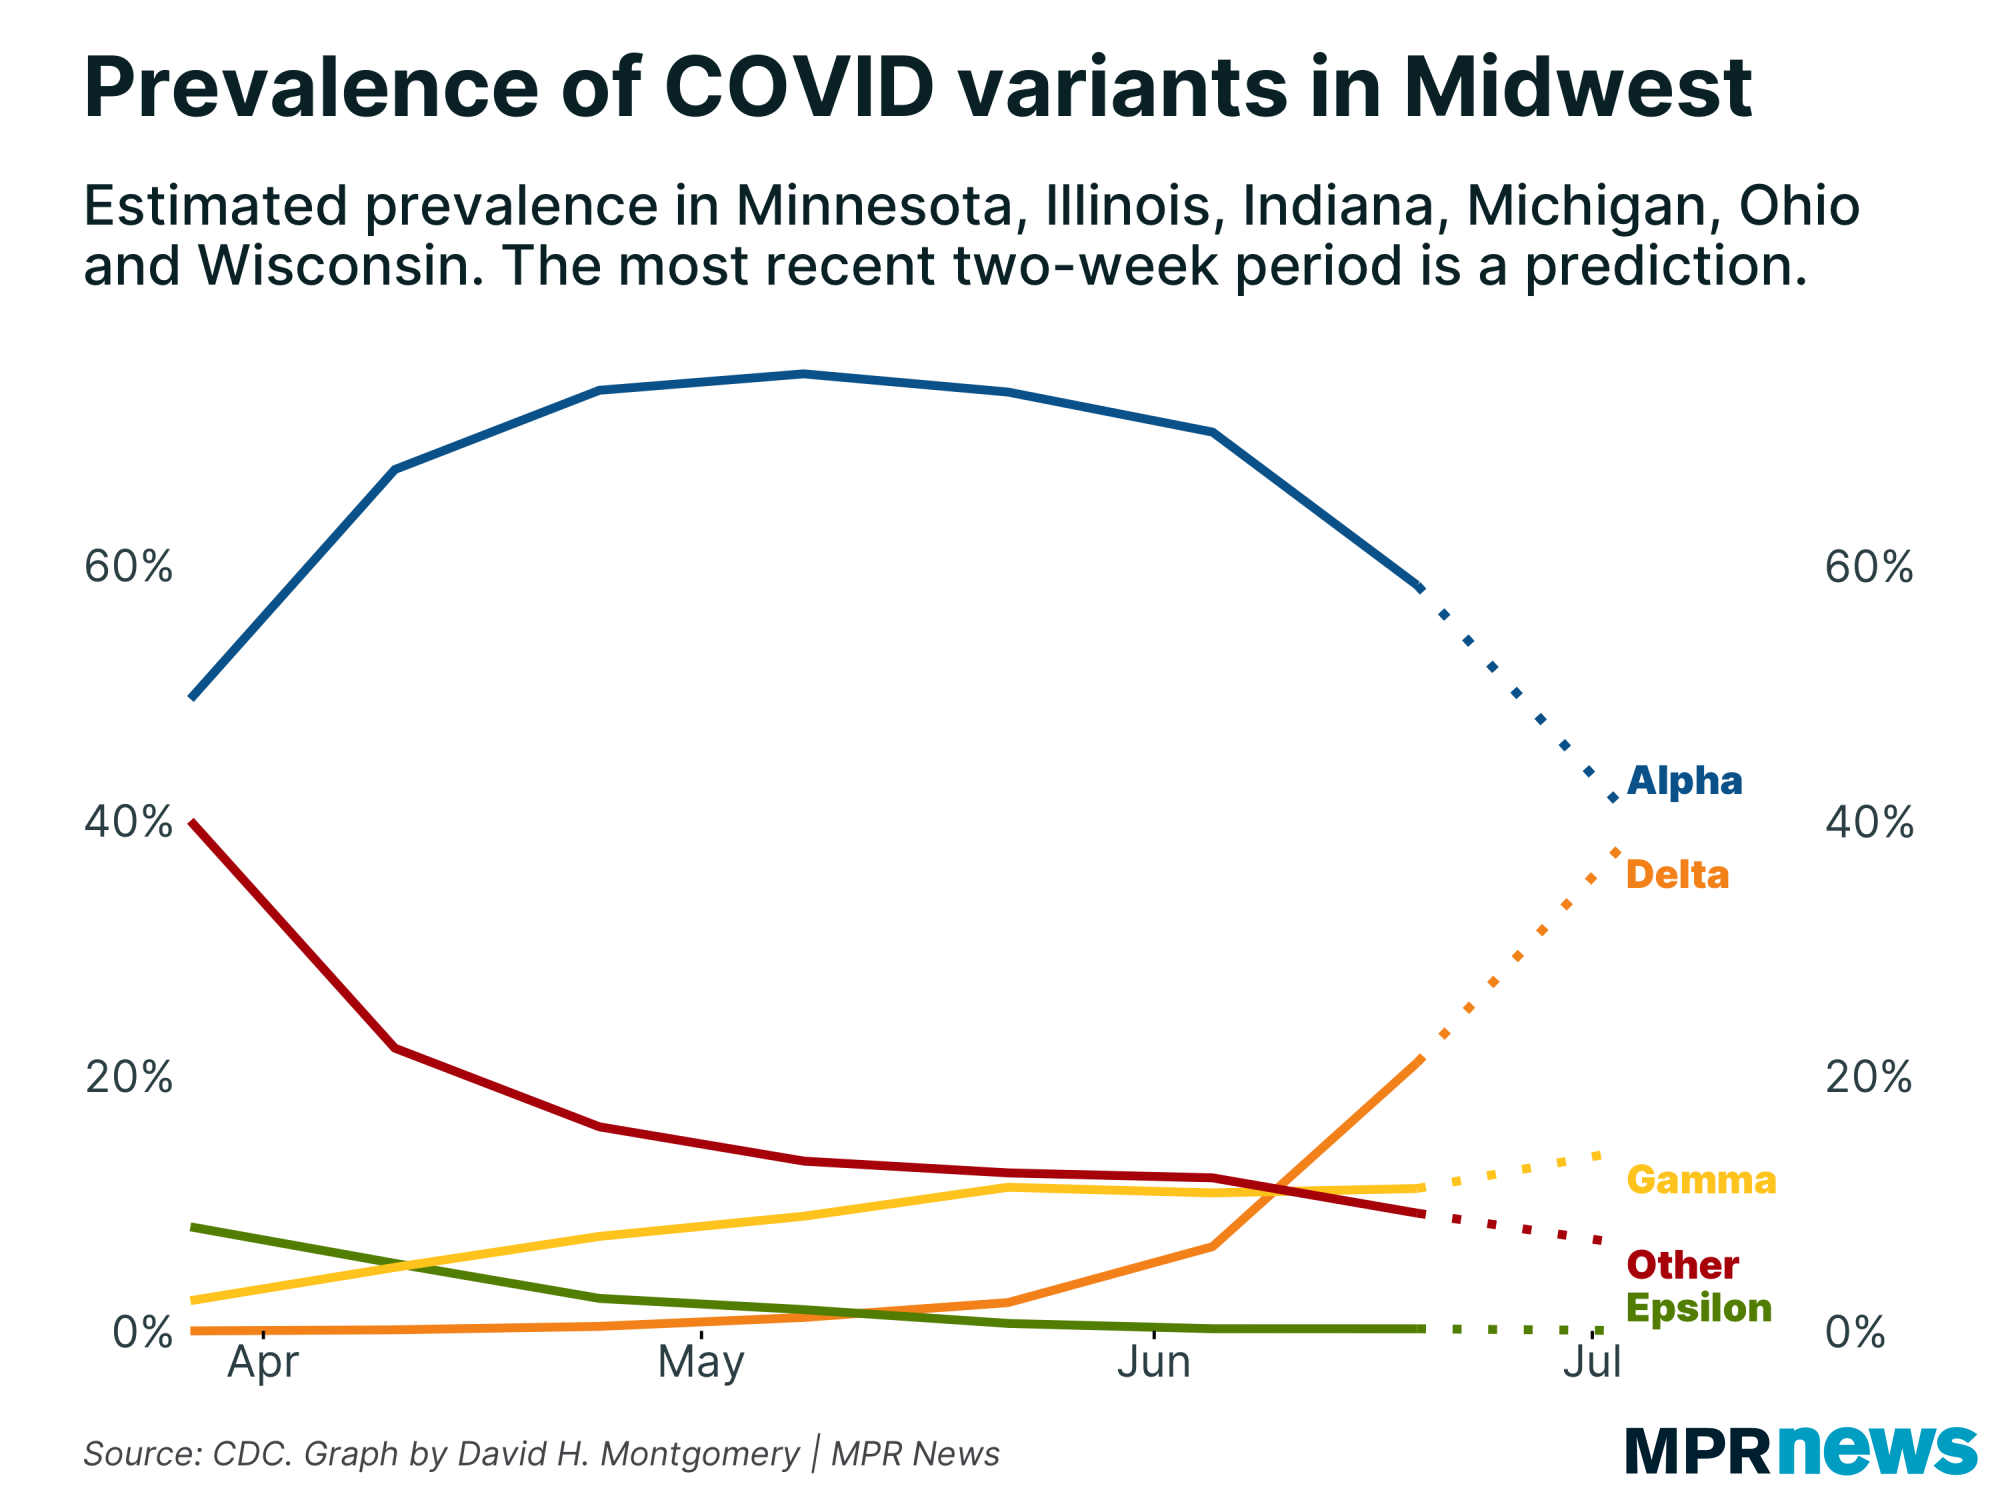
But let's talk about that delta variant. It's more contagious than past versions of the virus, and has fueled outbreaks in other states and countries around the world. We know that eventually it's going to come to Minnesota.
Unfortunately our data on this is not great. I haven't been able to find any reliable time series data of different variants' prevalence in Minnesota. The best I've got is a CDC model that's updated every two weeks, on a regional level rather than state-based.
But it's what we've got, and it shows that the delta variant is on the rise in the Midwest. It may even be dominant in Minnesota already — this data is especially unreliable in recent weeks. |
| |
|
|
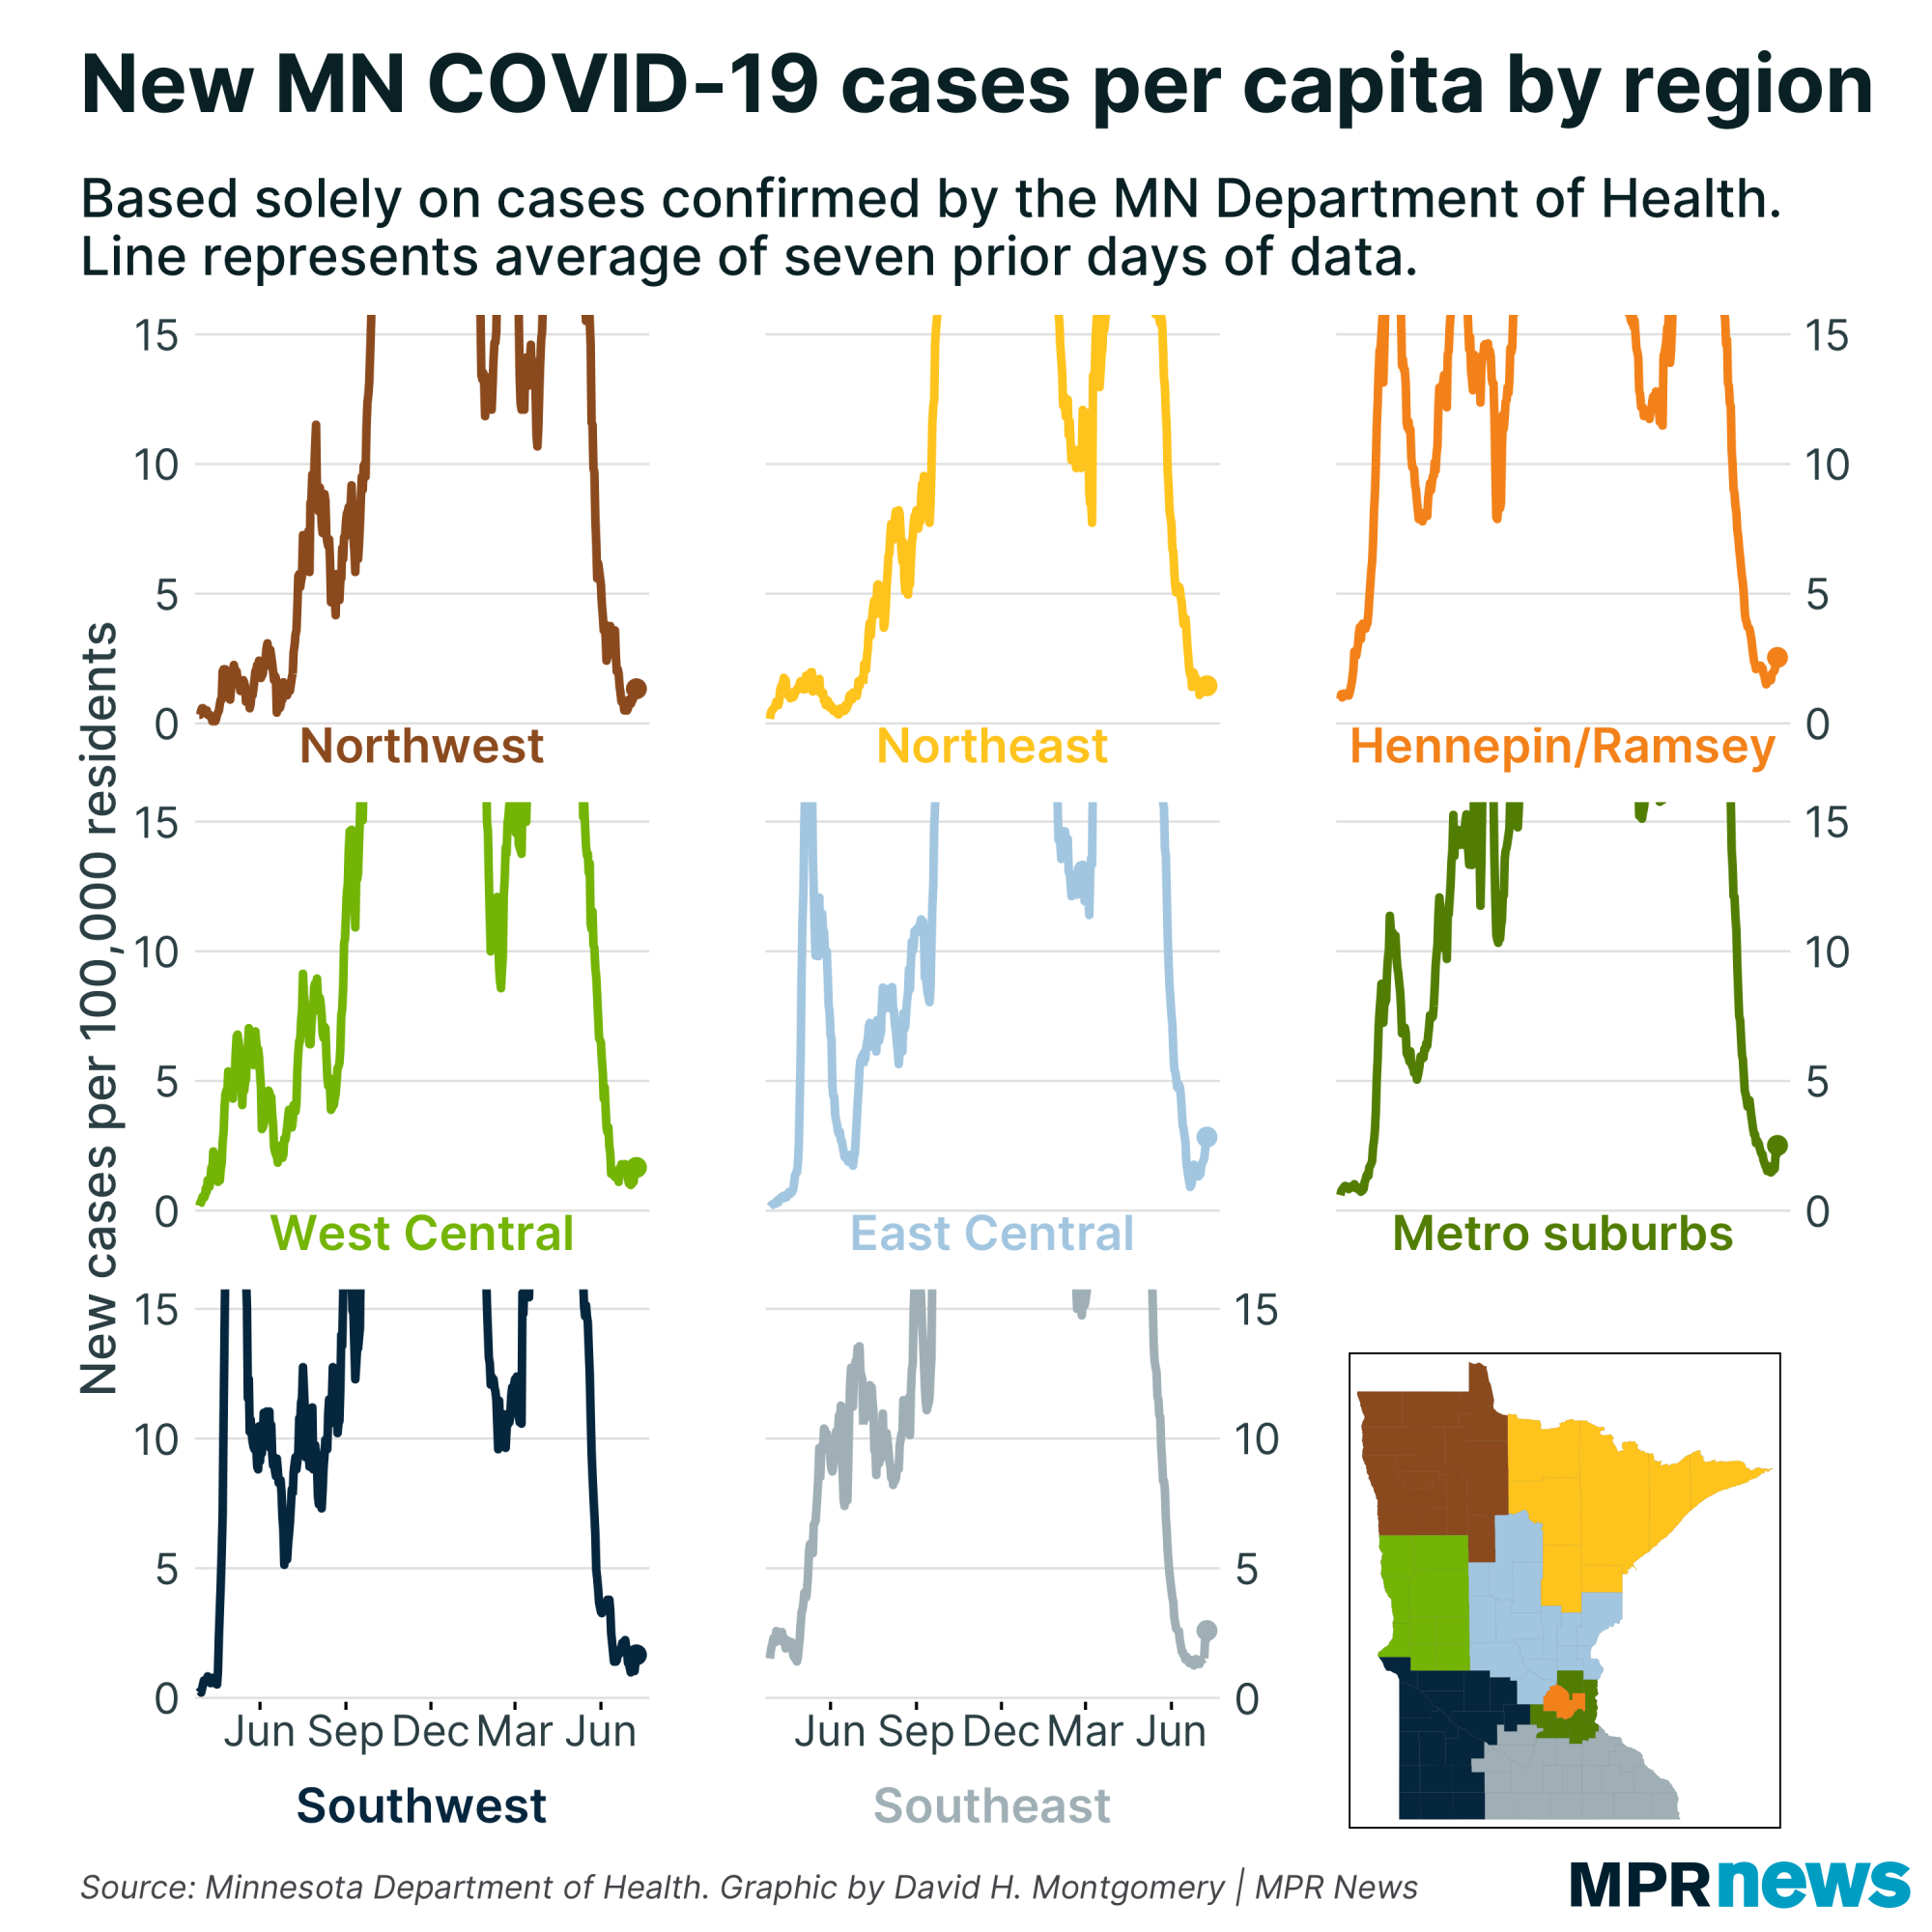
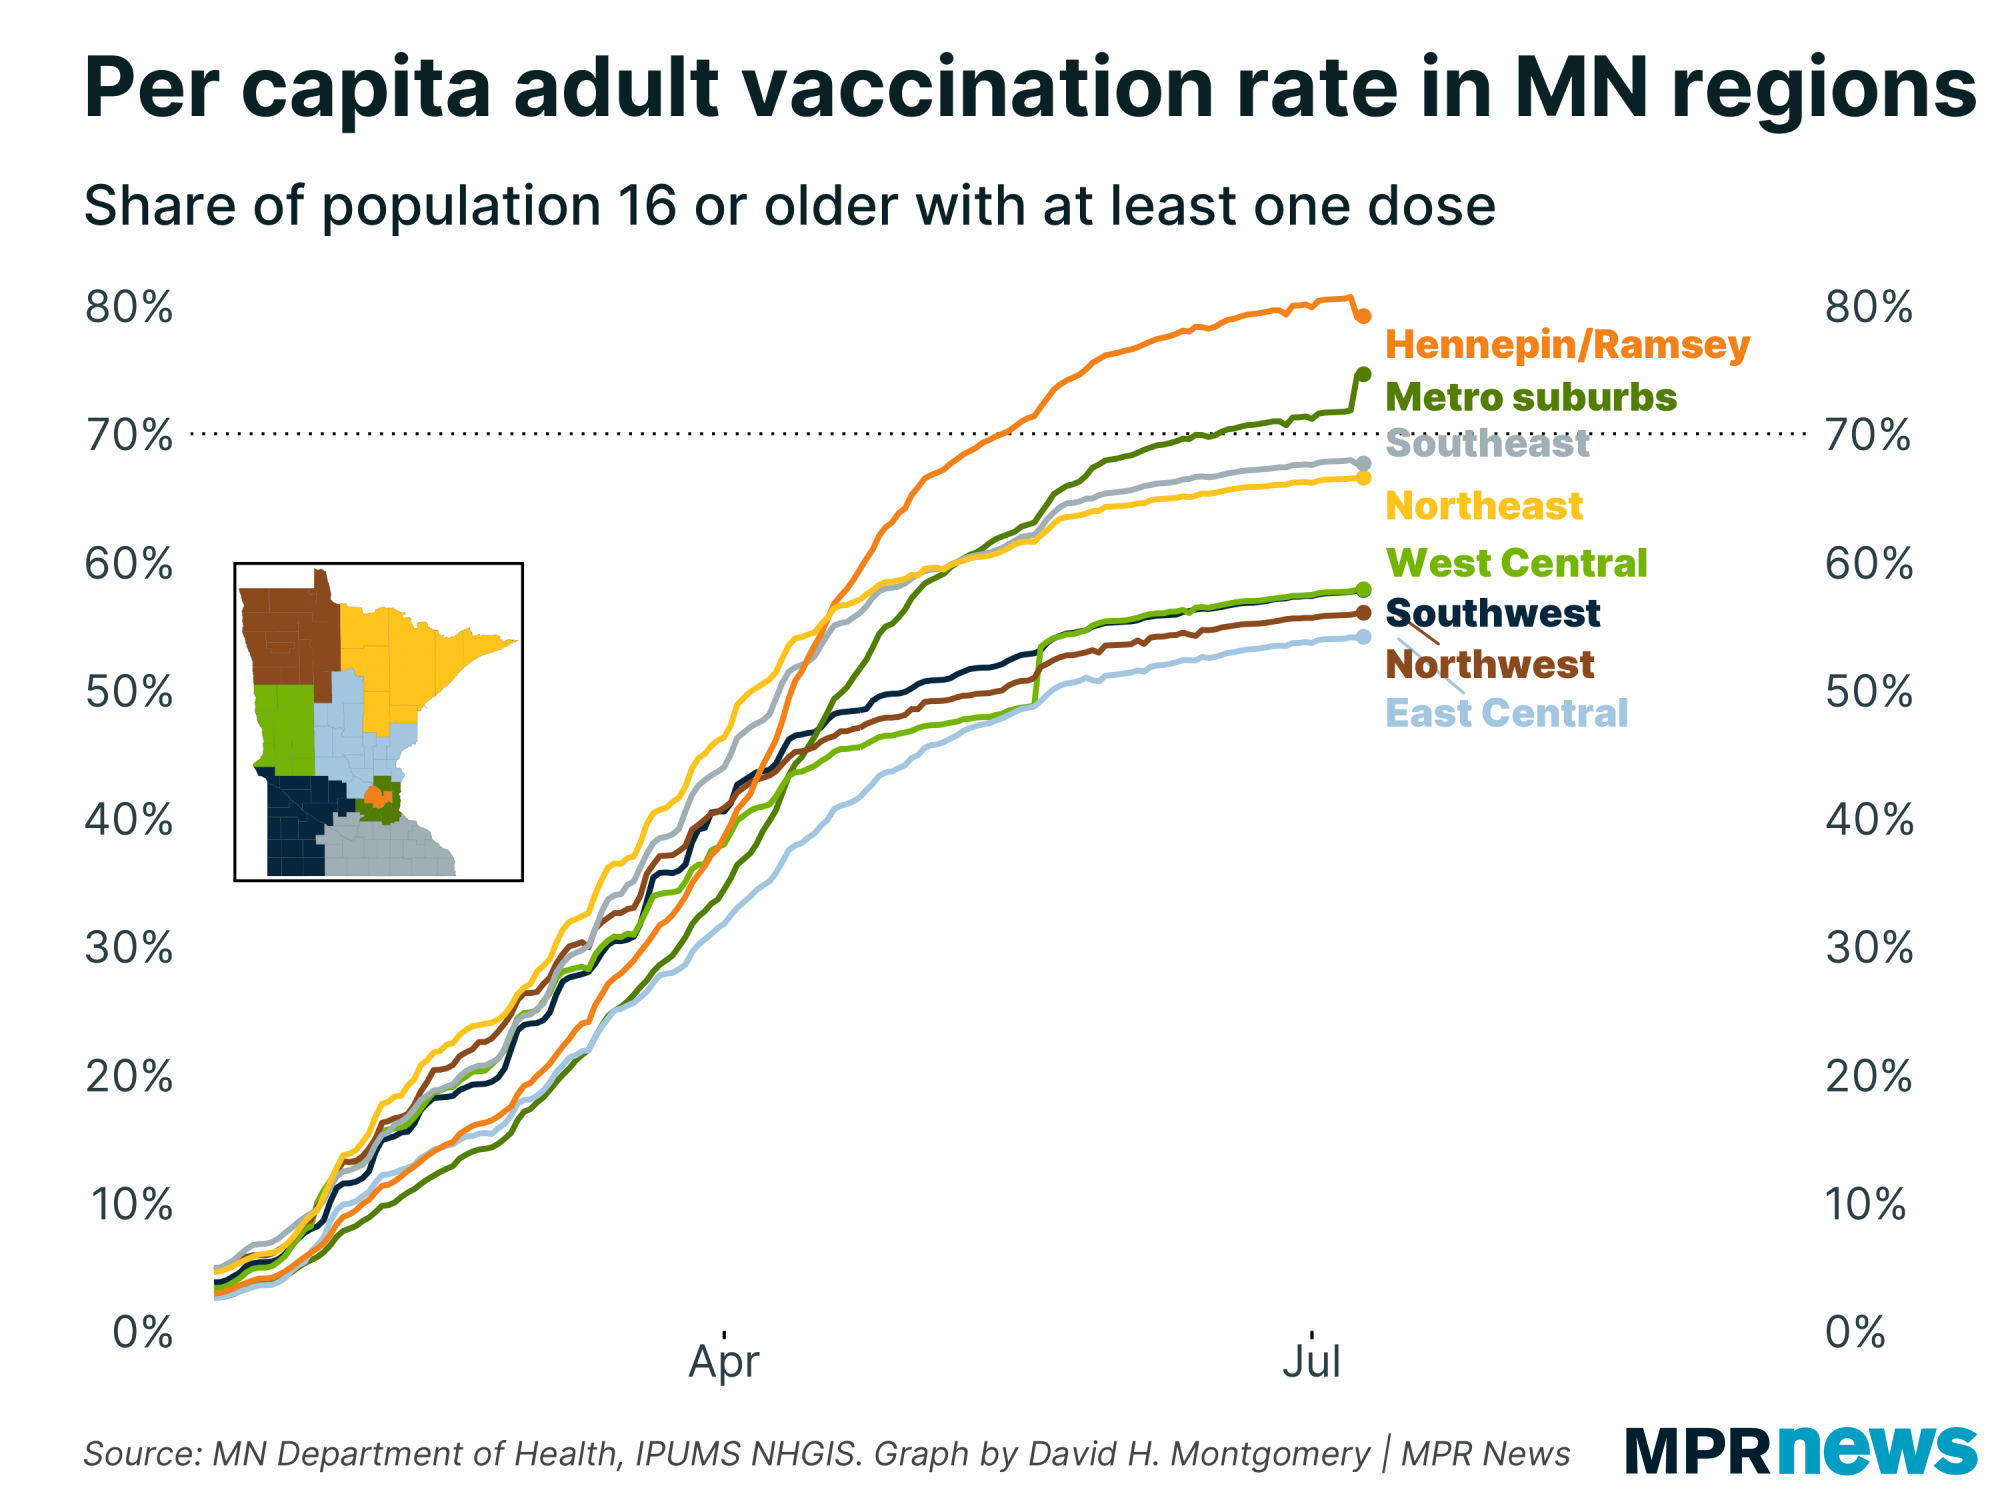
There's something else interesting about this recent rise in cases — it's not happening everywhere.
To be sure, all parts of Minnesota have seen case rates stop falling. But cases are only really rising in the eastern parts of the state, and more specifically in the Twin Cities metro, east-central and southeastern Minnesota. | |
|
|
|
Again, we shouldn't expect COVID to stay in these parts of the state. If any one lesson has come through this past year and a half, it's that if one area seems like it's not being hit by a COVID wave that's cresting elsewhere, wait at least a few weeks before popping the champagne. The virus usually spreads.
Prevalence in all these areas is well below the 5 cases per 100,000 level that's often seen as a warning sign.
Interestingly, there's no real correlation here with vaccination rates. The Twin Cities has the highest vaccination rate in the state, while east-central Minnesota has the lowest; both are seeing minor upticks right now. |
| |
|
|
(Ignore those weird spikes in Hennepin/Ramsey and the metro suburbs — that's due to data cleaning, which I'll get into more below.)
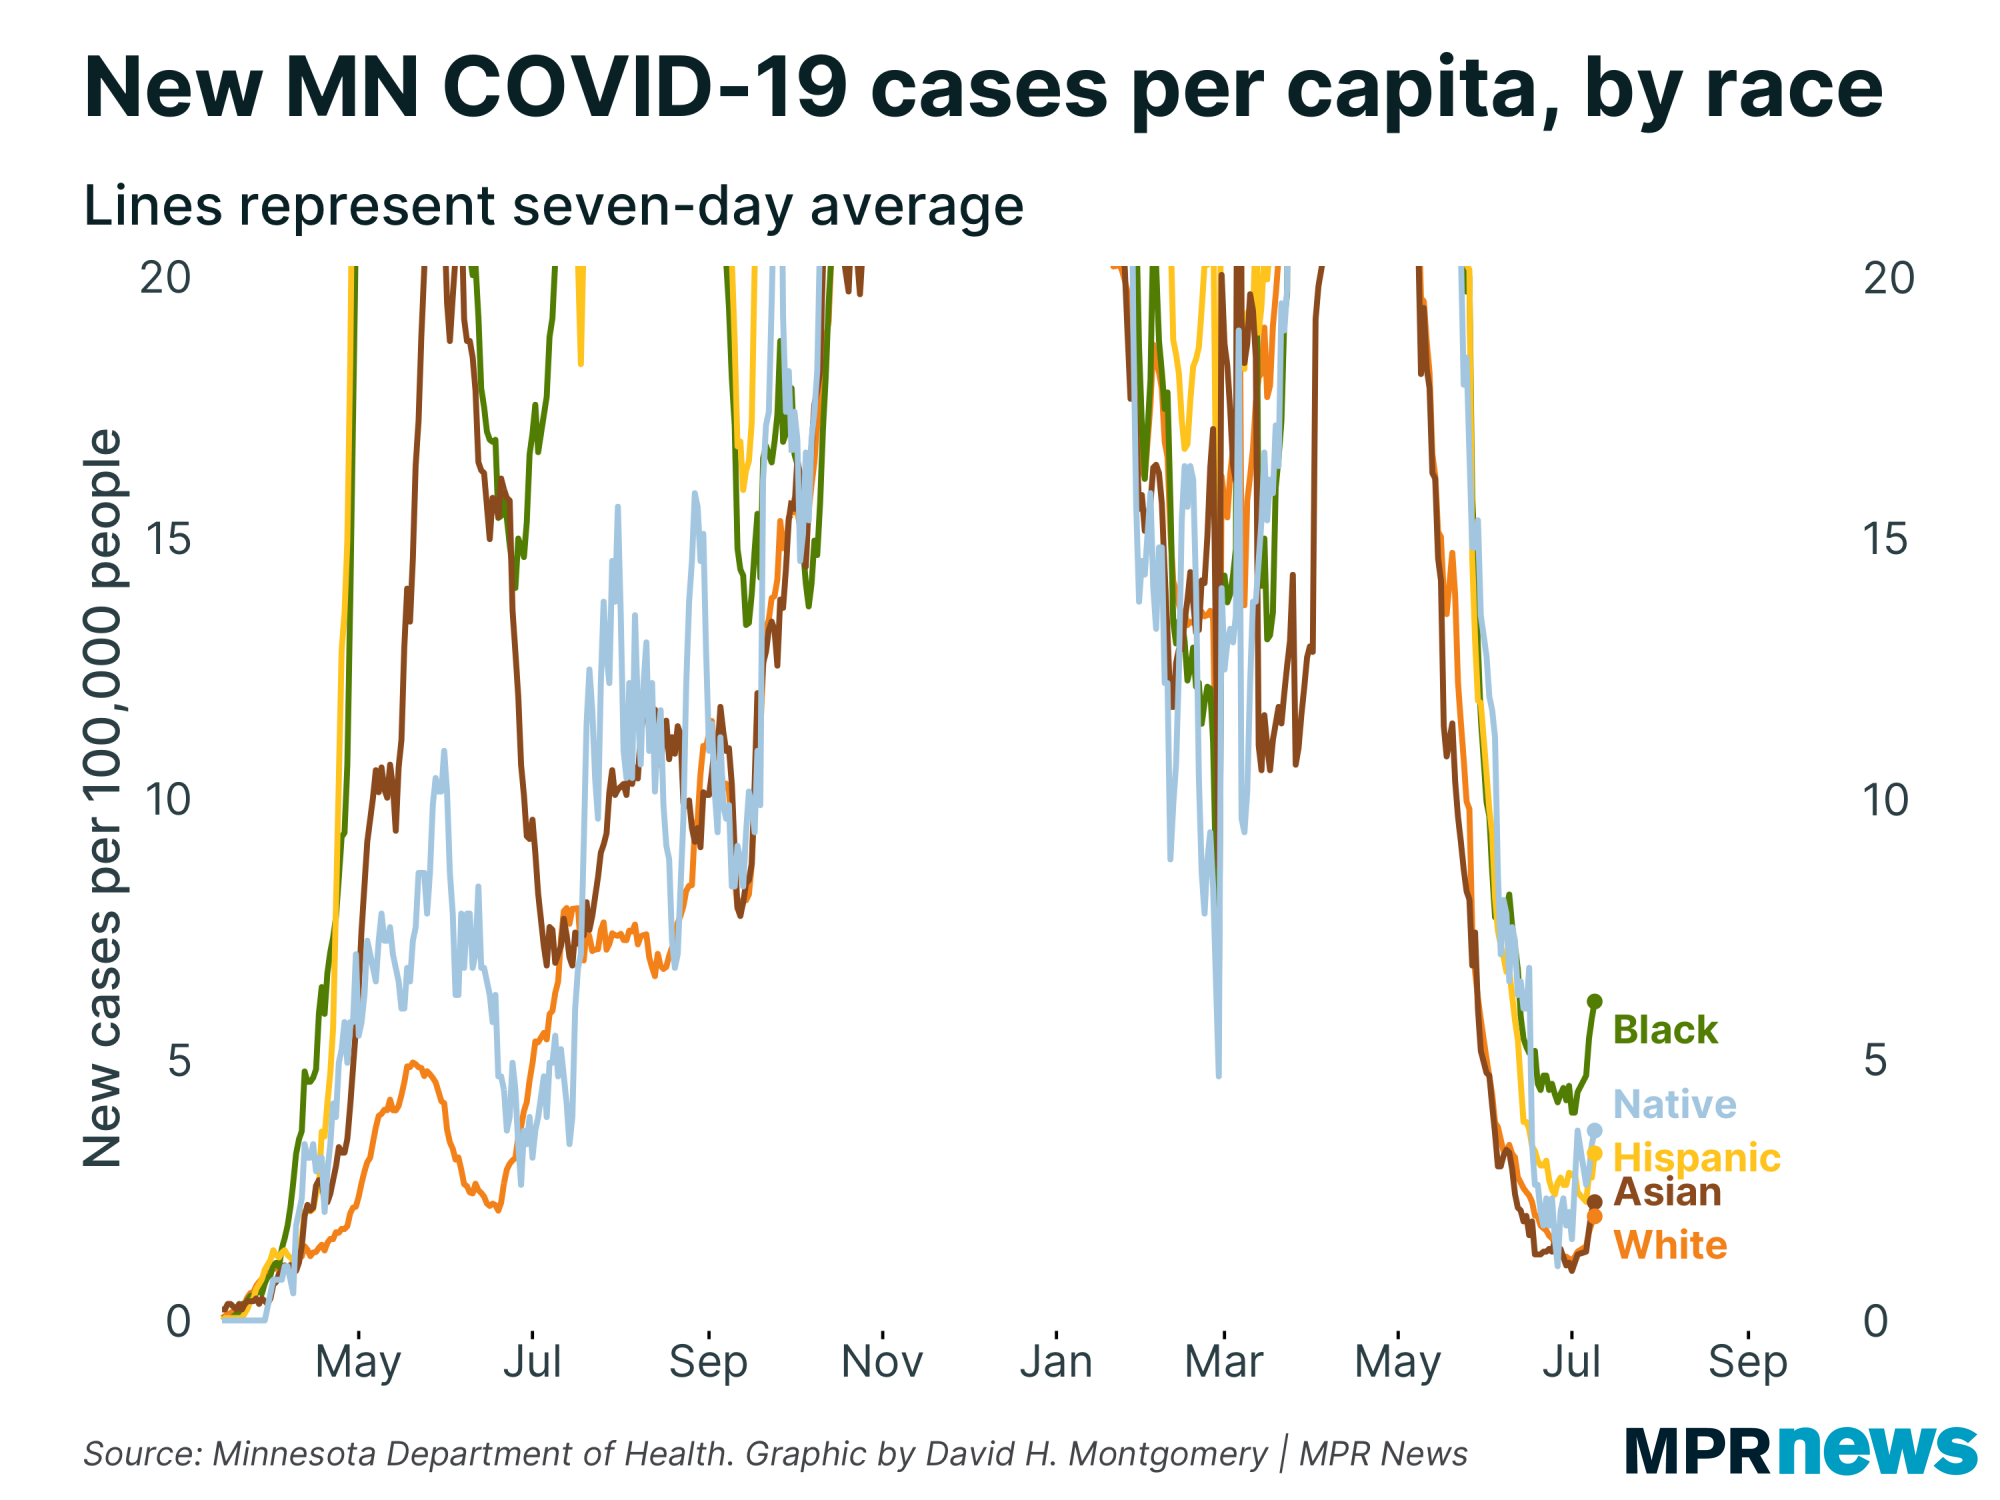
The rise in cases is most pronounced among Black Minnesotans, who have both the highest reported rate of any racial or ethnic group, and the largest jump. | |
|
|
|
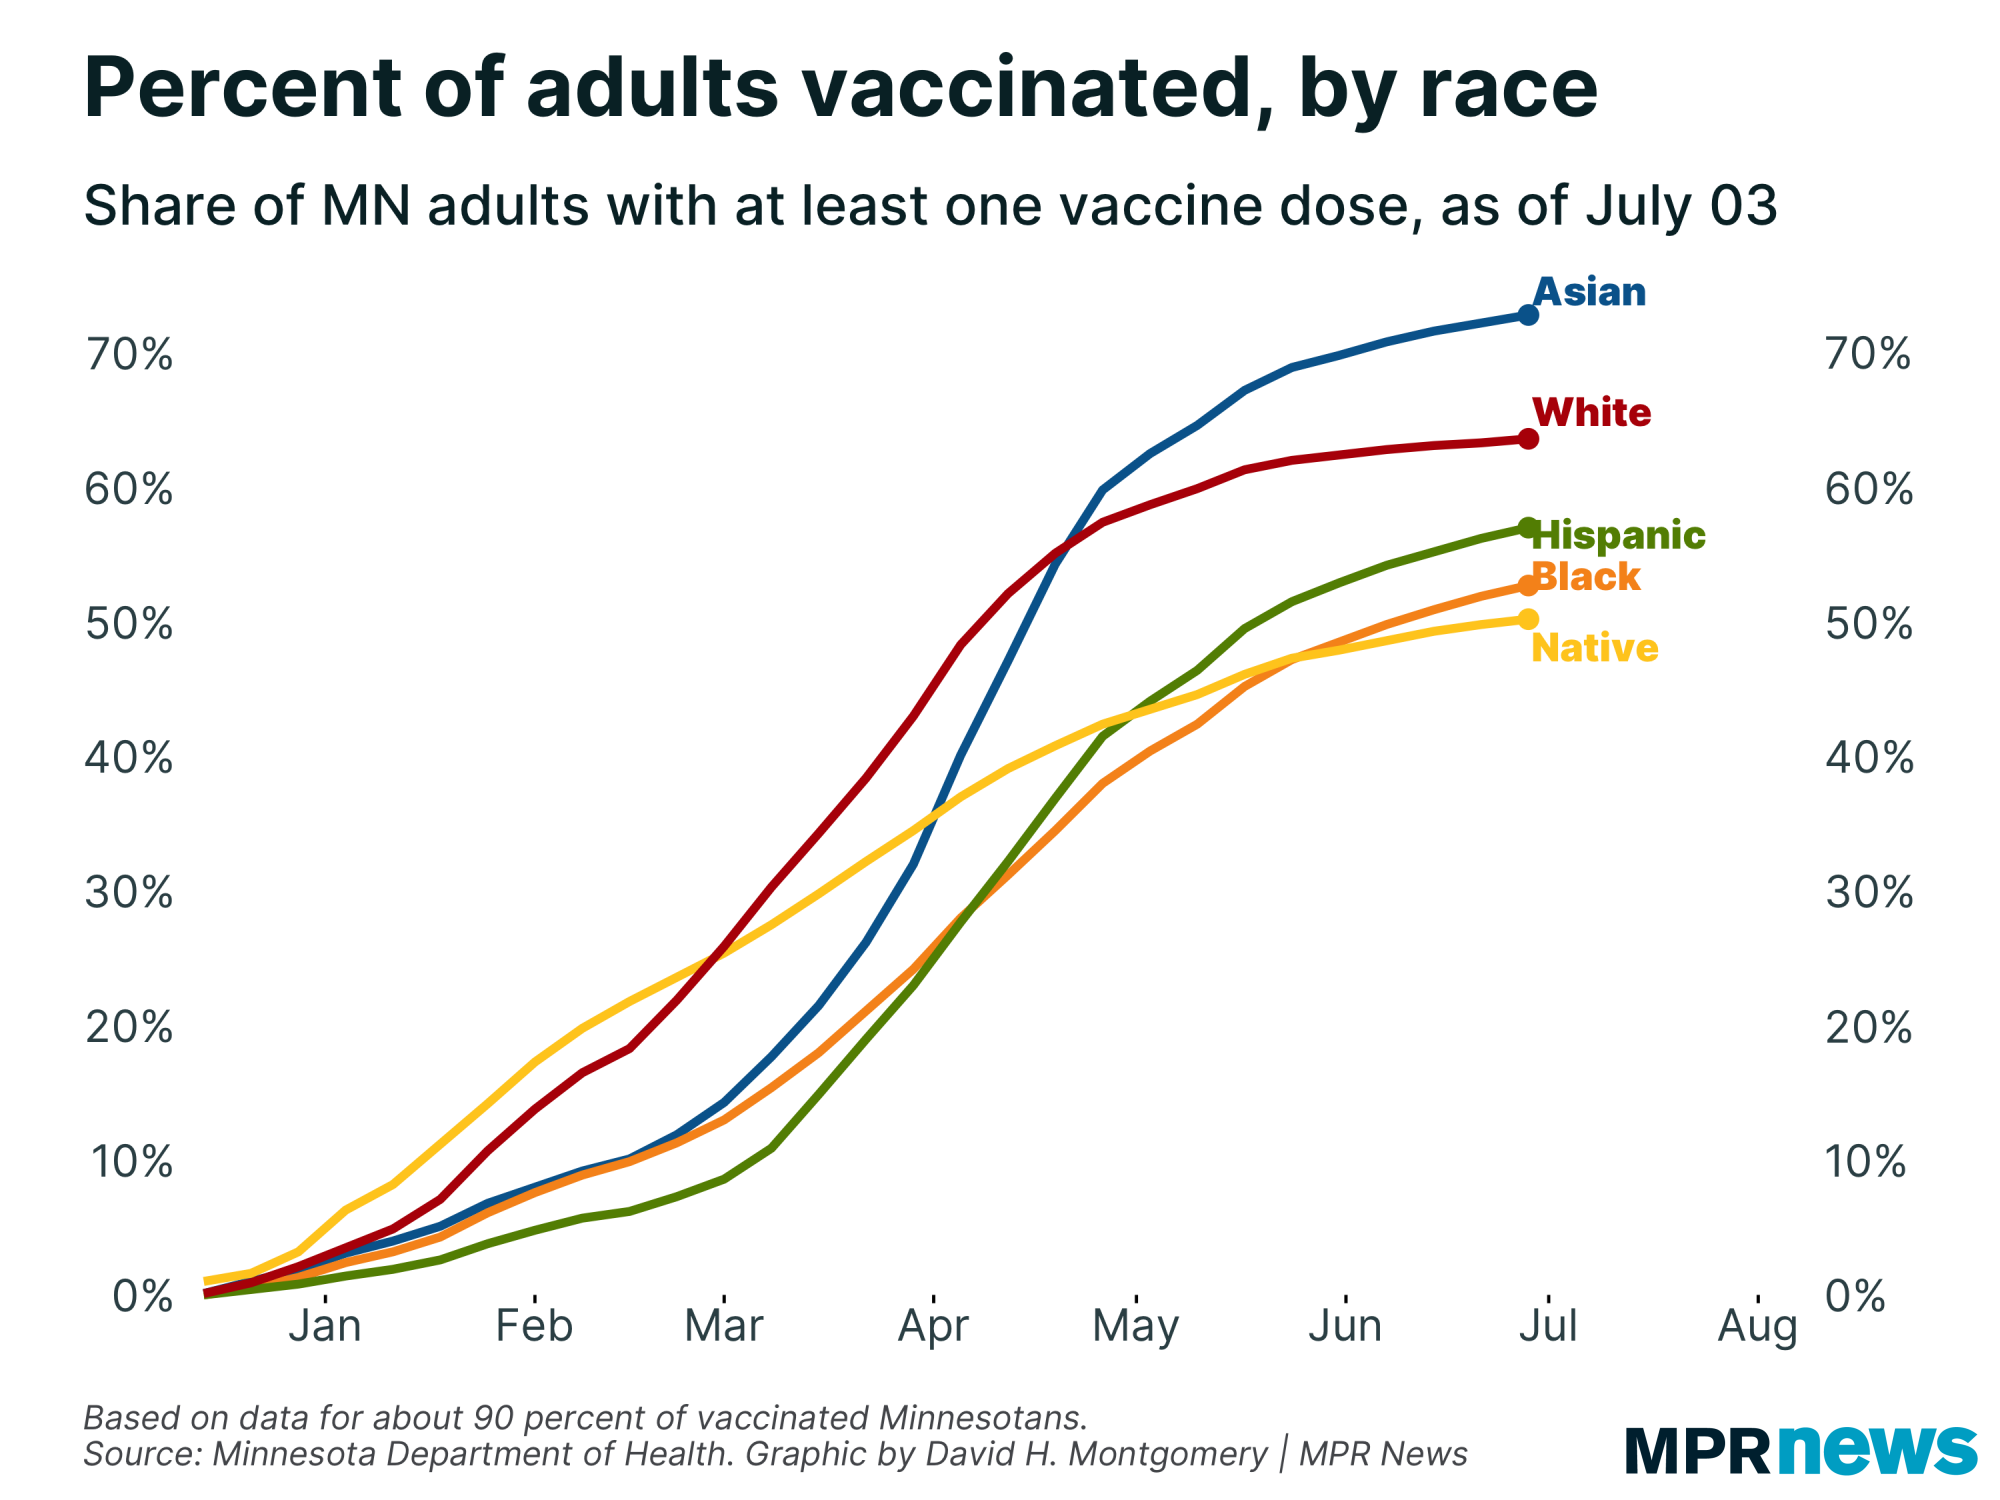
| Here there is a striking correlation with vaccination data; Black Minnesotans have one of the lowest vaccination rates of any racial/ethnic group. | | |
|
|
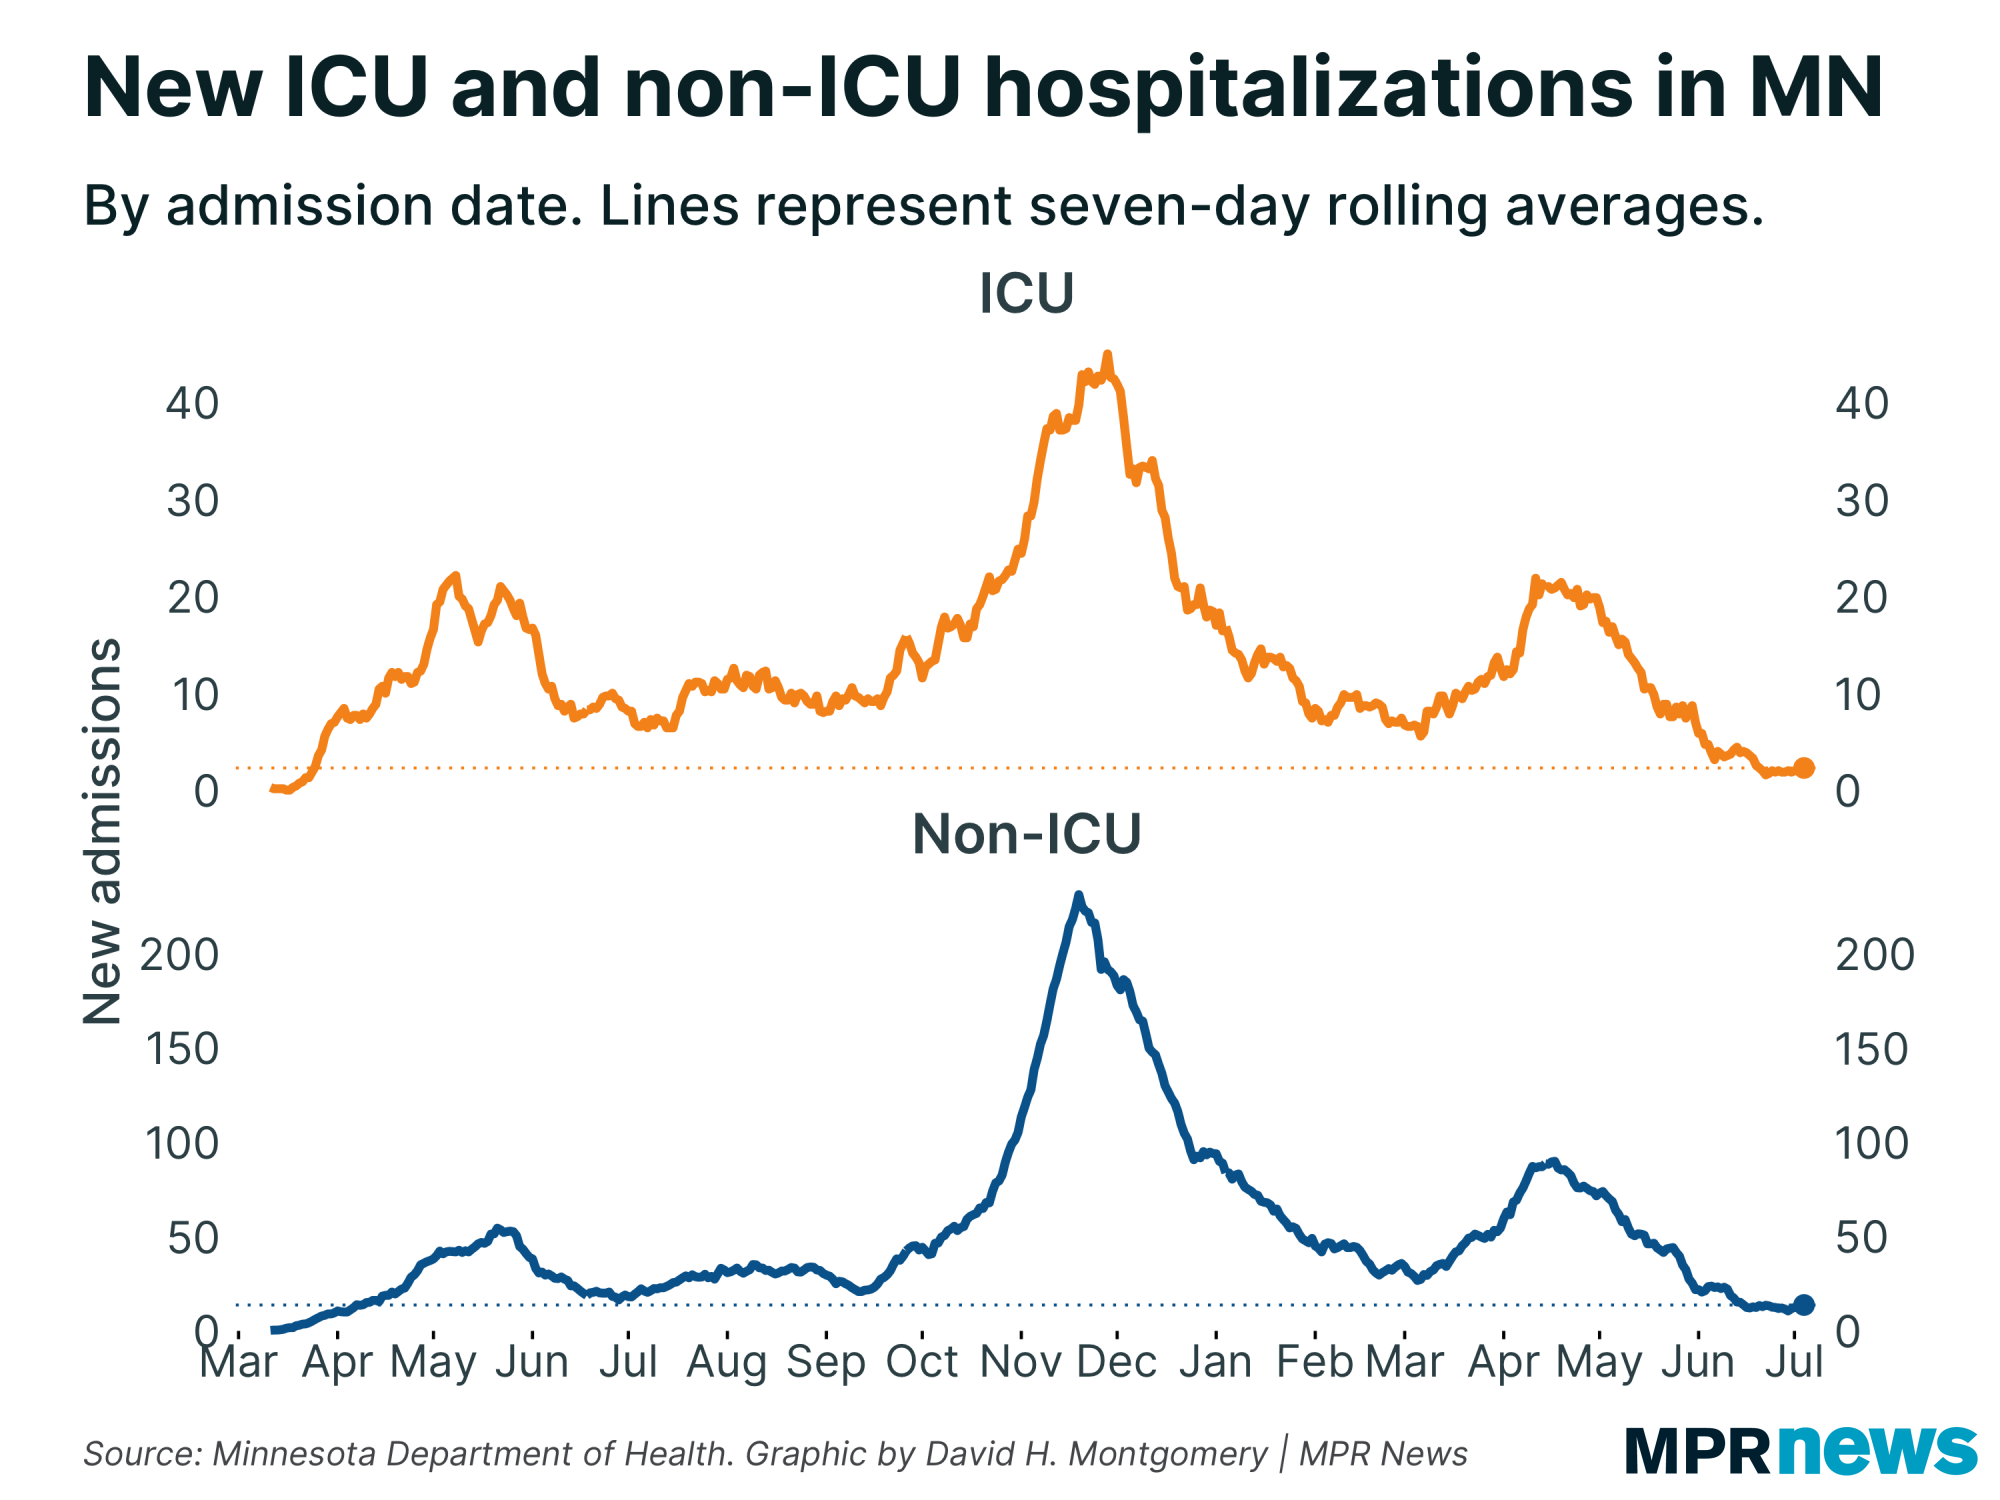
| One thing we aren't seeing yet is any significant increase in COVID-19 hospitalizations. This stopped declining a week or two ago, but has held stable ever since at around 2 ICU admissions and 12 non-ICU admissions per day. | | |
|
|
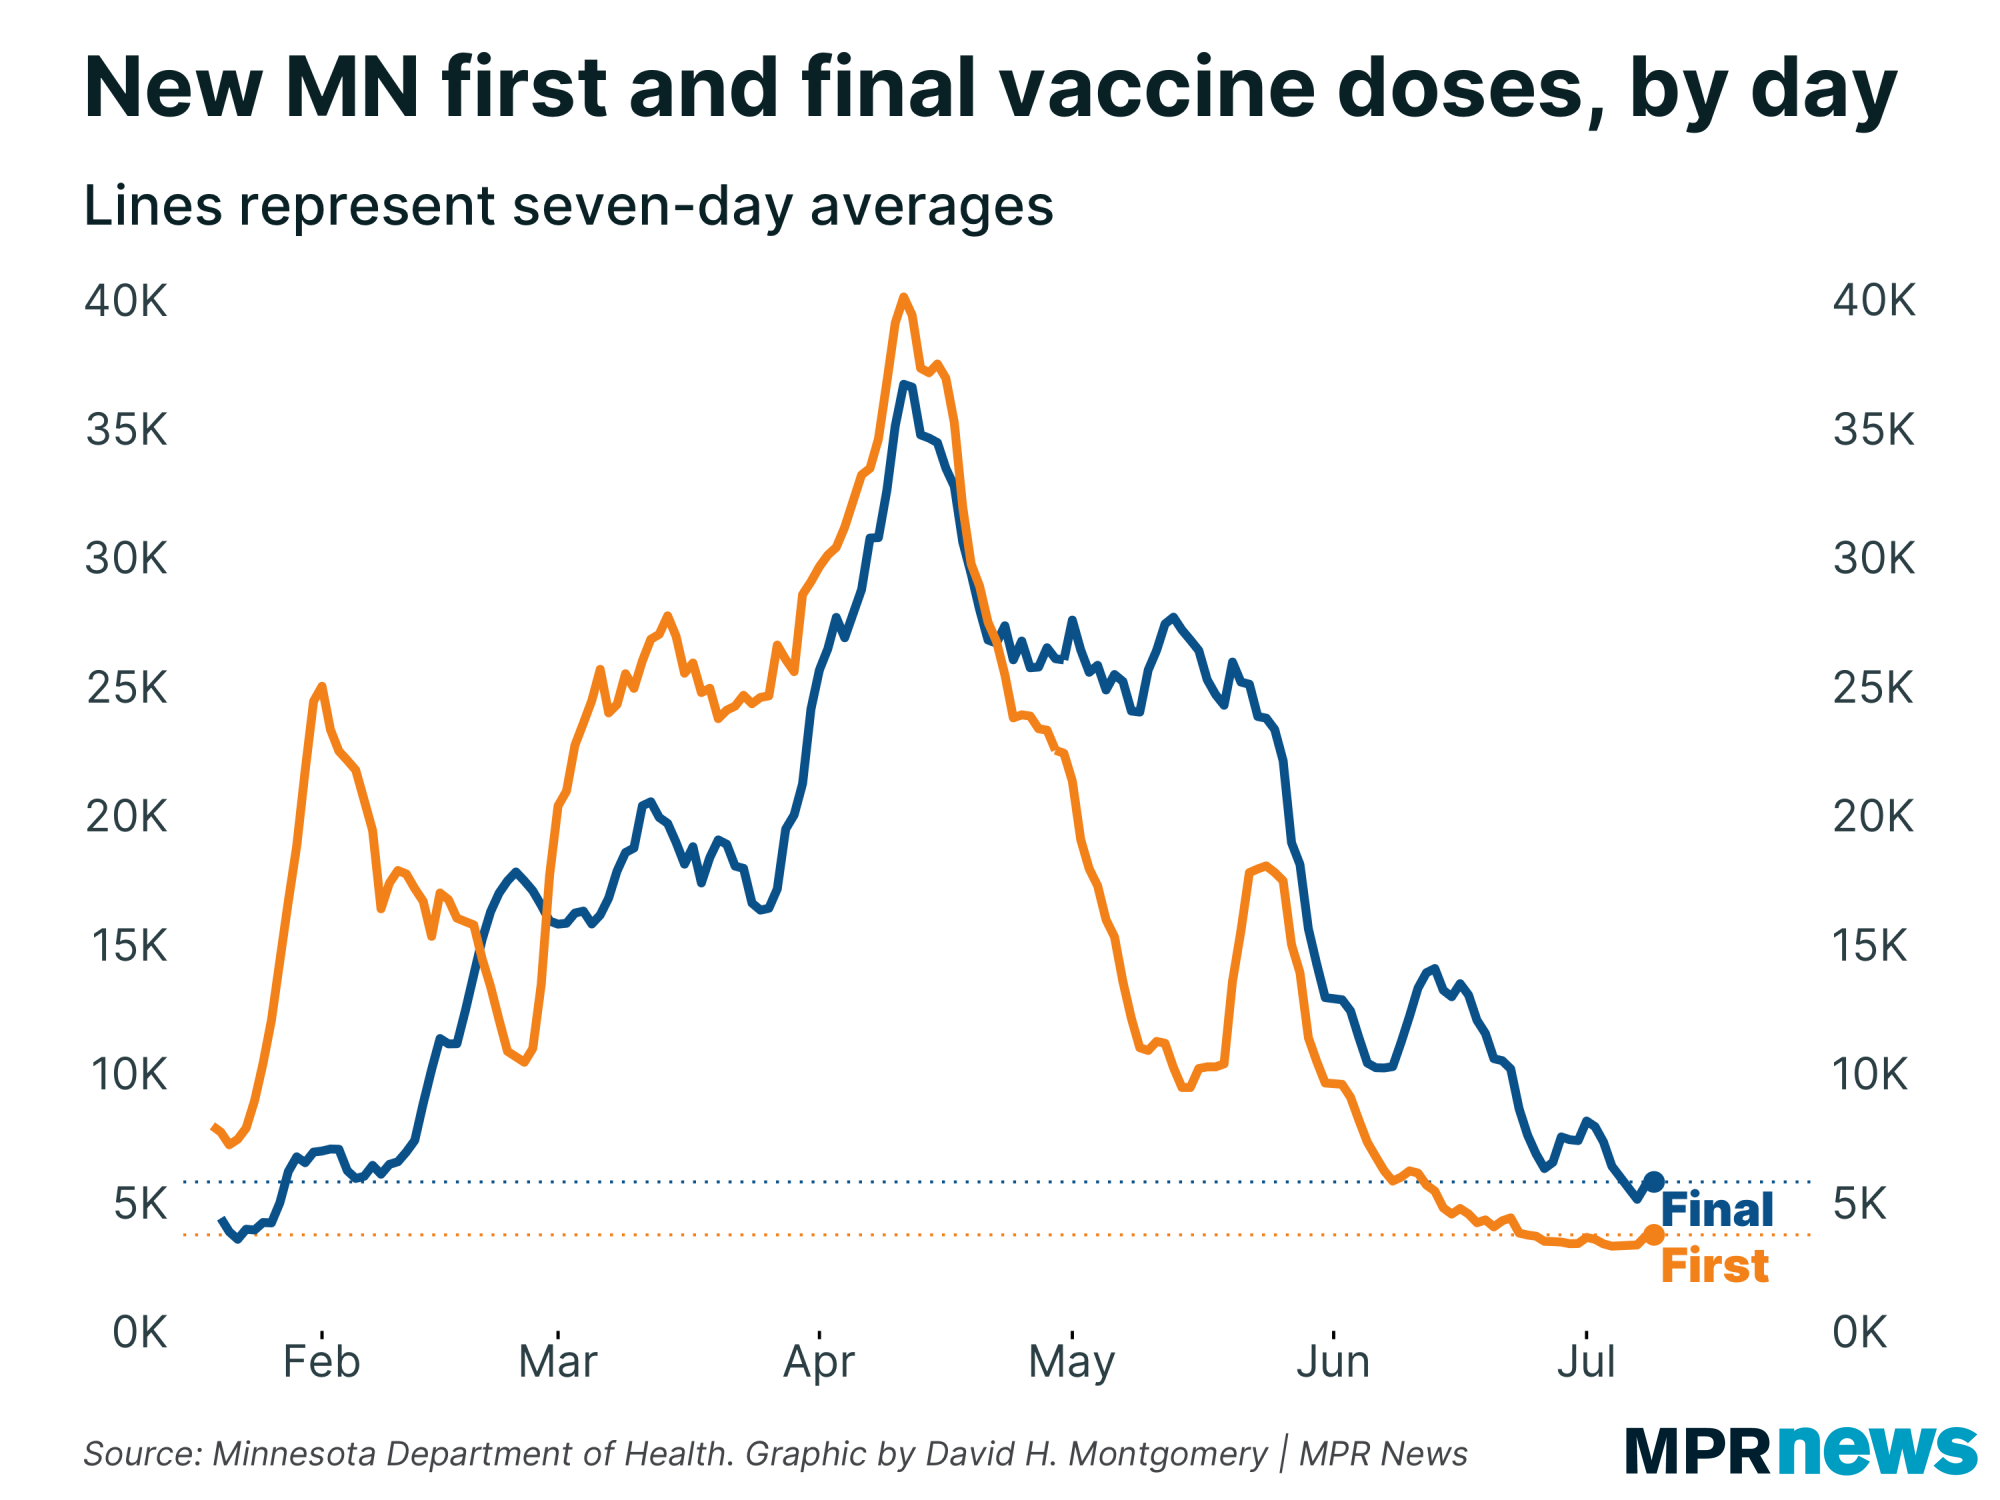
| Finally, a desultory check-in with Minnesota's vaccination rates, where there's no real news to report. New vaccinations have remained flat for some time time now, at around 3,000 new first doses per day (an order of magnitude below where we peaked in April). | |
|
|
|
Below, I'll explore a few more stats about Minnesota's COVID-19 outbreak. If you want to learn more, I also recommend these other articles:
| | |
|
|
Deaths still falling
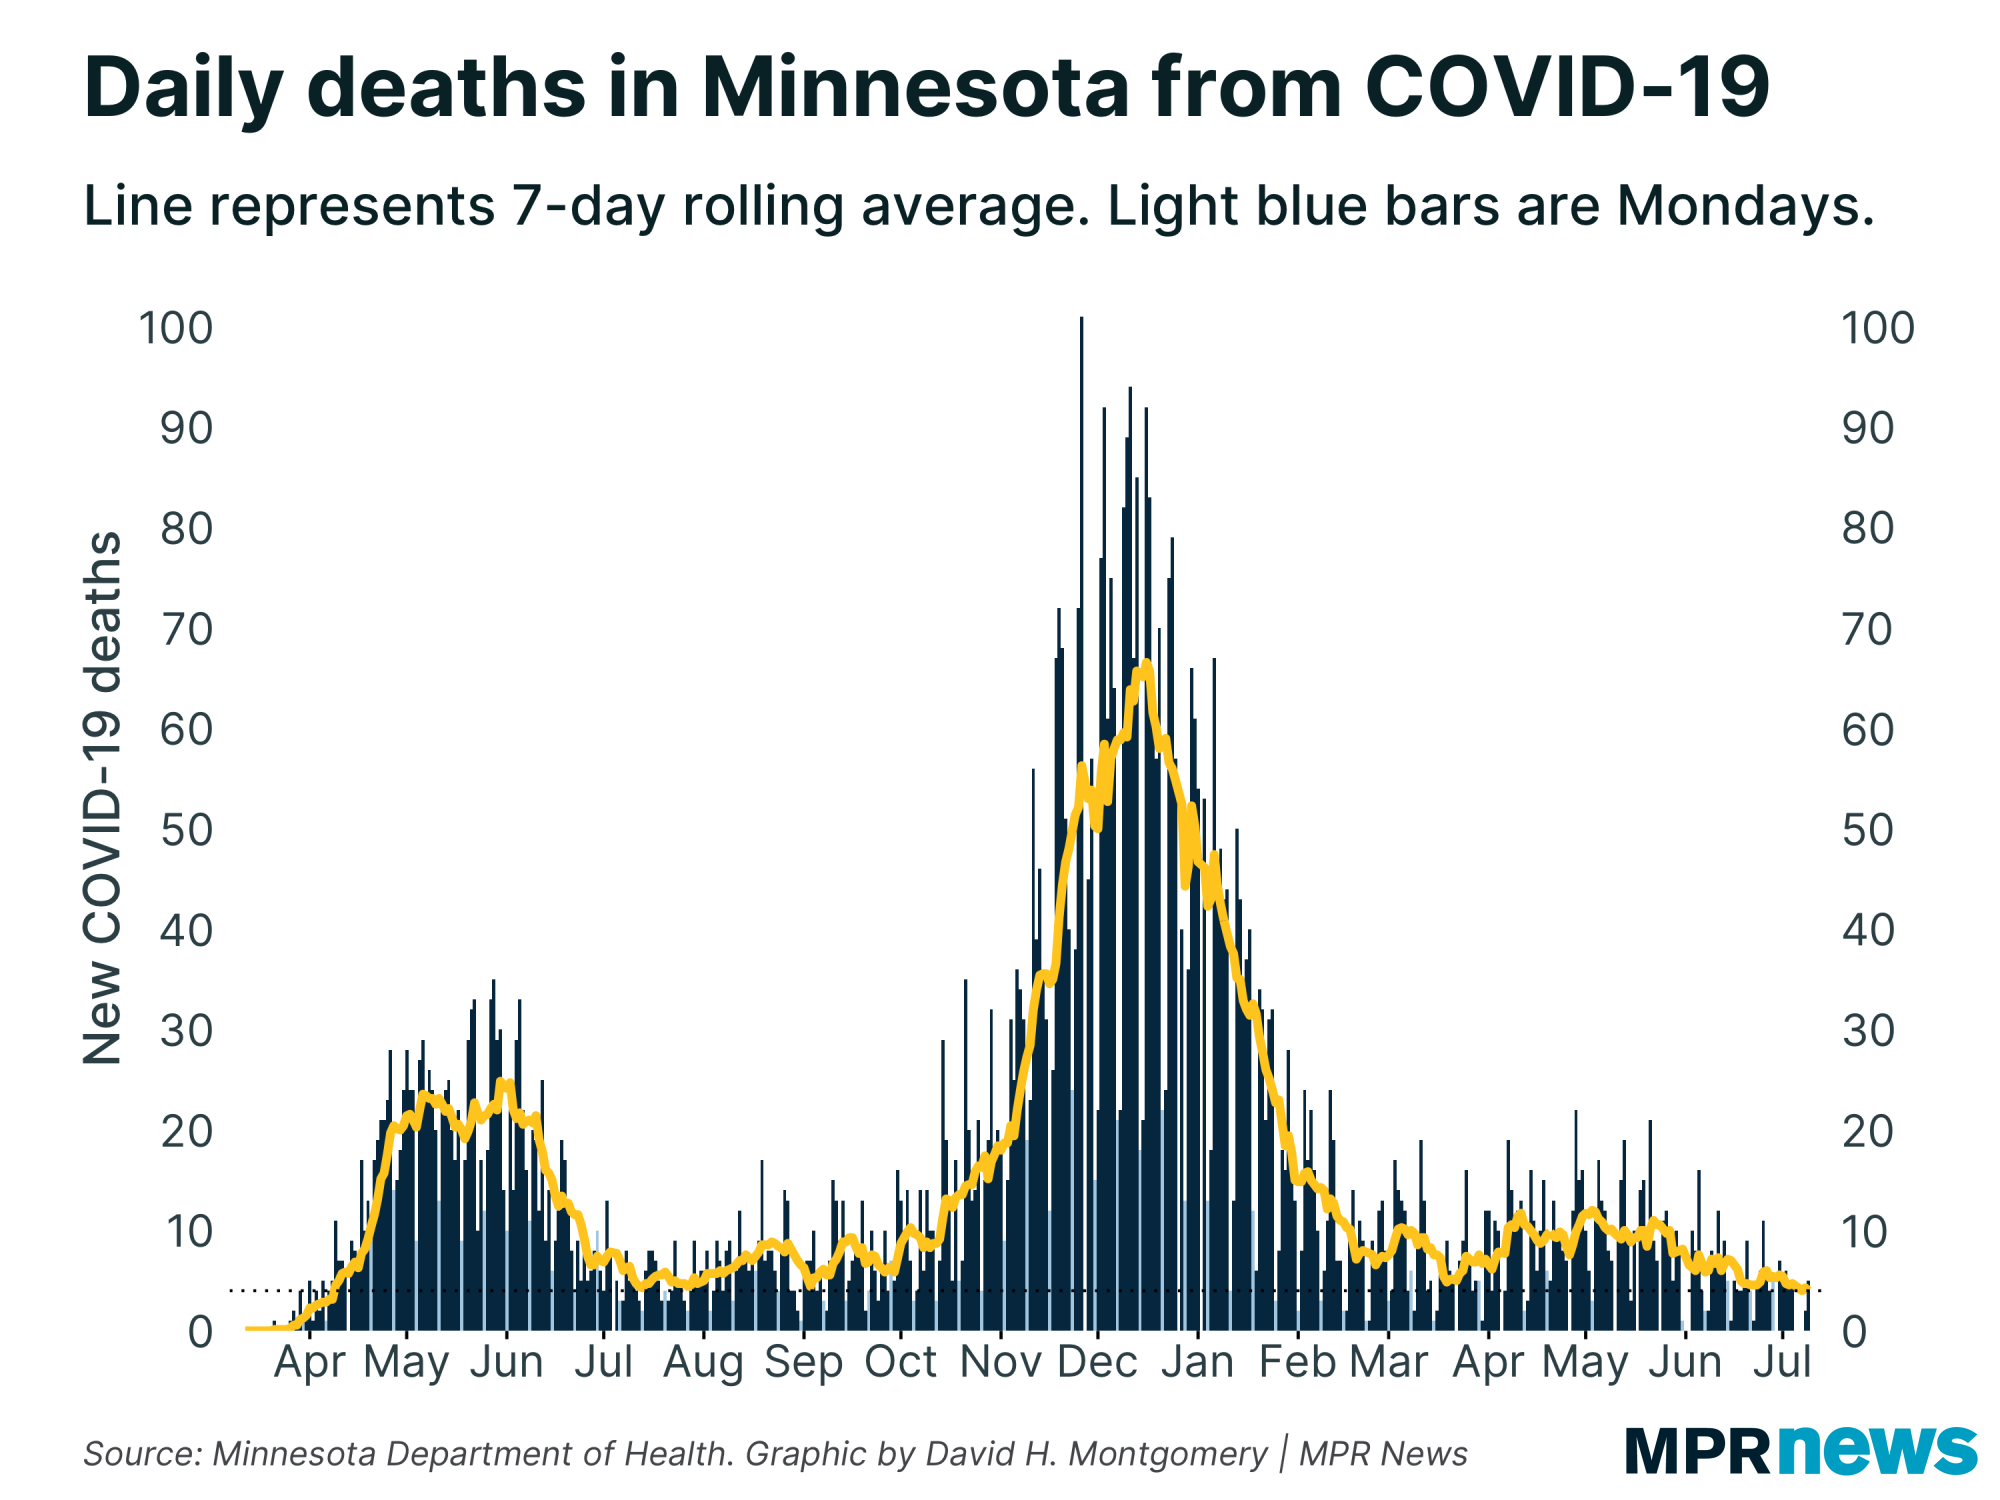
| The best news we've had in recent days has been the long-awaited decline in Minnesota's COVID-19 death rate.
Over the past week we've averaged four new COVID-19 deaths per day, which is basically as low as we've seen since the earliest weeks of the pandemic. |
| |
|
|
| A month ago, Minnesota was averaging around 7 COVID-19 deaths per day. The decline here has been frustratingly slow, but it is happening. | | |
|
|
Data cleanup shifts Minnesota's vaccination geography
|
Earlier this week, the health department added a note to their regular COVID-19 data update: they had updated their stats on vaccinations by county to more accurately reflect the the residences of some people who lived on county borders.
(The technical explanation: the state had used ZIP code to assign people to counties, but some ZIP codes cross county lines, so they had to find a way to sort out these people in border ZIPs. This week they rolled out what they said was an improvement.)
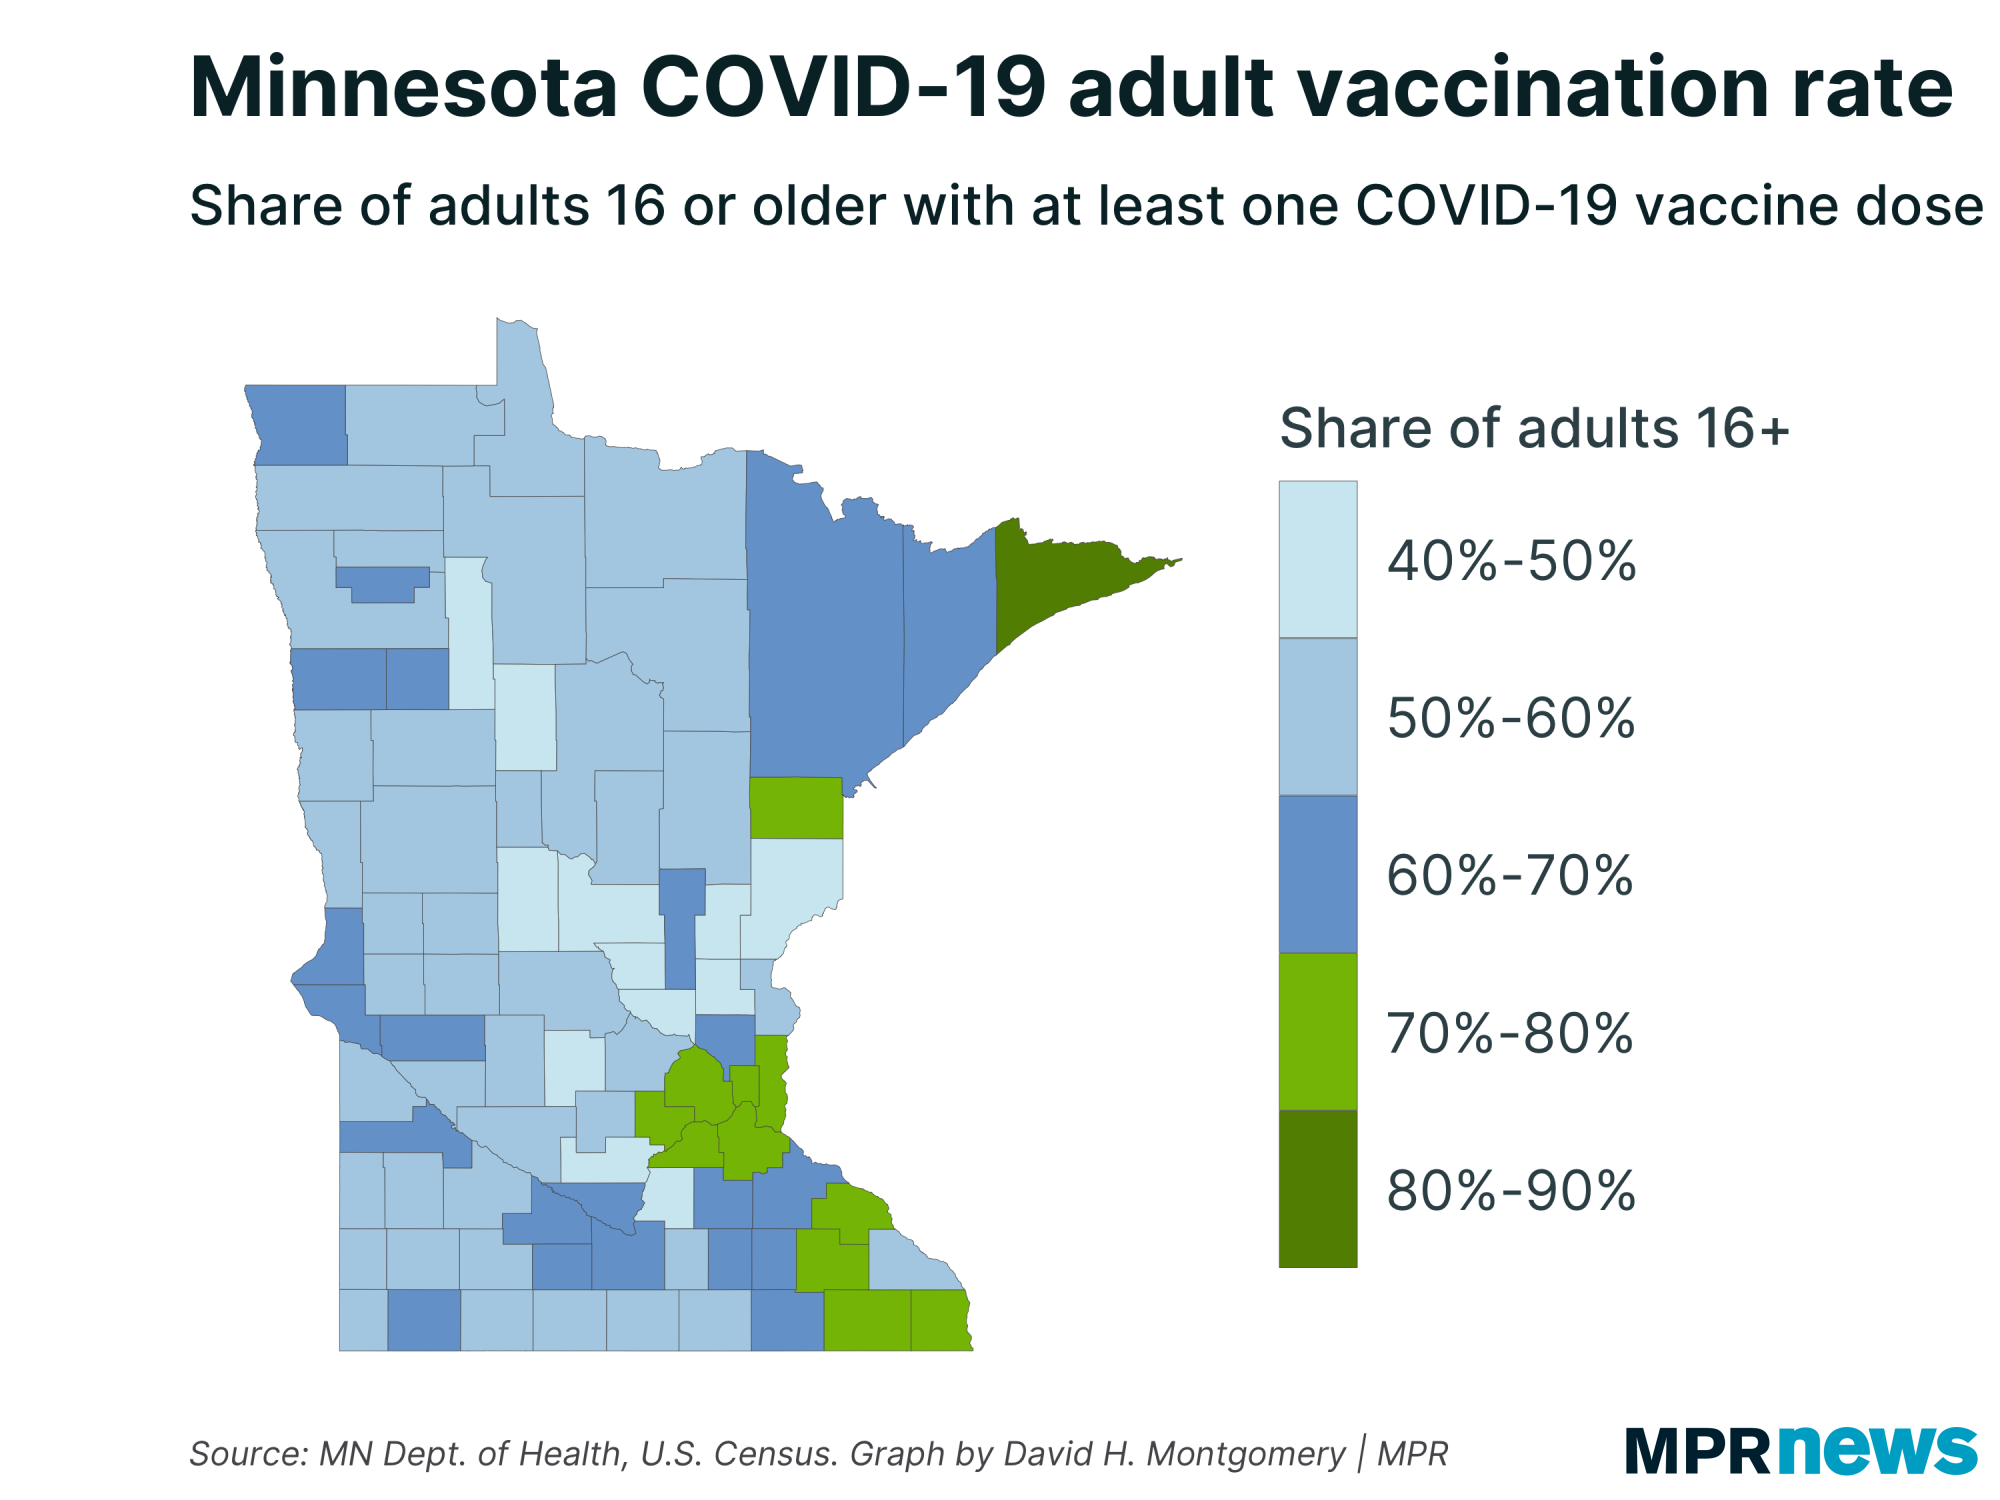
Most of the state didn't change much, but there were two noticeable impacts. One was a drop in the vaccination rate in Olmsted County and a rise in its neighbors. This bumped Olmsted below 80 percent of adults vaccinated, and bumped Wabasha and Fillmore counties over 70 percent. That means there are now 12 counties with more than 70 percent of adults vaccinated: six in the Twin Cities metro, four around Rochester, and two in northeastern Minnesota. |
| |
|
|
The other noticeable change was what I noted above: a large group of people who had been classified as living in Hennepin or Ramsey counties were reclassified into one of the surrounding suburbs. The Hennepin/Ramsey vaccination rate dipped a little, and the suburban rate went up.
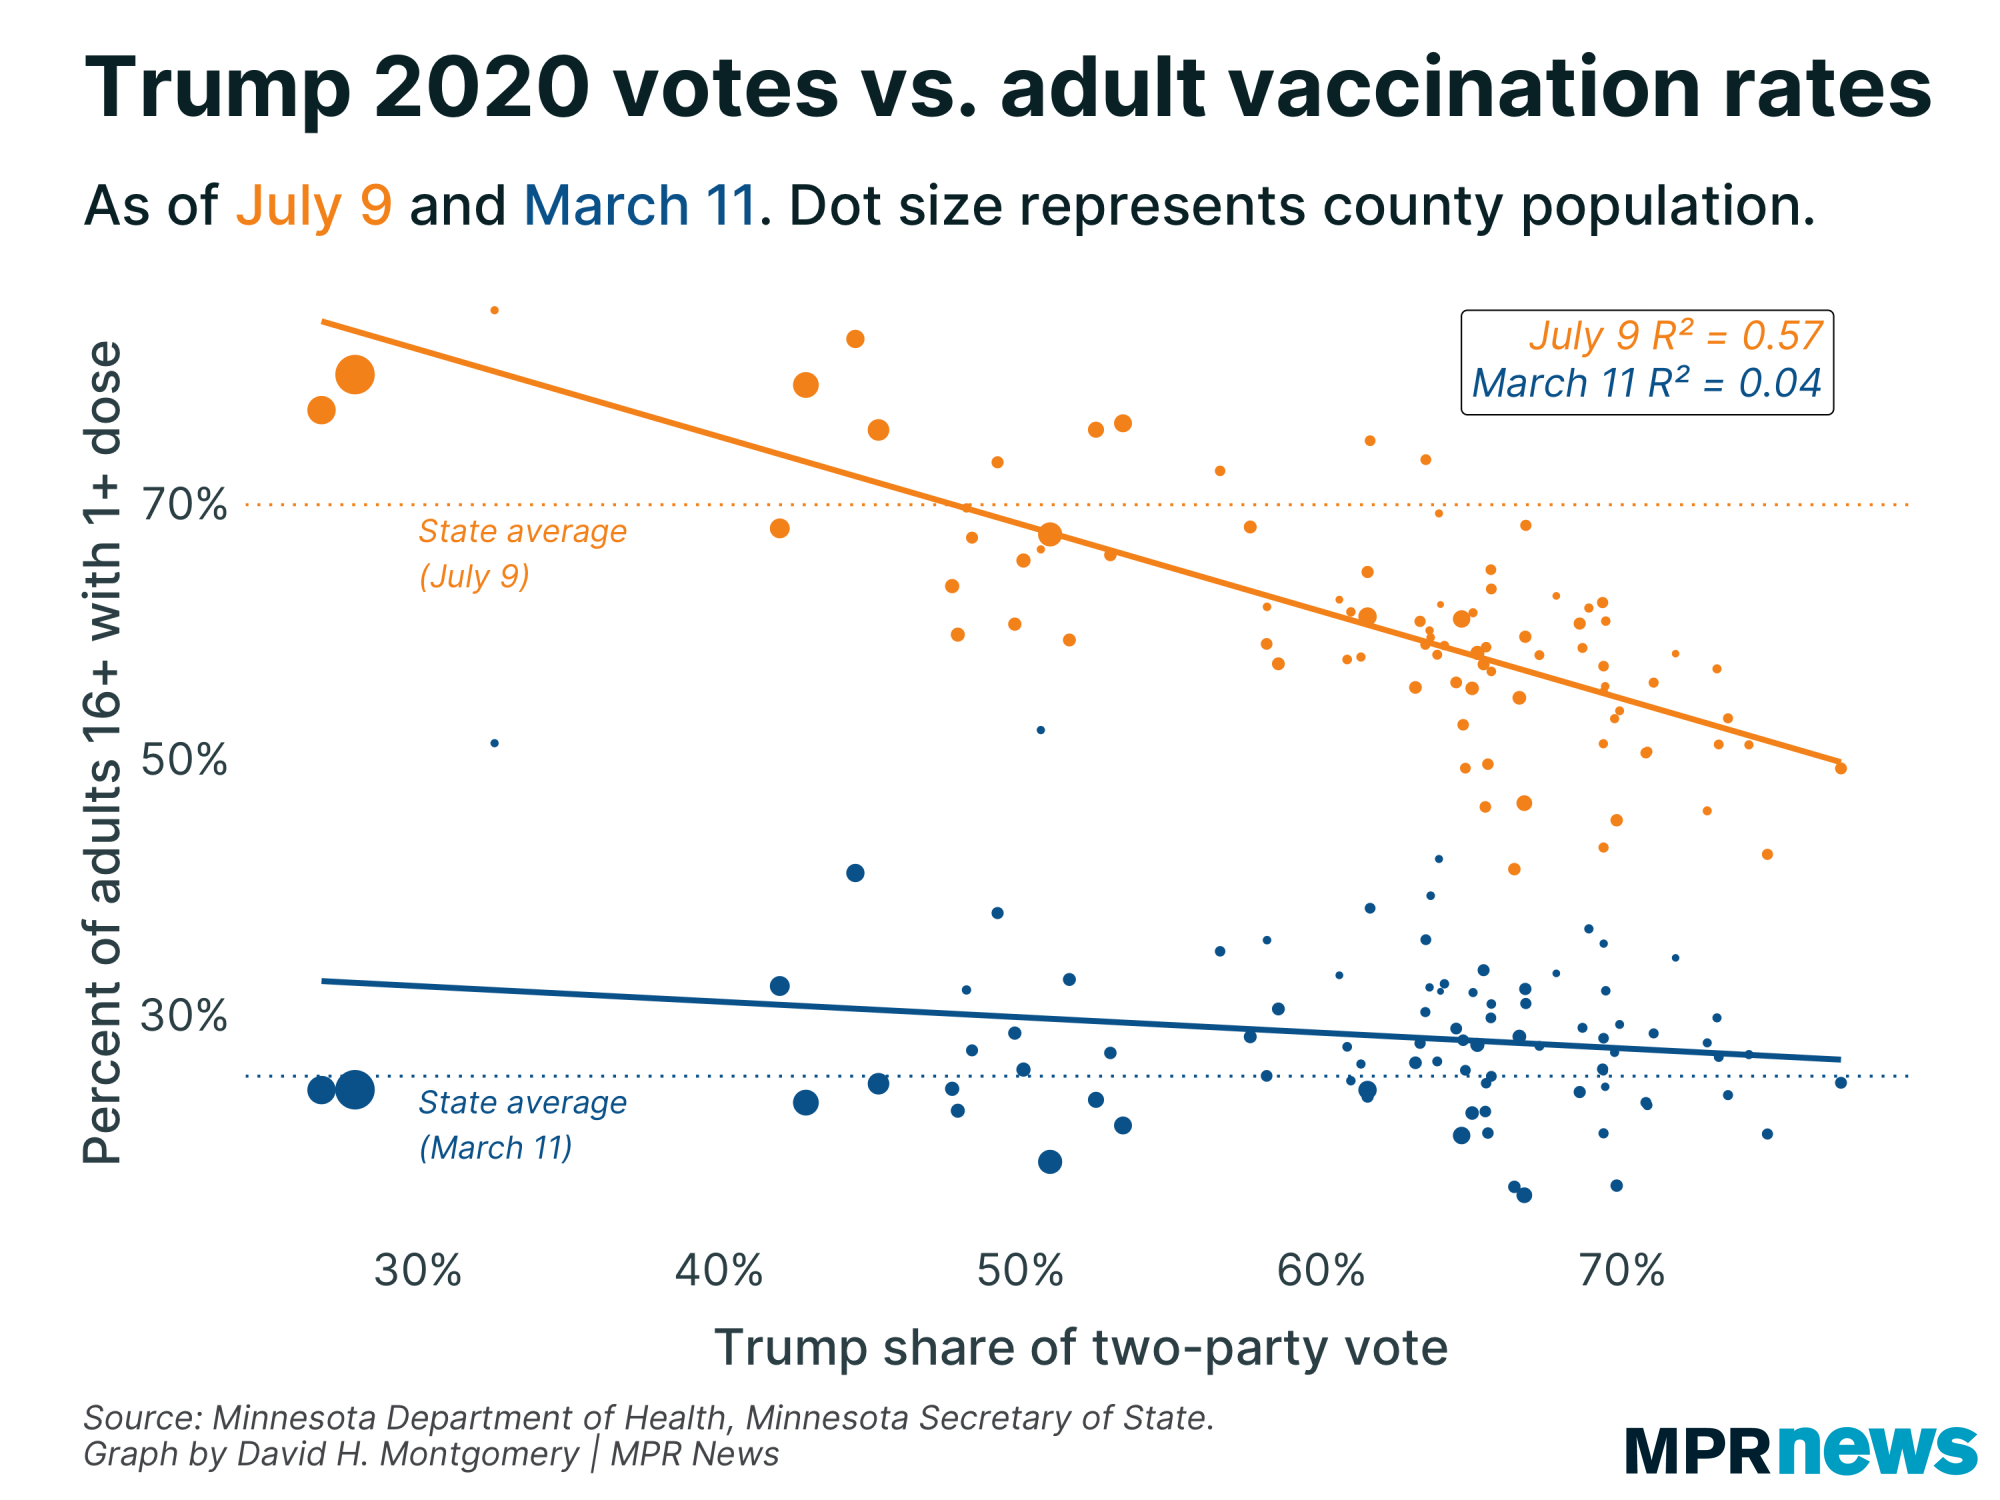
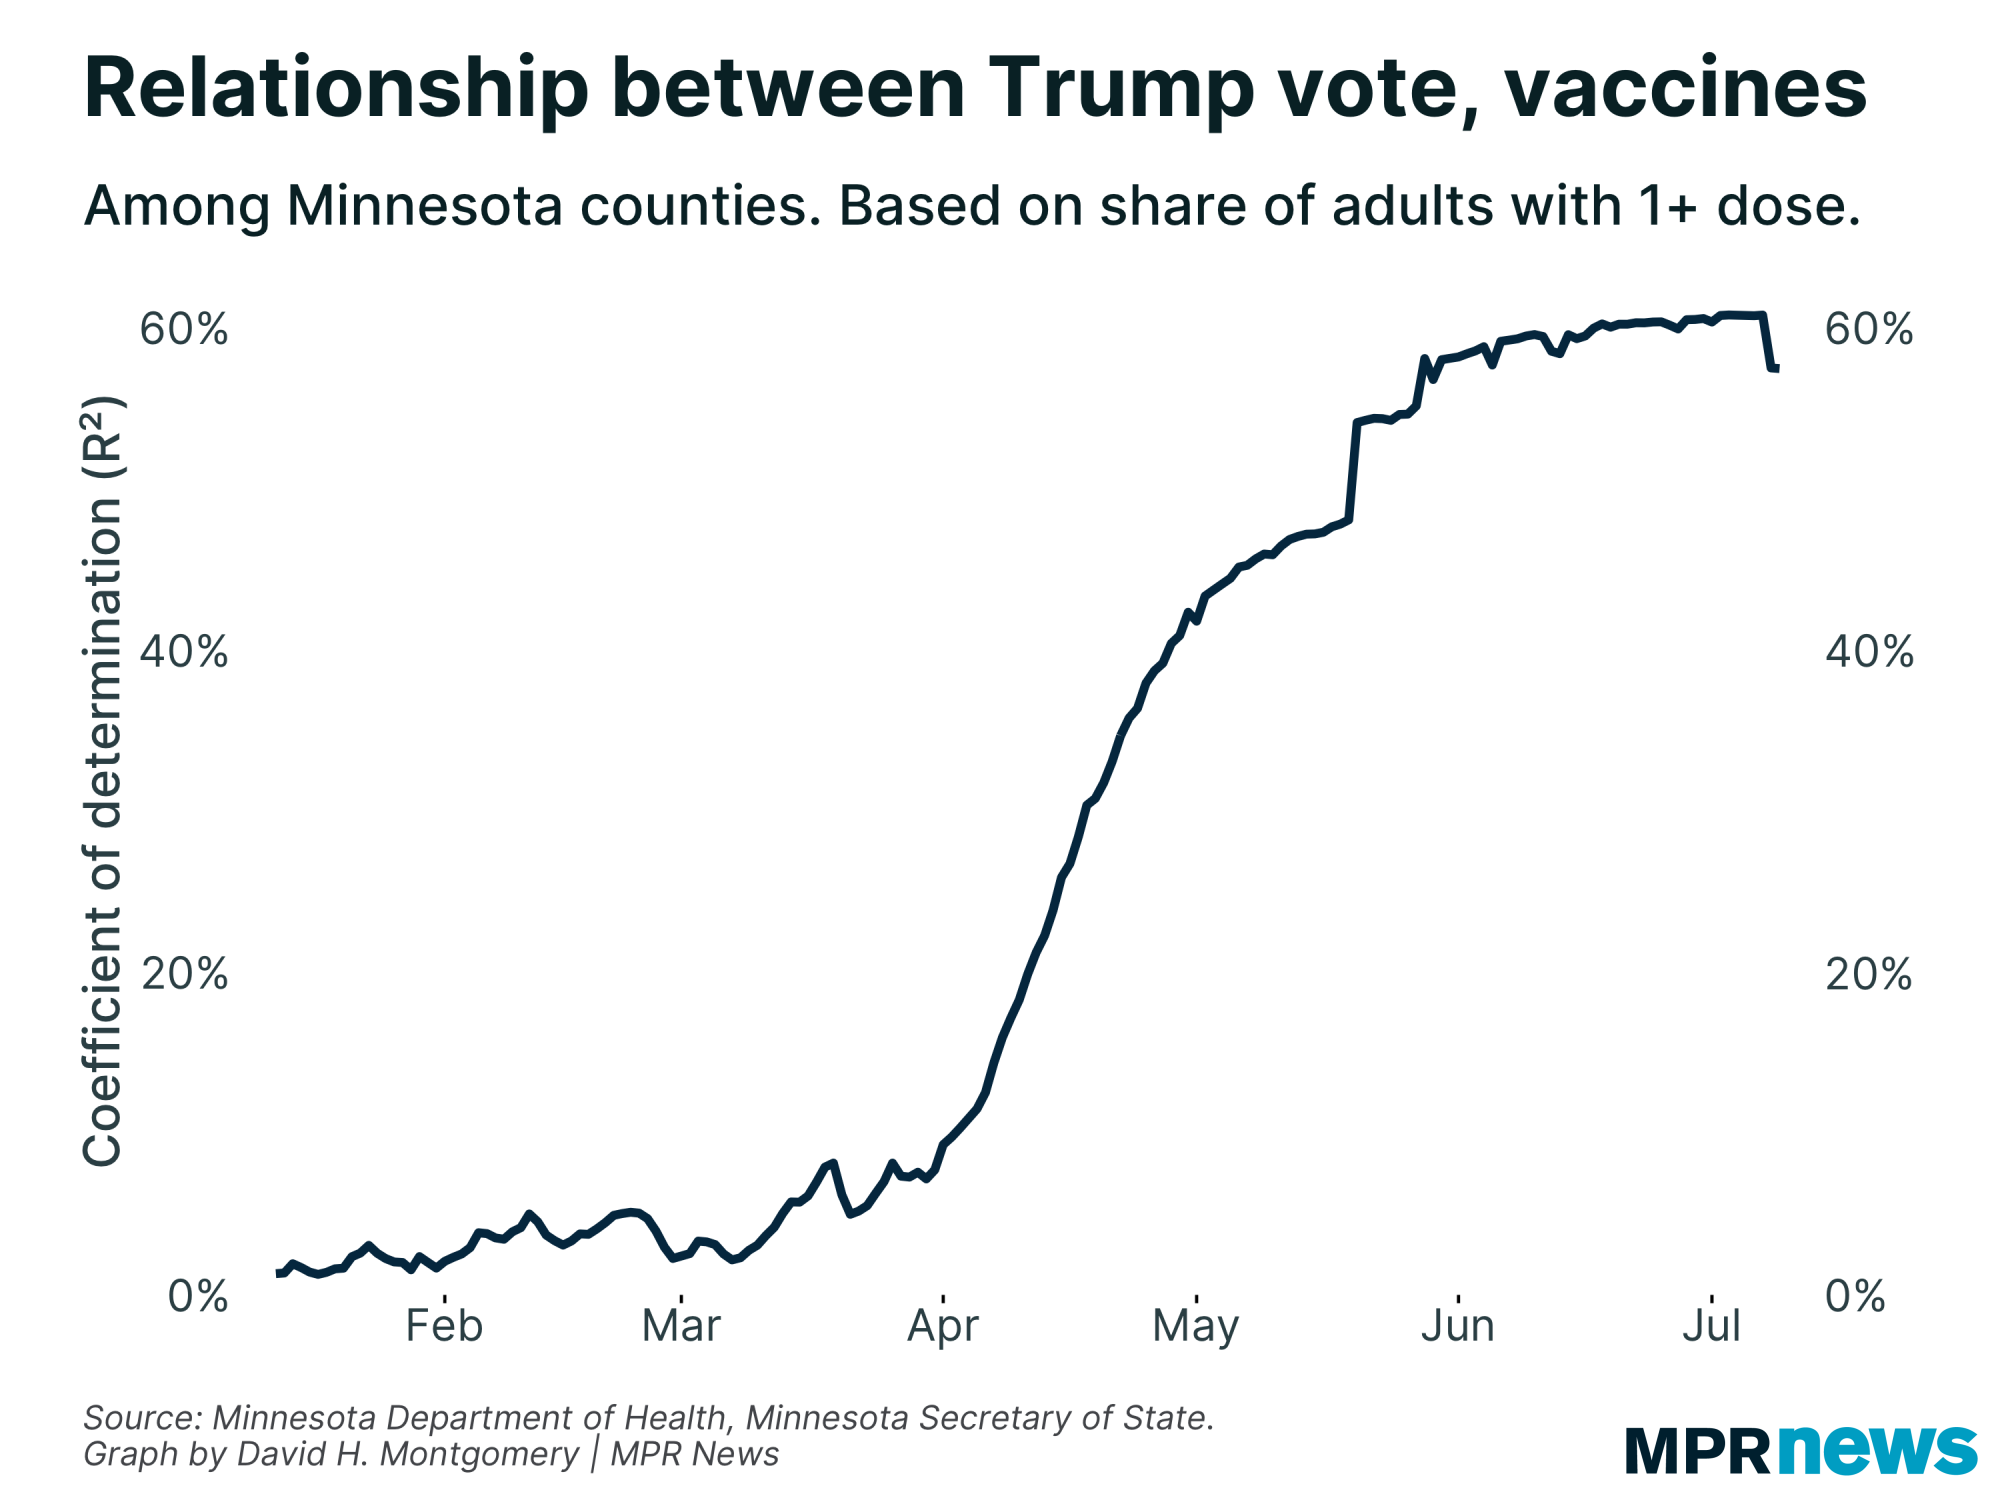
This had one interesting side effect: it weakened the strong correlation between politics and vaccination rates.
As I've covered before, you can explain more than half of the variation in Minnesota's county vaccination rates just by looking at Donald Trump's share of the 2020 vote. This relationship used to be very weak in Minnesota, as vaccine supply went primarily to rural areas where many elderly people live in the early days of the vaccination campaign. But starting in early April, the Twin Cities metro got a flood of new vaccines, eligibility expanded to all adults, and vaccination rates began to diverge along political lines. |
| |
|
|
| But move a bunch of vaccinated people from Hennepin/Ramsey, where Joe Biden did really well, to the outer suburbs, where he only did pretty well, and you weaken that relationship. Not by a ton, but I'm a nerd and I thought it was interesting and it's my newsletter, so there. | |
|
|
|
What's happening next?
|
Starting this weekend, the health department won't be doing data updates on Saturdays or Sundays any more. This is good, because it means for the first time in over a year, I won't have to crunch COVID data at 11 a.m. on weekends any more. But it will add complications, since we'll now get big multi-day dumps of data every Tuesday that could throw off rolling averages. I may end up shifting more to charts of weekly data as a result.
Thanks for subscribing to this newsletter and for all of you who've sent me your feedback. As always, if you like this newsletter, please share it and the sign-up link with others who you think might enjoy it.
— David |
| |
|
|
Preference Center ❘ Unsubscribe You received this email because you subscribed or it was sent to you by a friend. This email was sent by: %%Member_Busname%%
%%Member_Addr%% %%Member_City%%, %%Member_State%%, %%Member_PostalCode%%
  |
|
|
| | |