| Welcome back to COVID in Minnesota TODAY, an email newsletter from MPR News about understanding the latest developments in Minnesota's COVID-19 outbreak. | | |
|
|
On Tuesday, Minnesota's outbreak "peaked" — by which I mean our average positivity rate was lower than 14 days prior for the first time in months.
But you've always got to be careful about overreacting to one day's change in the data — especially right now, when we're seeing distortions from holidays and a dump of backlogged cases. Sure enough, the next day saw the data bounce back up. So even though we have technically hit the statistical threshold I defined as marking a "peak," it seems clearly a blip.
If a peak isn't happening yet, then what is? That's harder to tell. We're in a period where our indicators aren't all moving in the same direction.
So while I don't have a clear answer for you about what's happening, I'll lay out what we do know below. |
| |
|
|
Three things to know
| - Growth rate in most COVID-19 metrics remains slow, but hasn't reversed yet
- Cases are rising, but a lot of this is driven by expanded testing, while positivity rate is so far flat
- Infections are rising in children after the return to school — as expected — but we don't yet know how significant this will be
|
| |
|
|
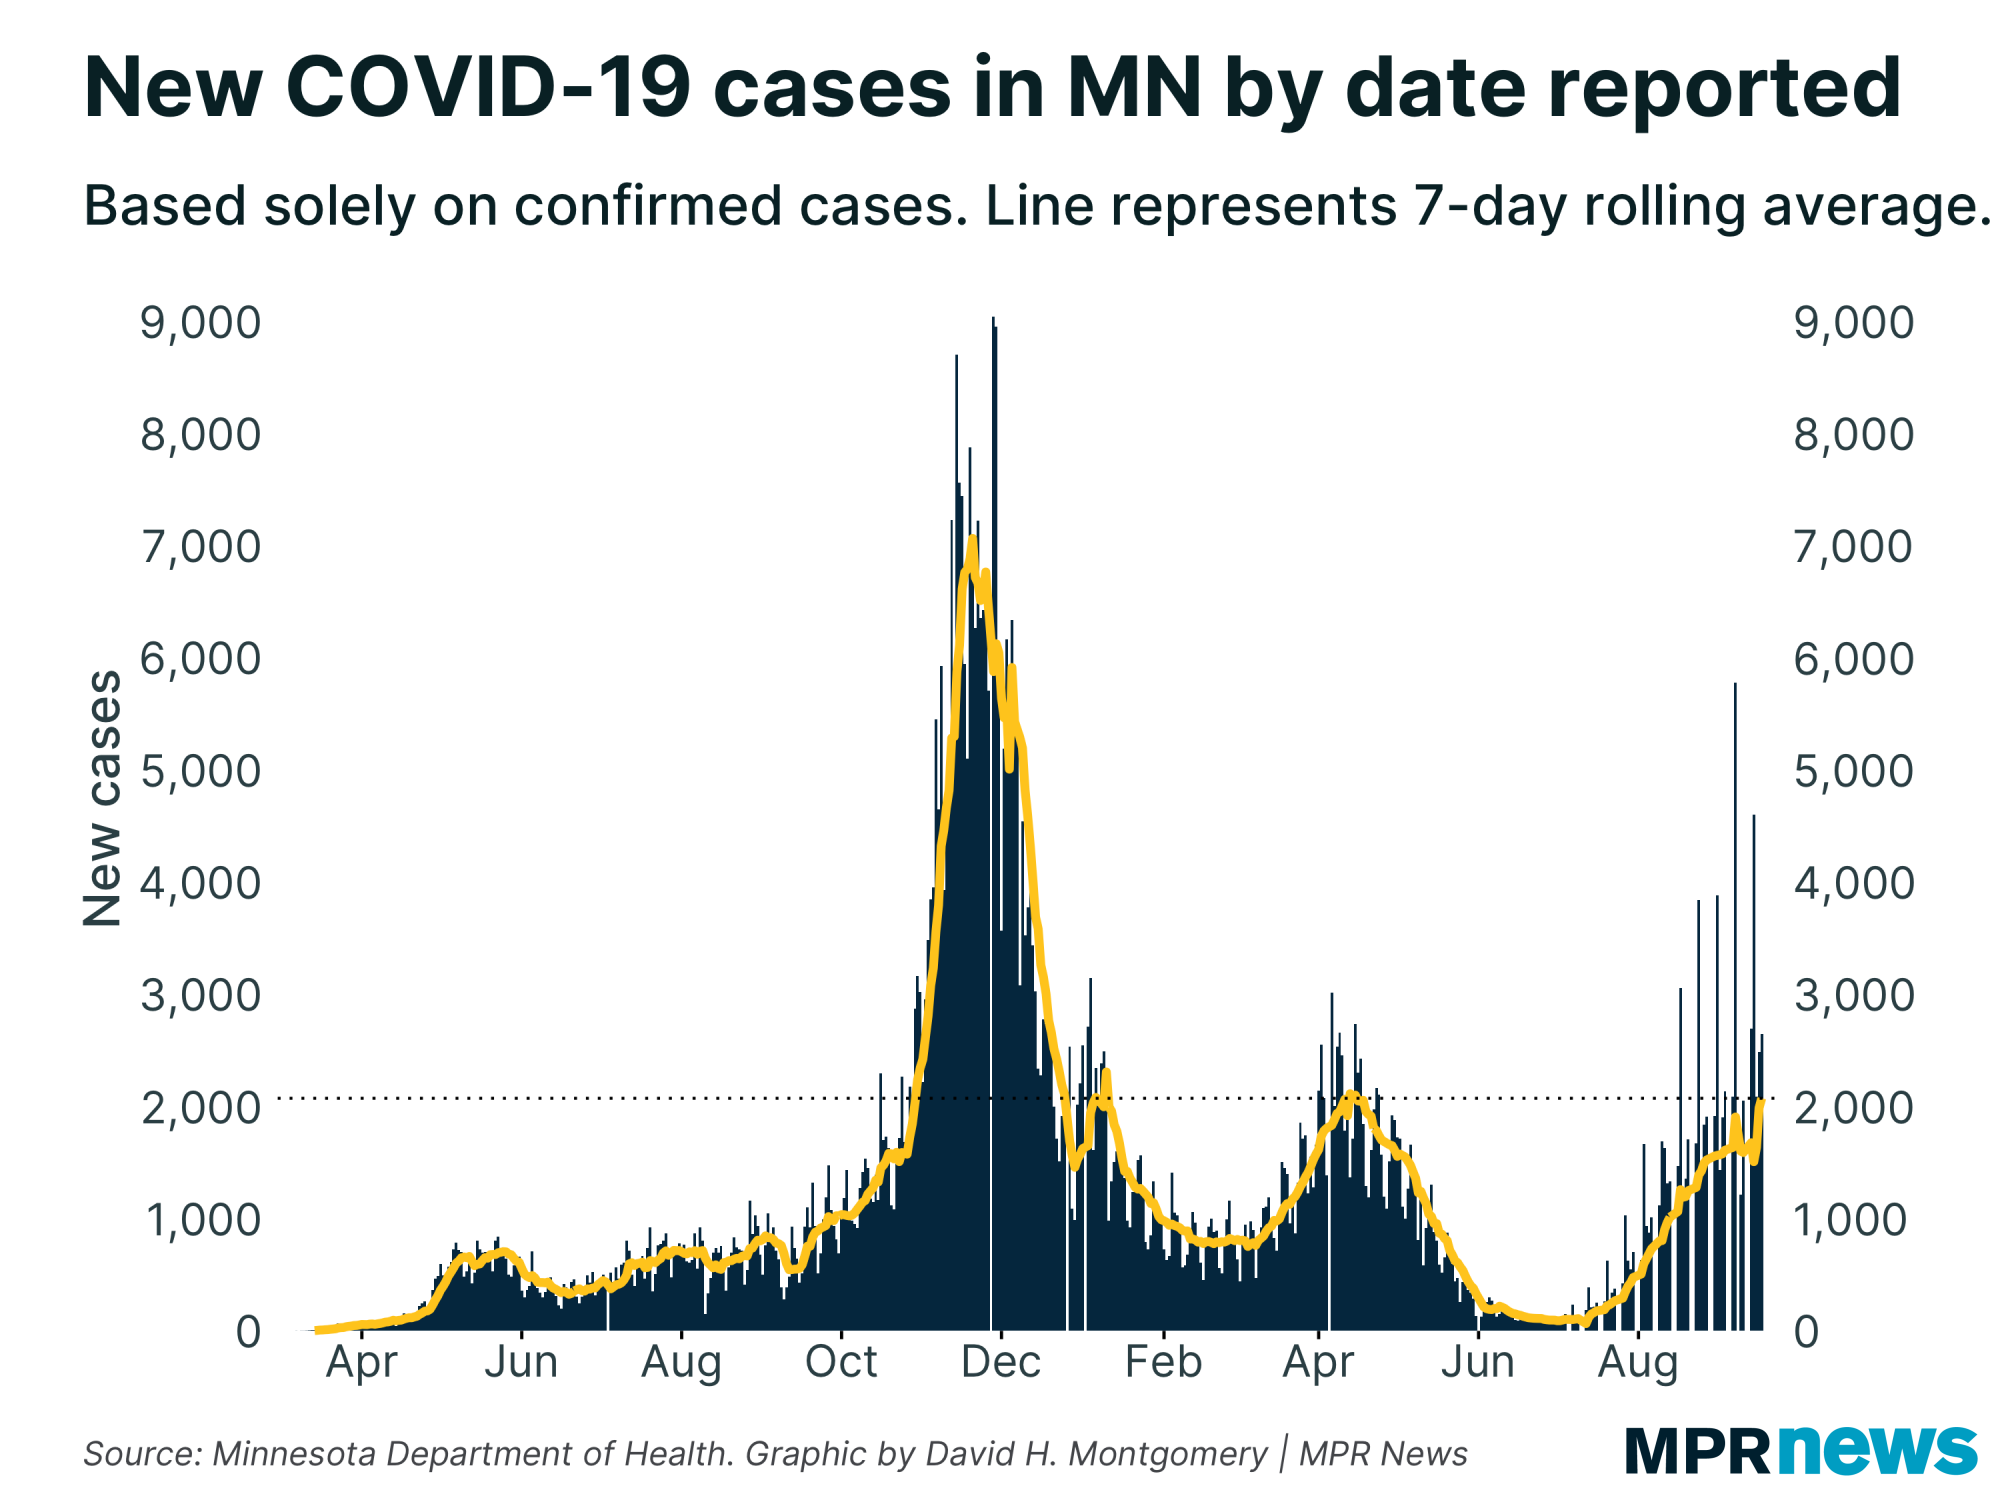
| The trendline of new cases can look a little alarming right now. They're up 30 percent week-over-week, a big increase following what had looked like a plateau. | | |
|
|
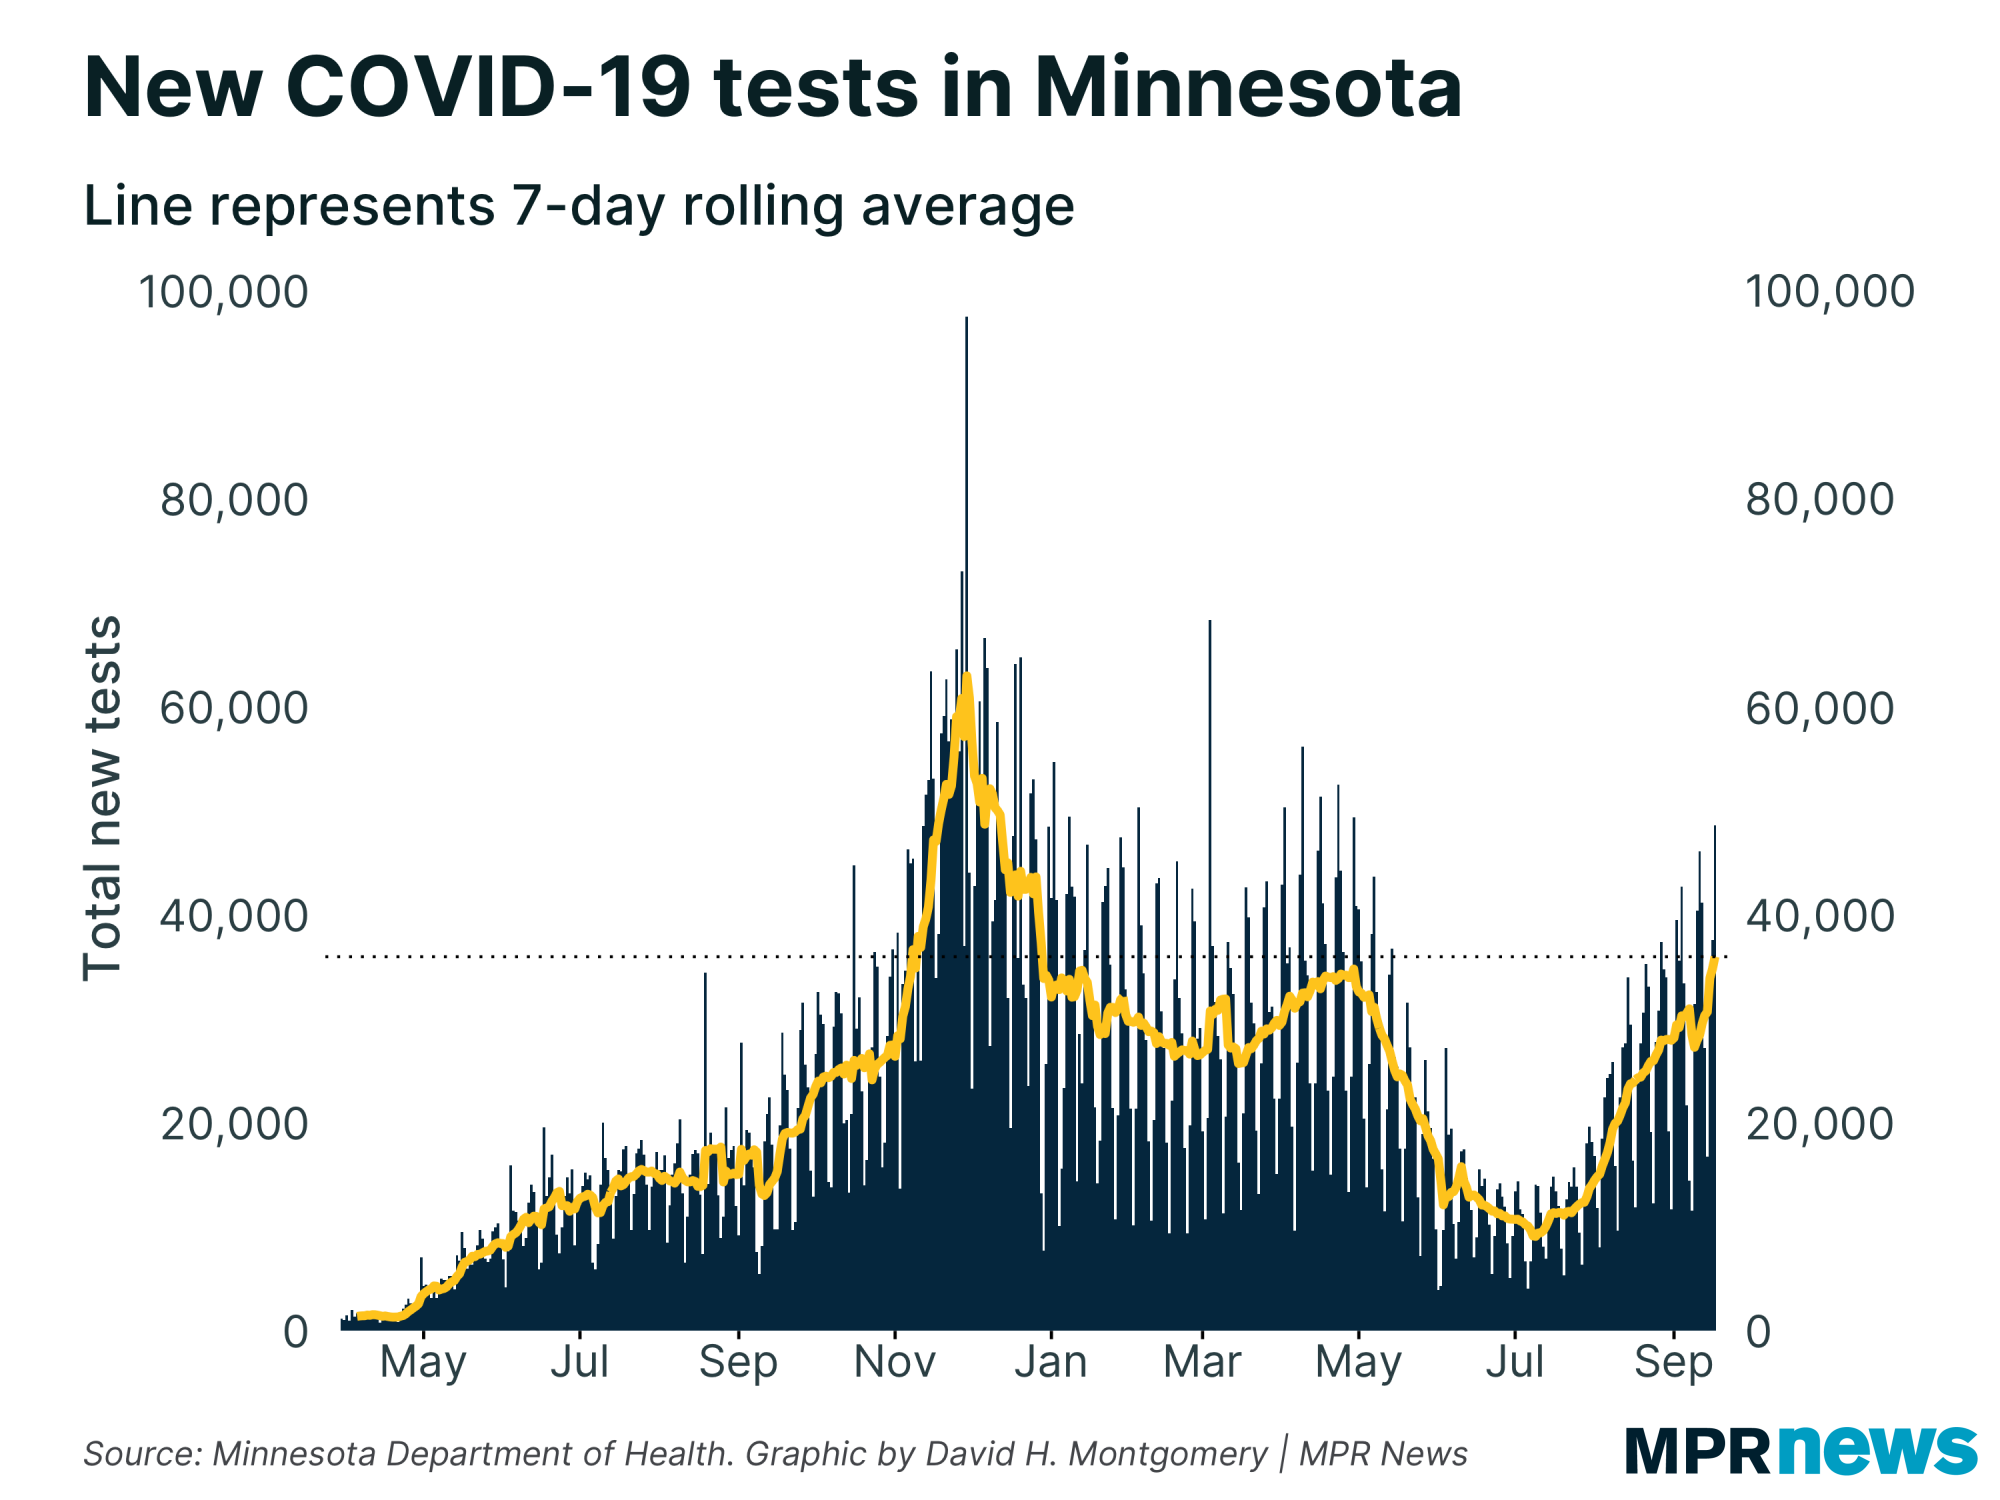
| But this big increase in cases in coming alongside a big increase in testing, which is now at levels we haven't seen since January. That also means we've seen testing rise above the Spring 2021 peak for the first time. | | |
|
|
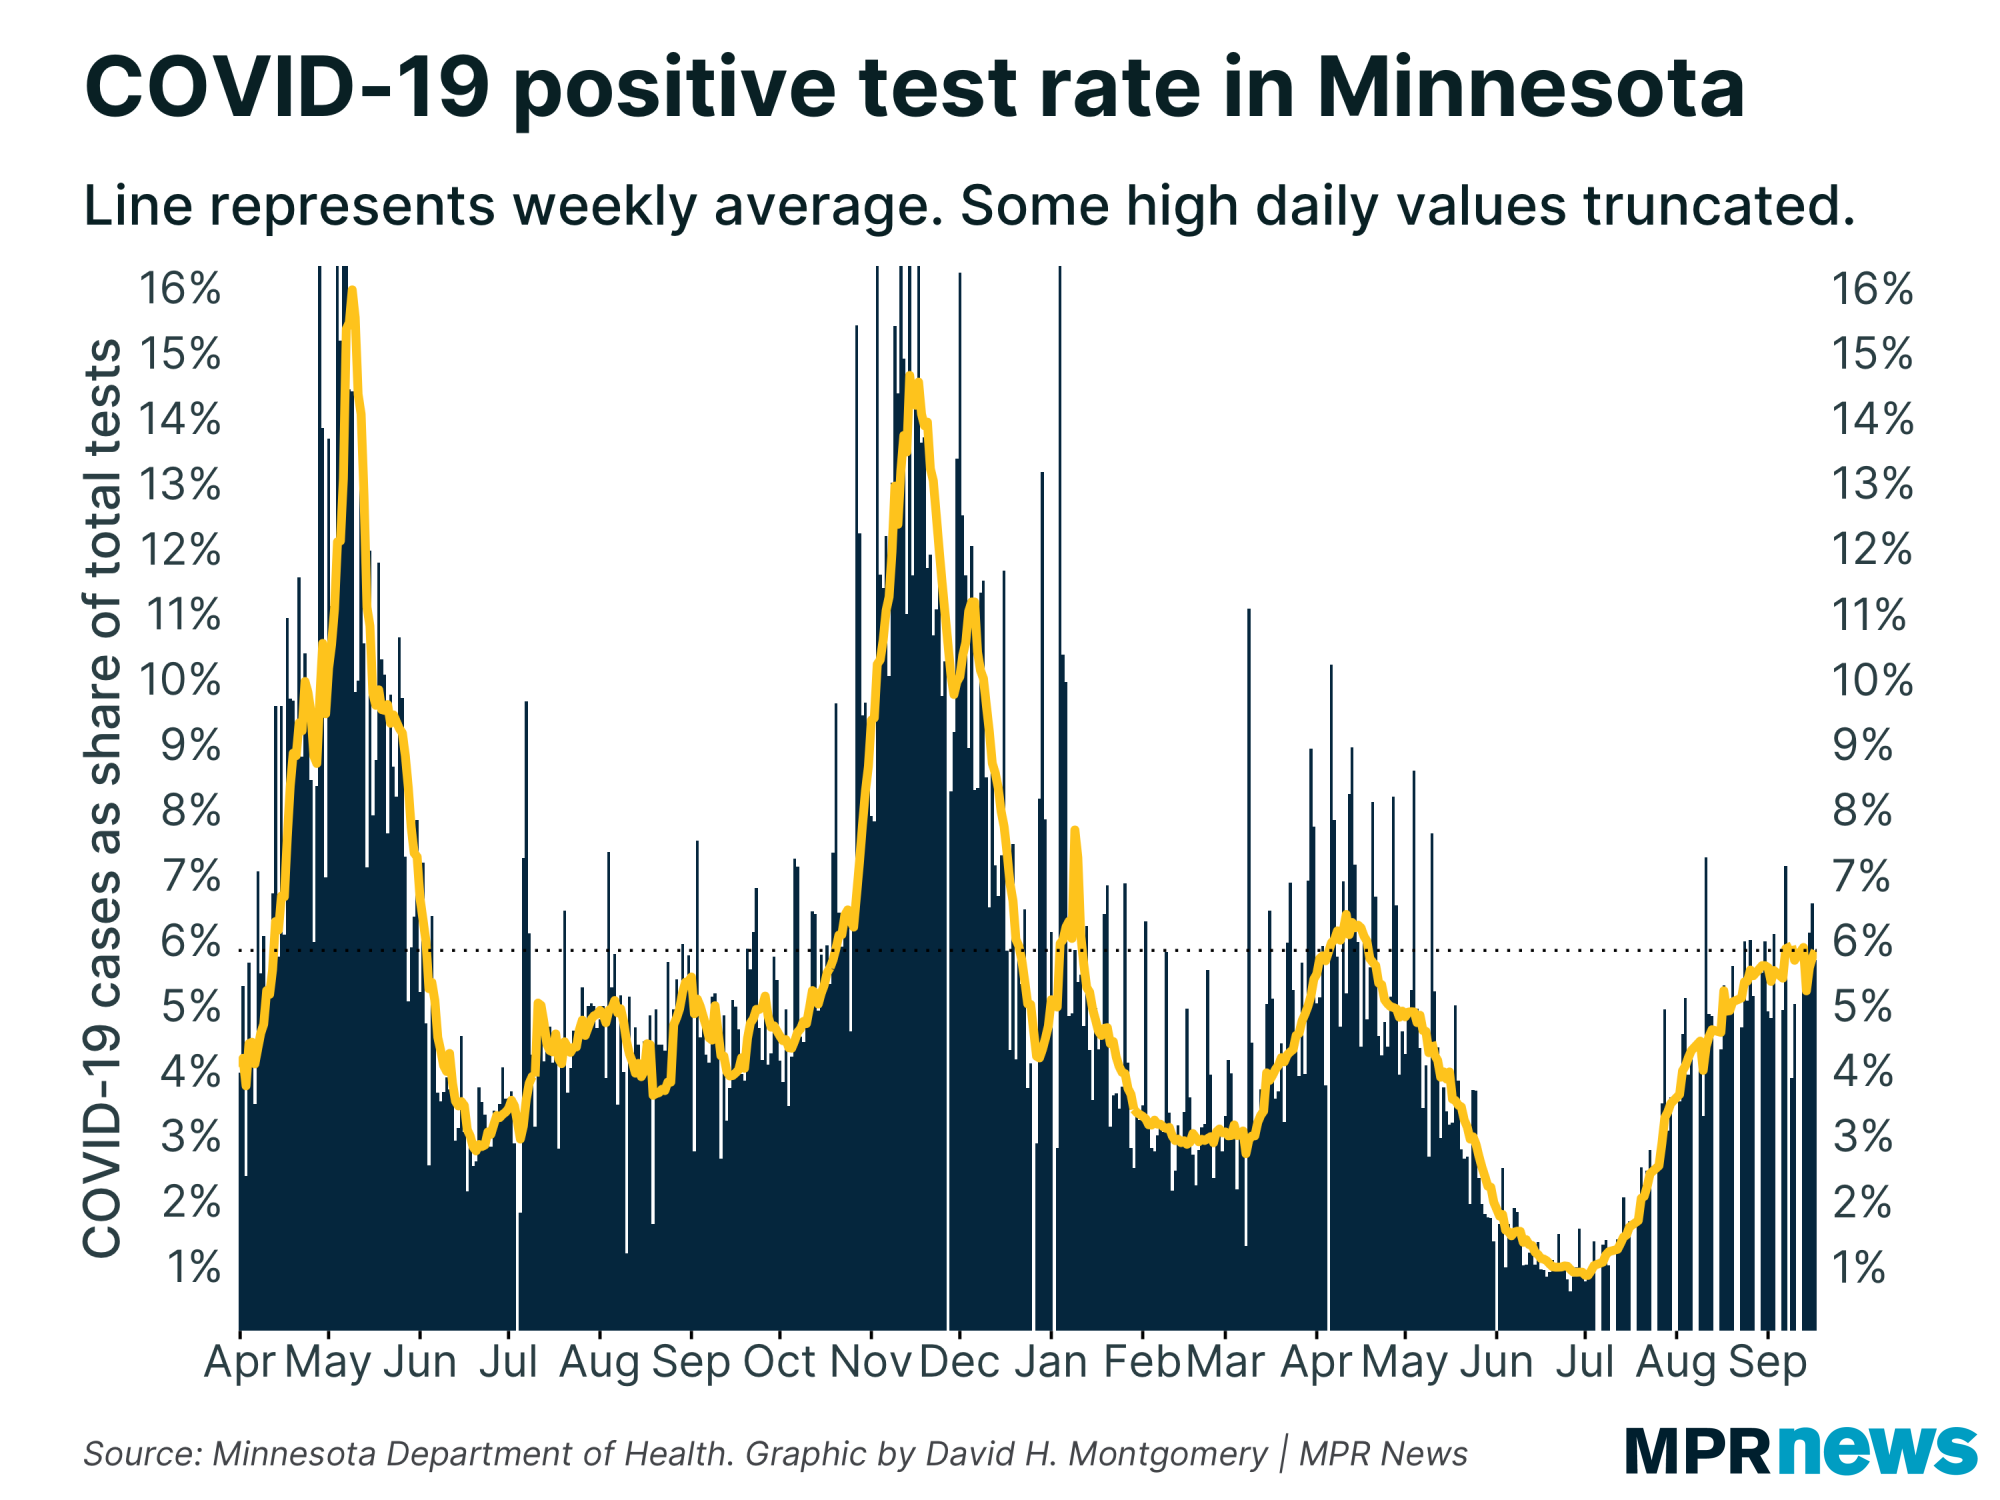
| As a result, while cases are up, positivity rate remains pretty flat: | | |
|
|
This suggests that the increase in cases we're seeing is primarily being driven by us finding a larger share of infections, rather than infections accelerating.
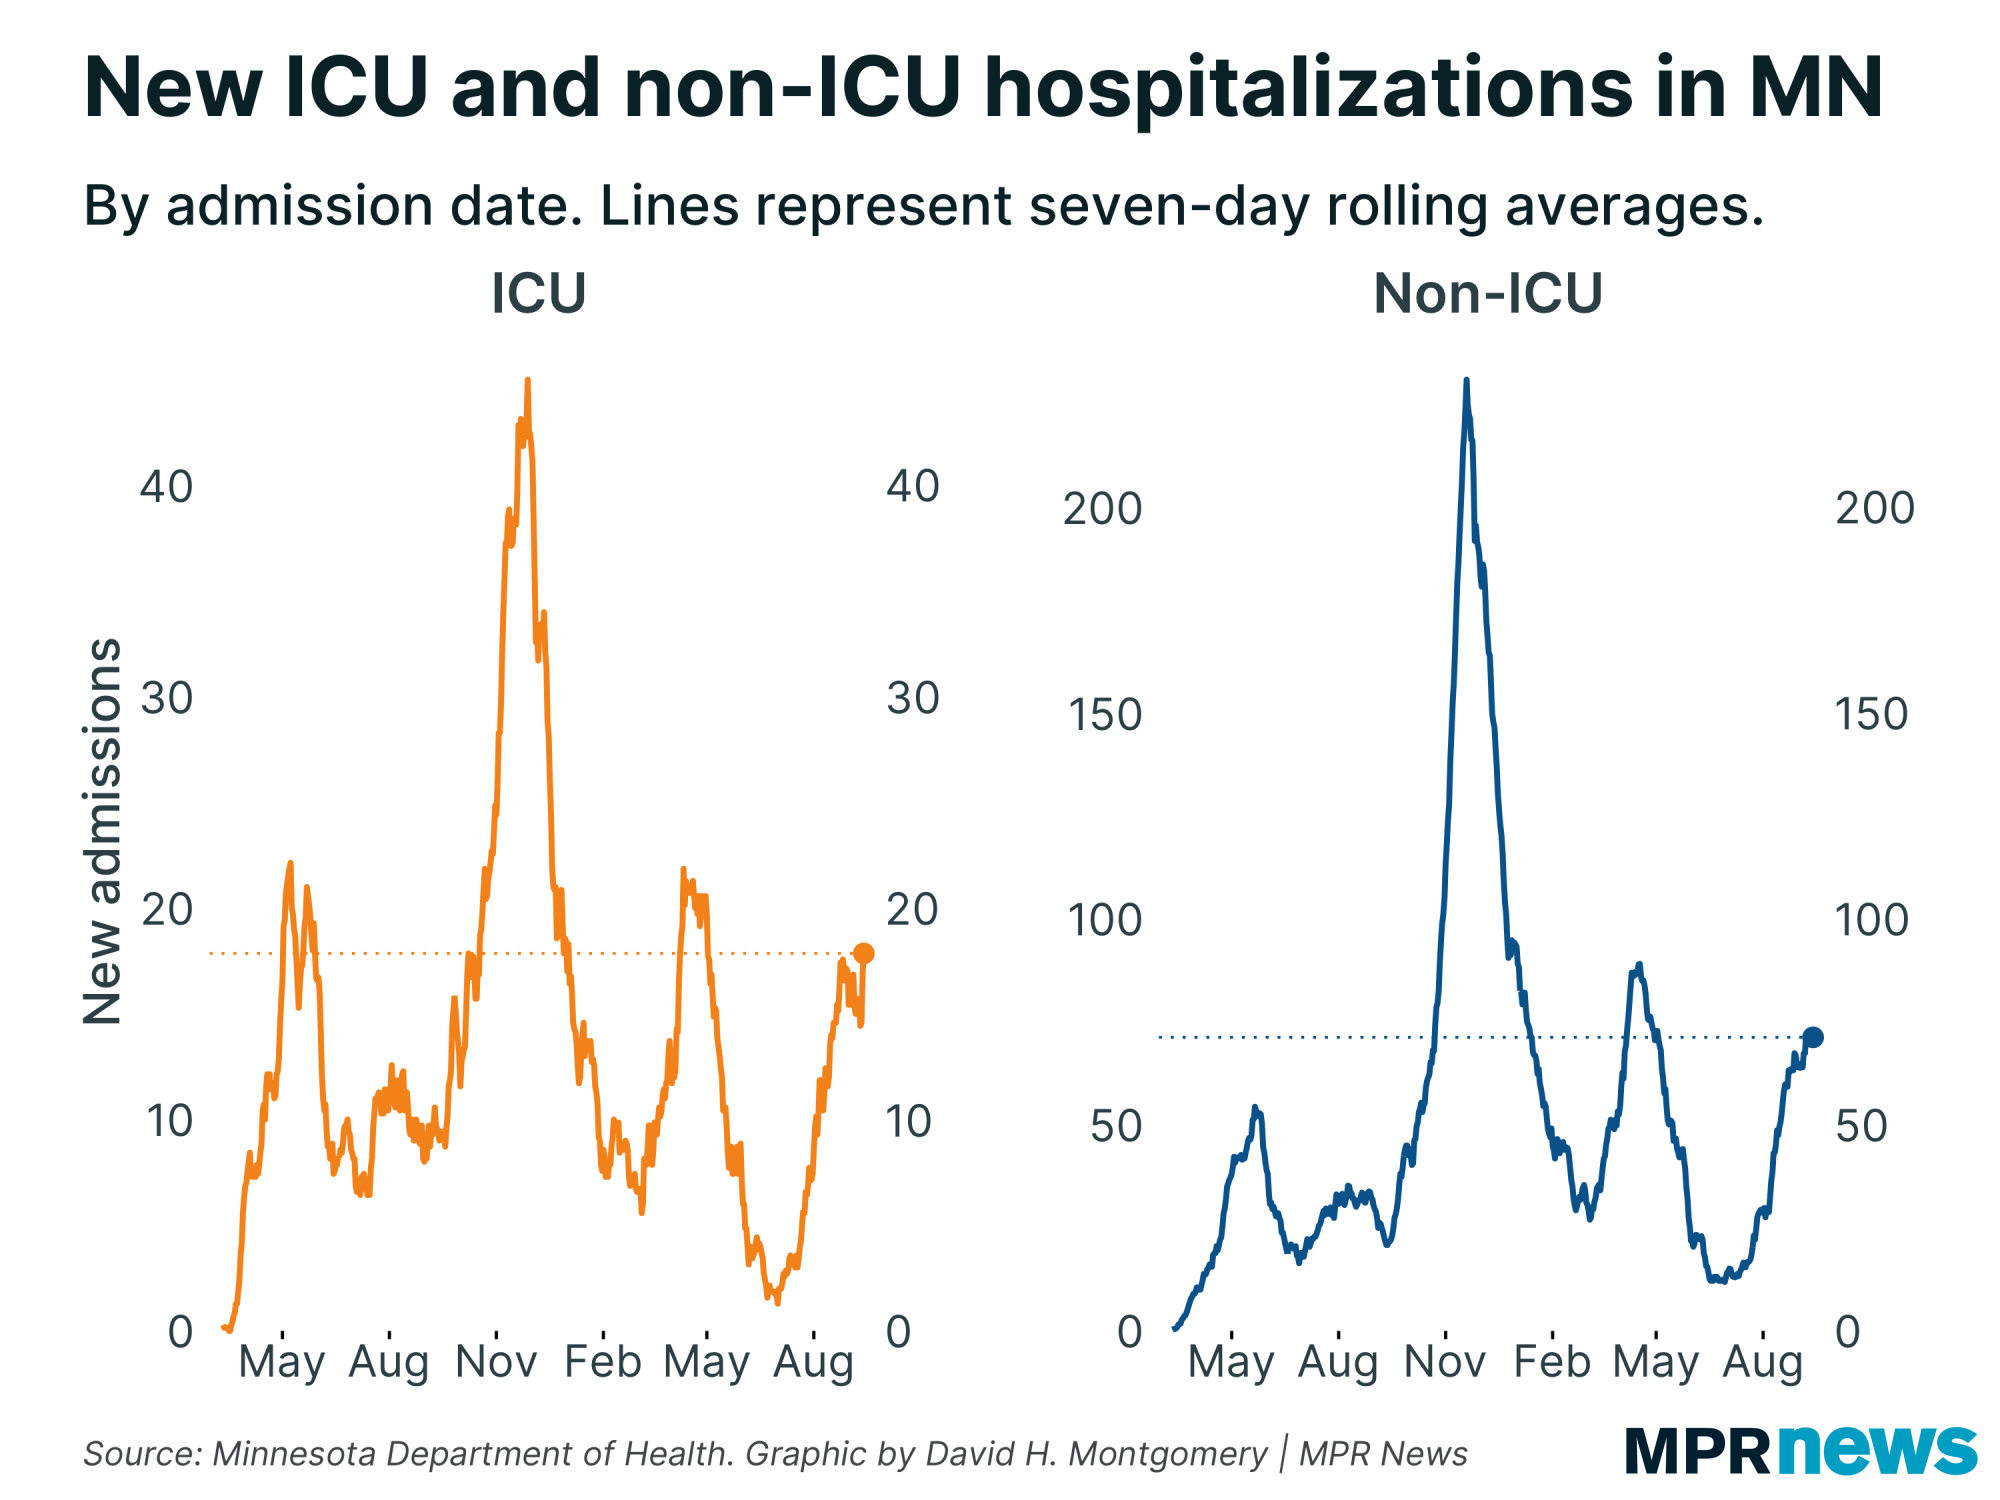
Meanwhile hospitalizations had started to drop earlier in the week, but are now rising again. I honestly don't know what's happening here, but will keep watching! | |
|
|
|
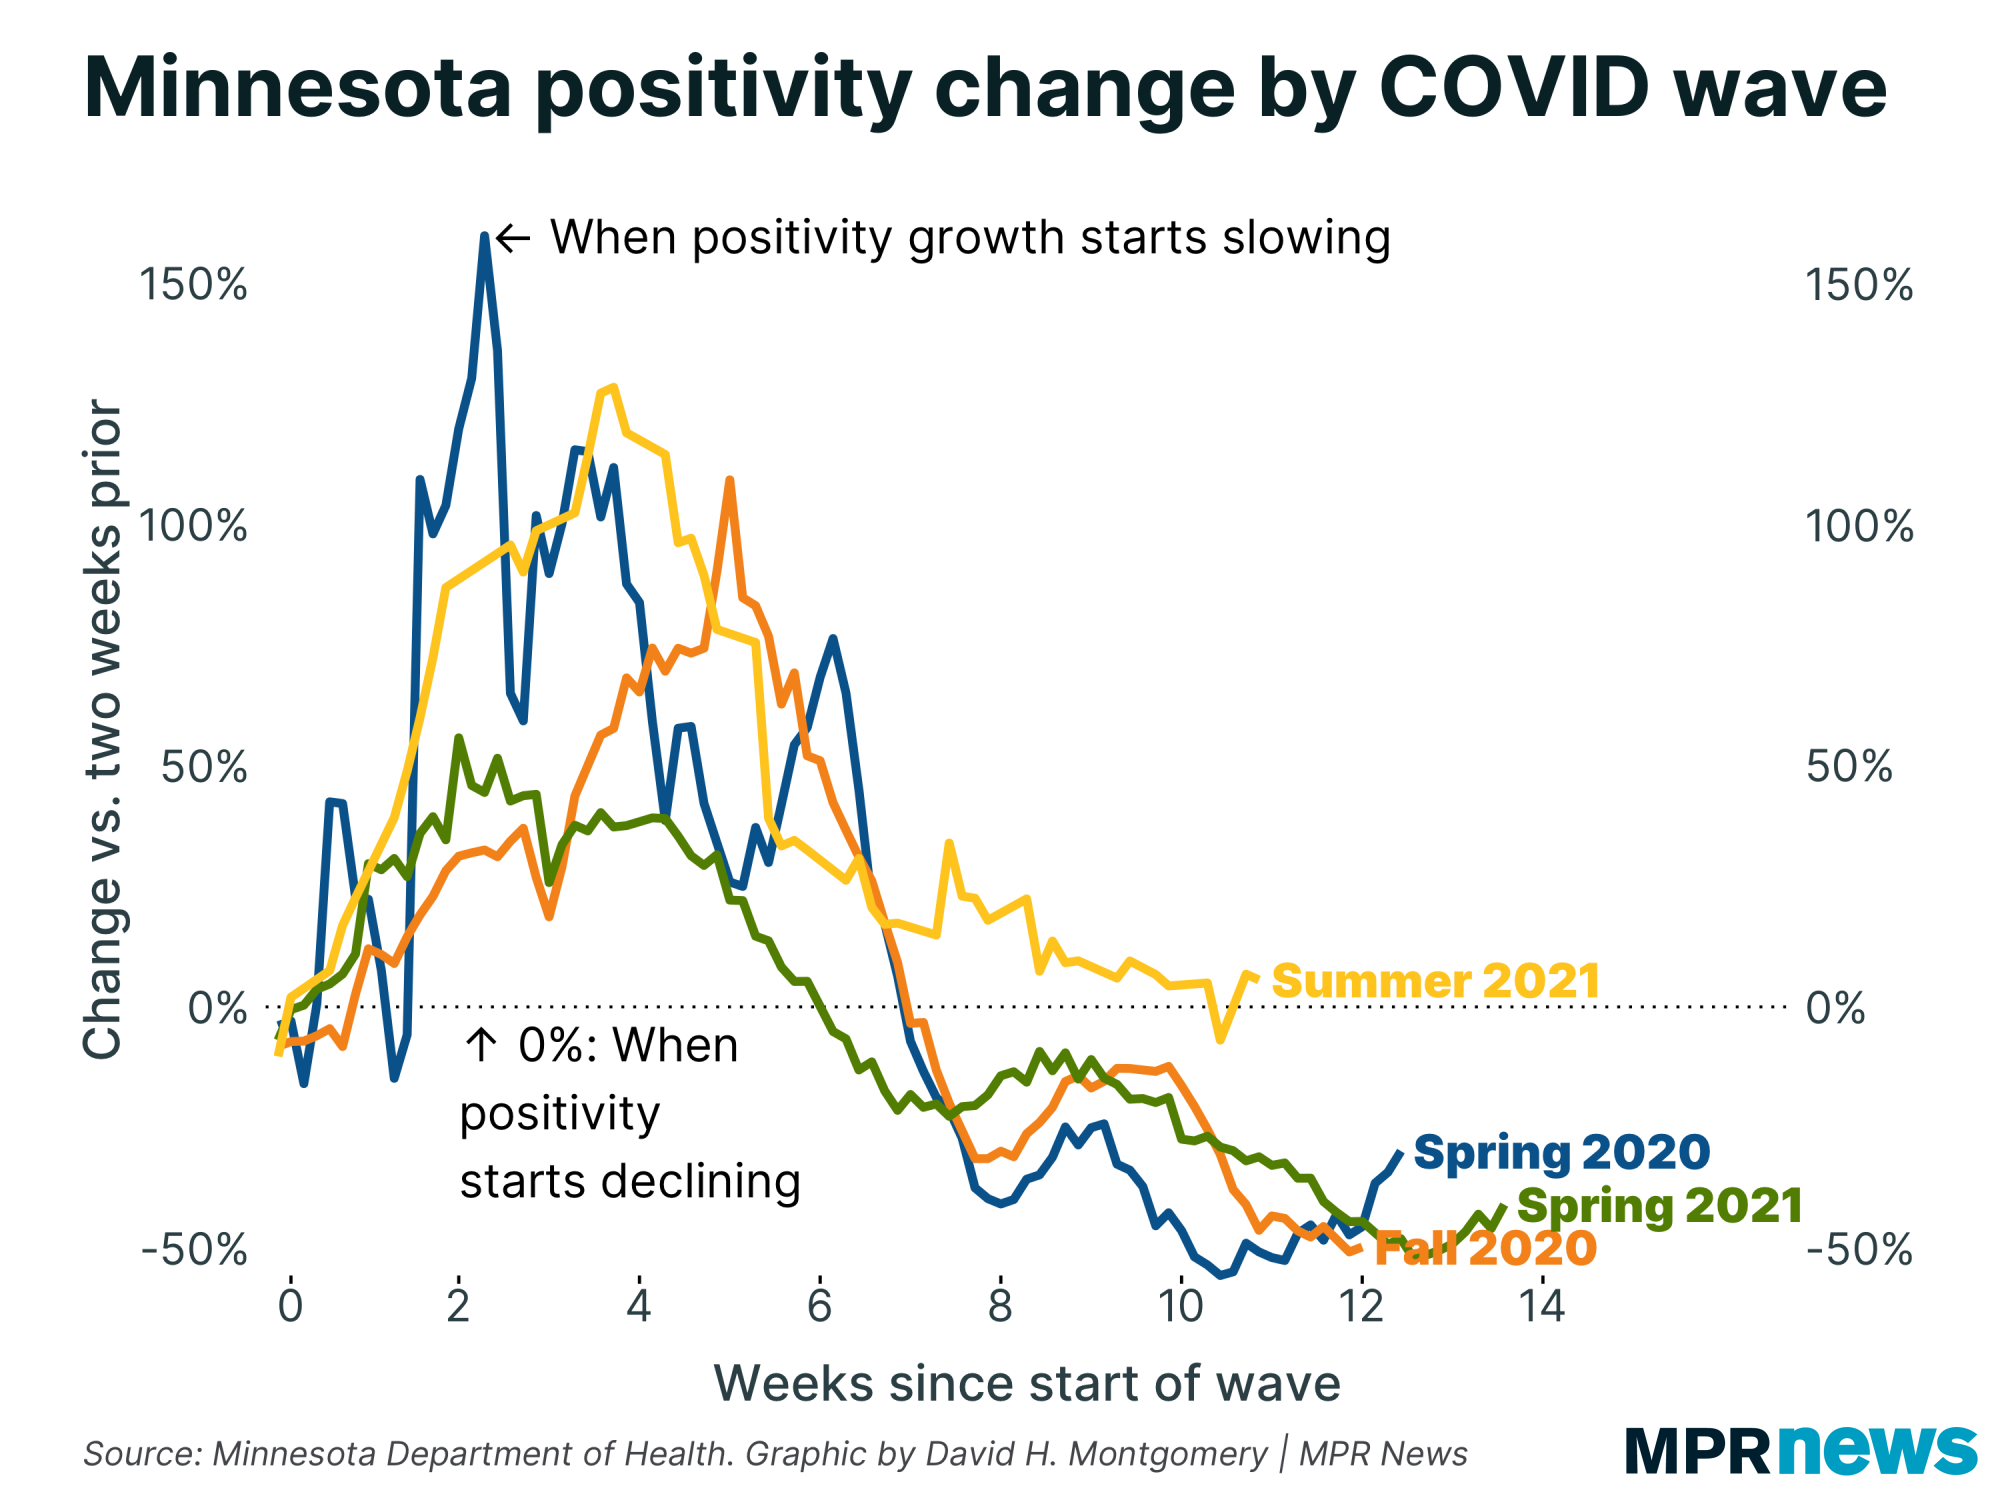
| Overall, the growth rate in all three of these metrics that we've seen has accelerated slightly the last few days, but remains much slower than it had been for most of this wave. | | |
|
|
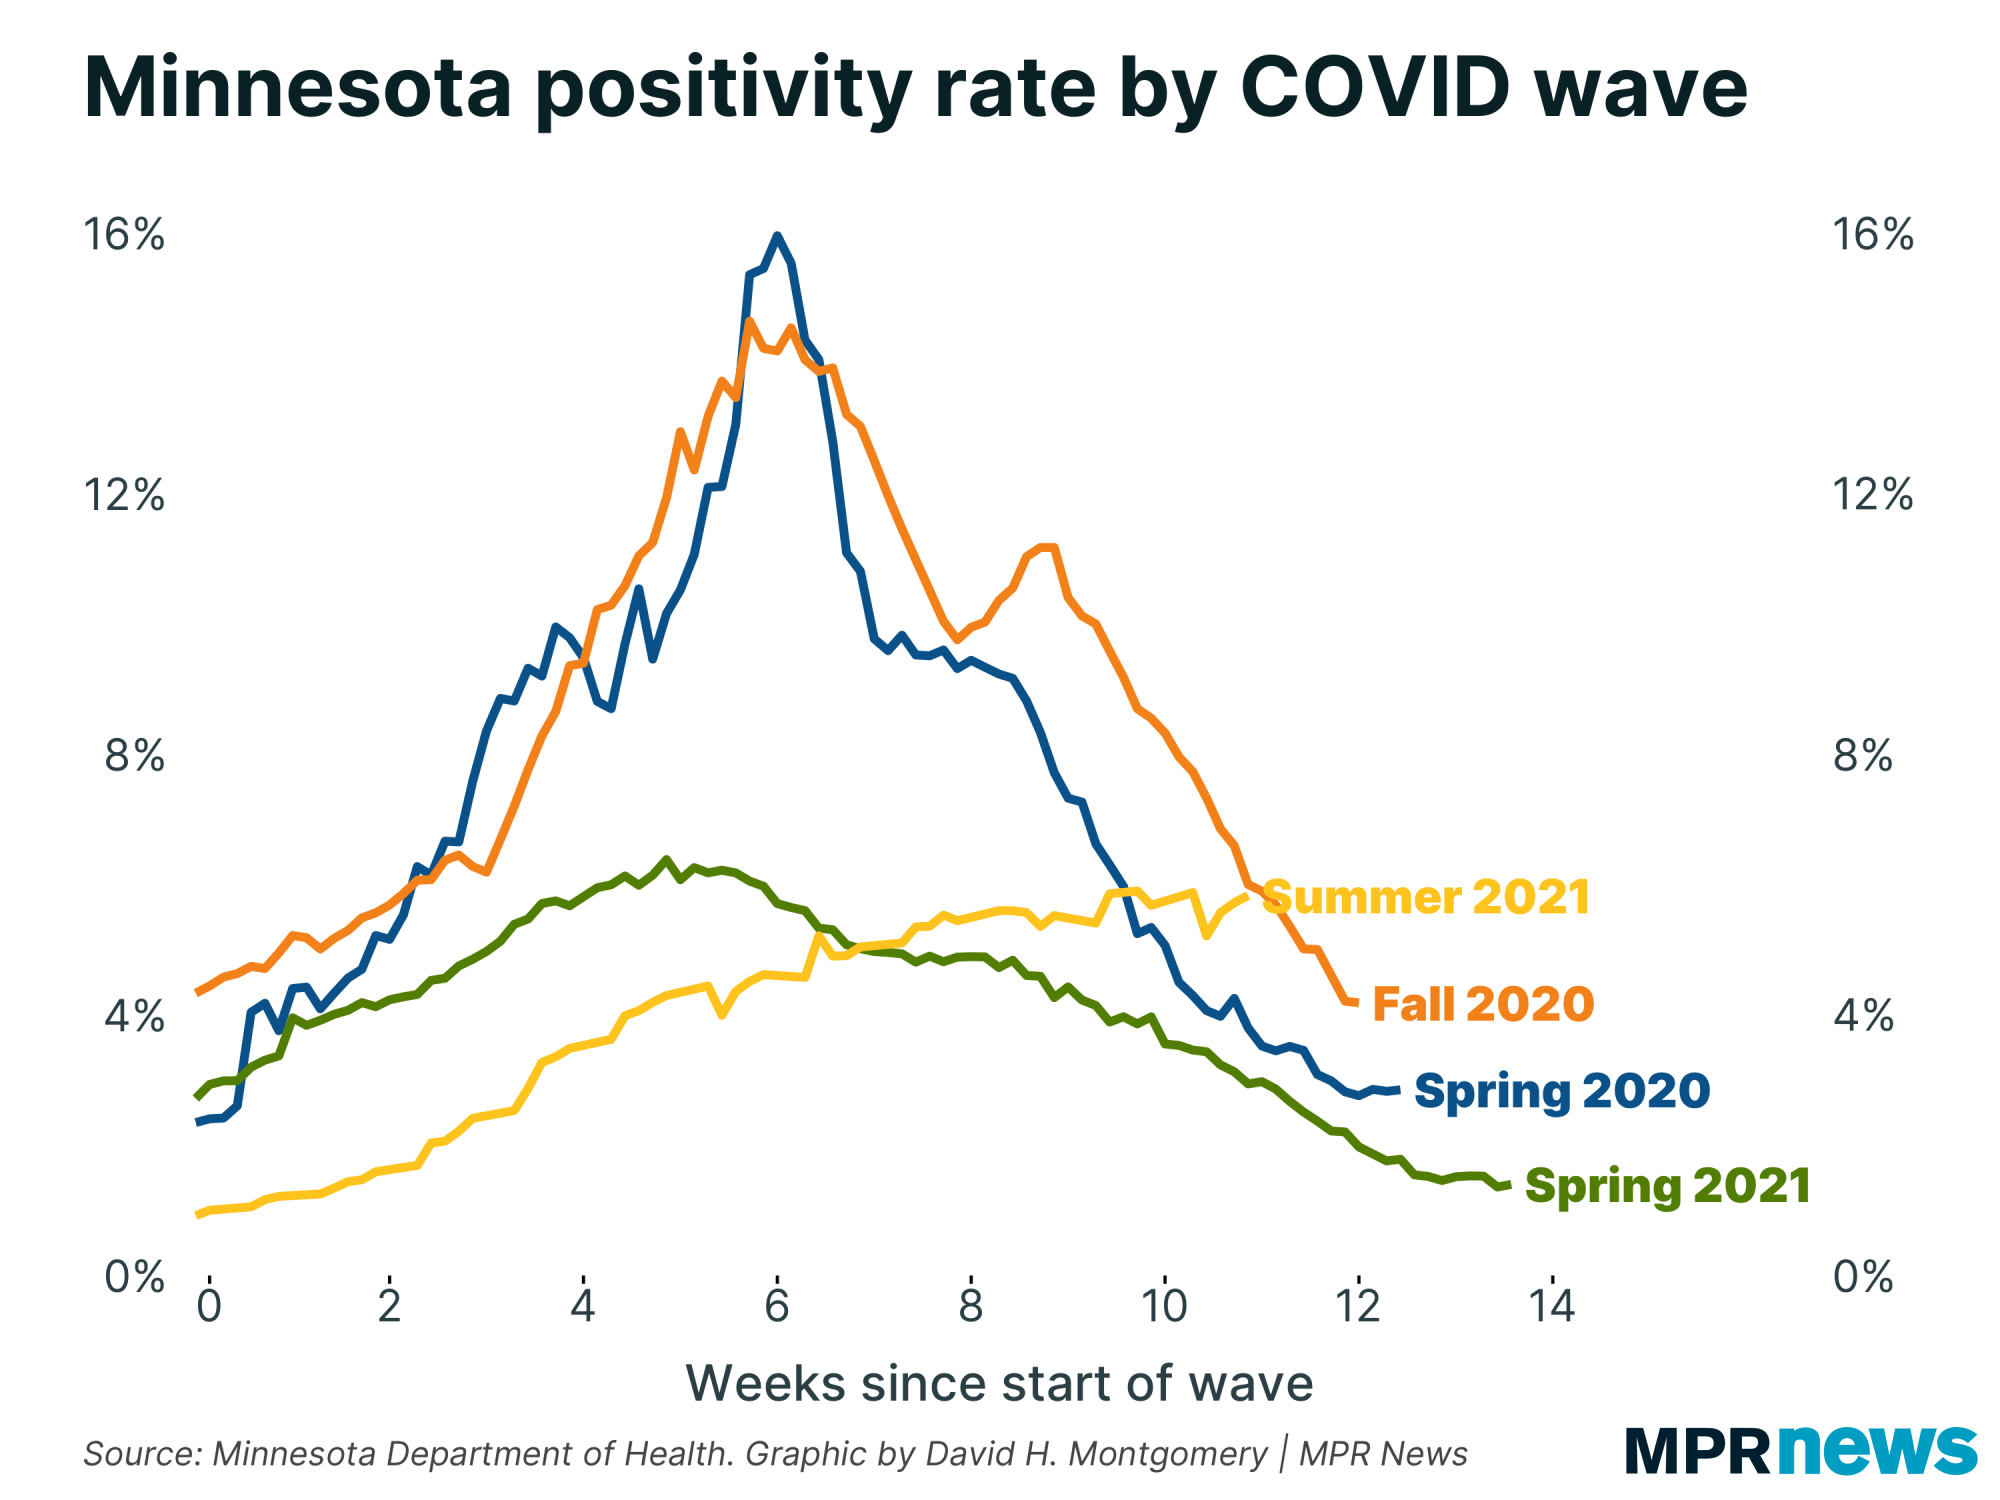
| Comparing to past waves, you can see how our current plateau has just dragged on and on and on, with this fourth wave lasting far longer than any of our past three waves did. | | |
|
|
I don't know why exactly this wave has lasted so long. One possibility is the delta variant is just so different from everything we had before that the old rules don't apply any more.
I do wonder, though, if the real answer doesn't have more to do with just how low our disease prevalence got in June. That start date for the Spring 2020 wave is the beginning of April 2020, which is when Minnesota's positivity rate really started to explode. But of course the virus was circulating in Minnesota for up to a month before that point. It was just relatively rare (but expanding rapidly) and also our metrics were impaired by a severe shortage of tests. If you shift that first wave by four weeks, you get a peak about 10 weeks in, instead of six, making our current wave less of an anomaly.
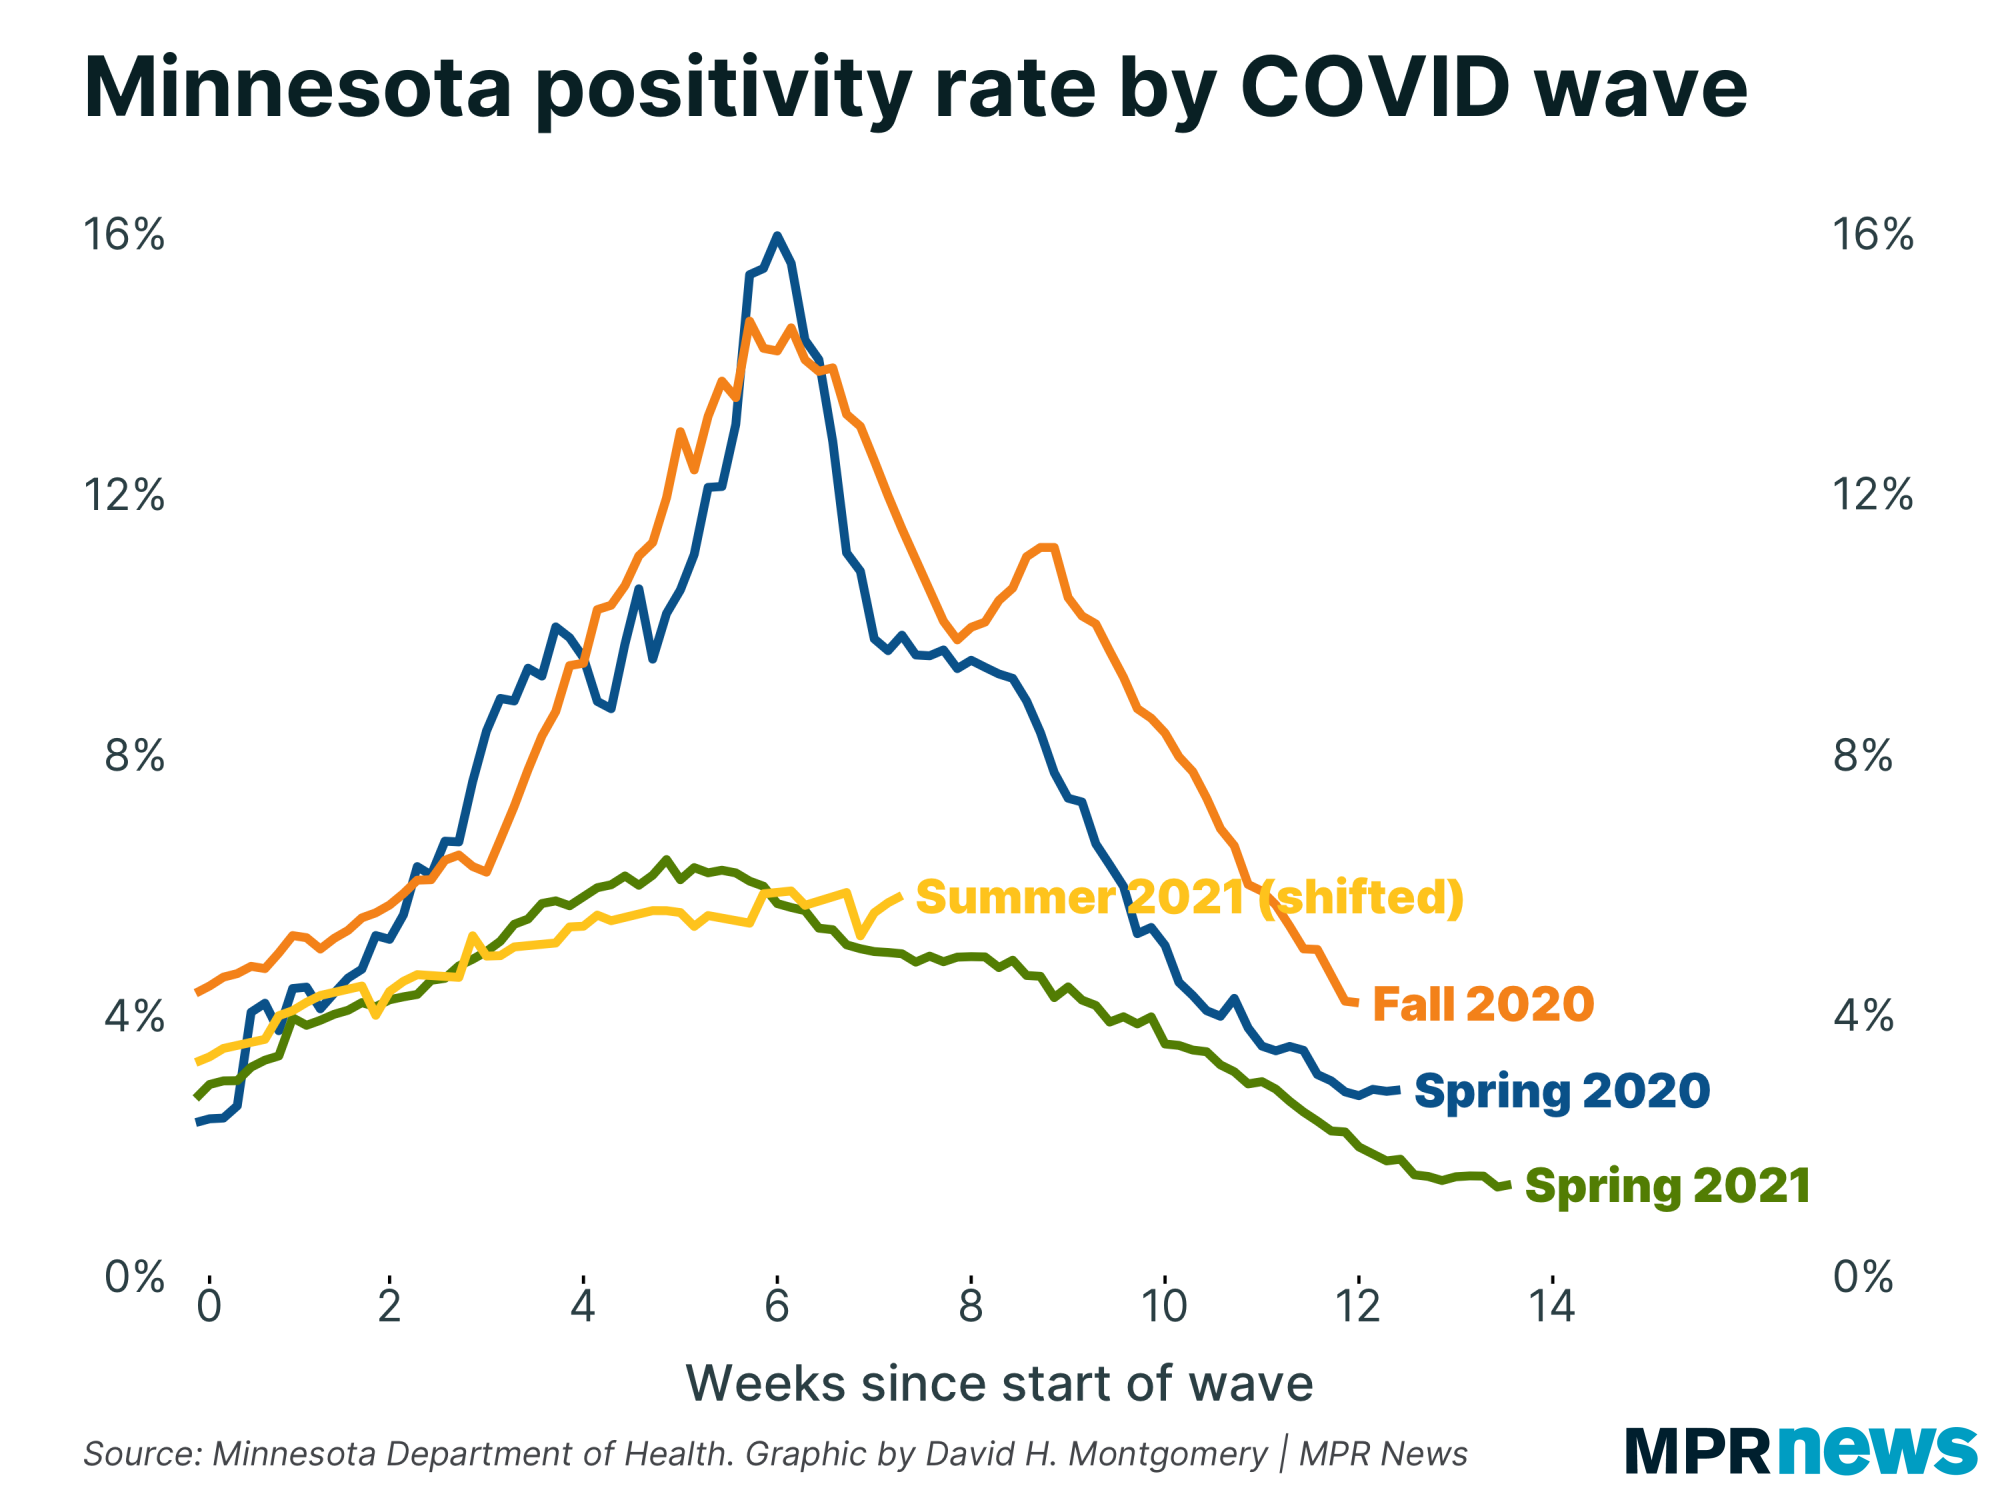
As an experiment, I did just that, starting our current wave not when positivity rate started to rise (July 2) but when it surpassed the starting point of the Spring 2021 wave (July 27).
If you do that, we actually line up pretty well with that spring wave — a little more persistent, but not drastically different. |
| |
|
|
This is just a thought experiment, and you definitely shouldn't take it as proof of anything. Assuming that the future will behave like the past is an easy way to get in trouble, especially with a disease that's still as novel as COVID-19.
In any case, however you shift it, the growth rate of Minnesota's positivity rate hasn't yet reversed, but remains quite low. |
| |
|
|
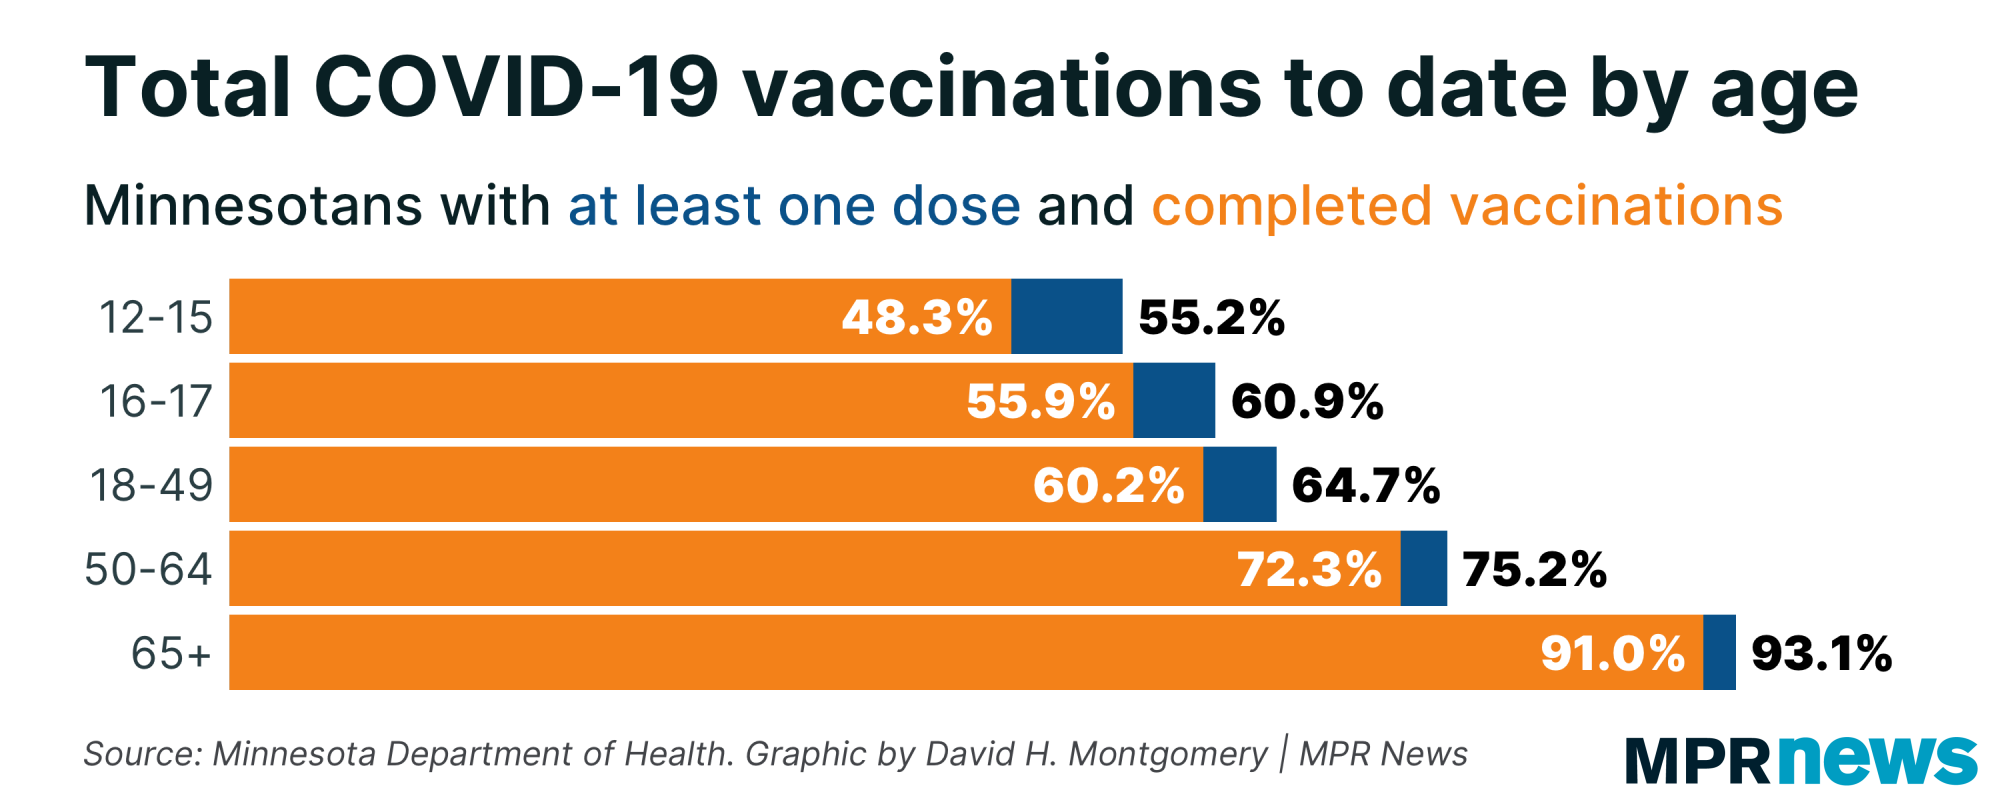
| The other question everyone is justifiably fixed on is the impact of the start of school. Around half of Minnesota teenagers are unvaccinated, along with every child under 12. (Overall, nearly 40 percent of unvaccinated Minnesotans are under 12, and another 9 percent are 12 to 17.) | |
|
|
|
So schools are the state's largest cluster of unvaccinated people, and while most children display few or no symptoms from COVID-19 infections they're still capable of spreading it to others.
But are we seeing widespread outbreaks in schools?
That's hard to say so far. Now, we're definitely seeing some outbreaks in schools, but a scattered outbreak here or there, while important for those impacted, won't make a big difference on statewide numbers. But widespread school outbreaks could, especially when you consider the people those children infect.
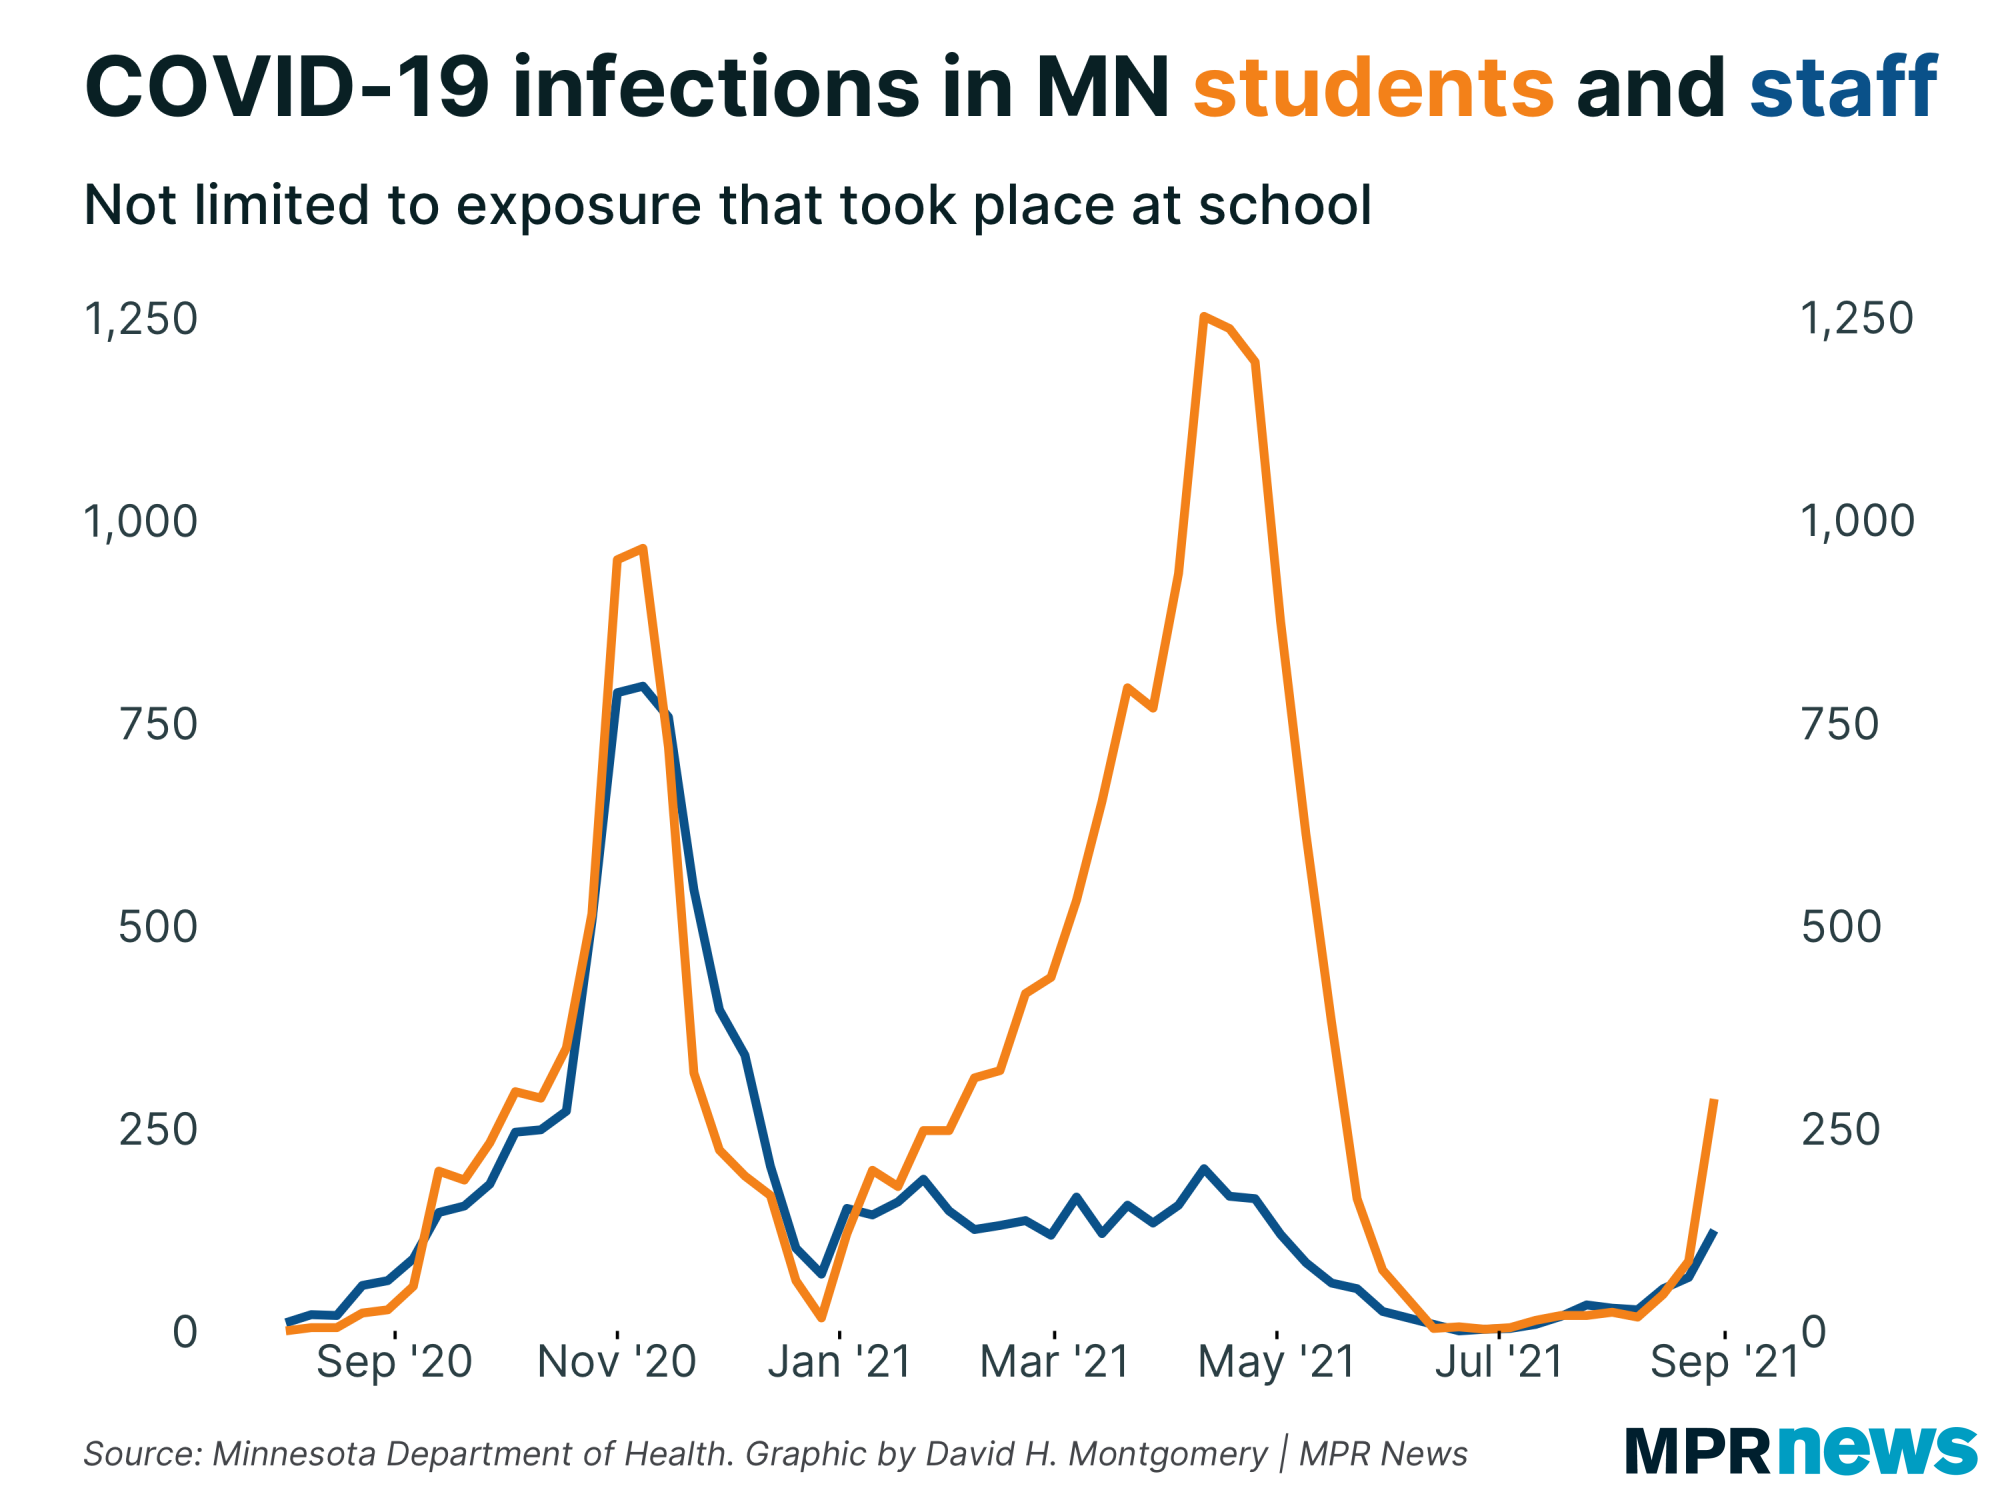
We're definitely seeing more infections among students and teachers alike in the past week or two — as one would expect, given the resumption of school. But a modest increase and a spike are two different things, and it's just too early to tell what we're seeing now.
It's been less than two weeks since most Minnesota students returned to the classroom. So far confirmed cases among students are far below their peaks in the past two waves. We could be at the beginning of a comparable spike, or we could see a modest bump that fades away. |
| |
|
|
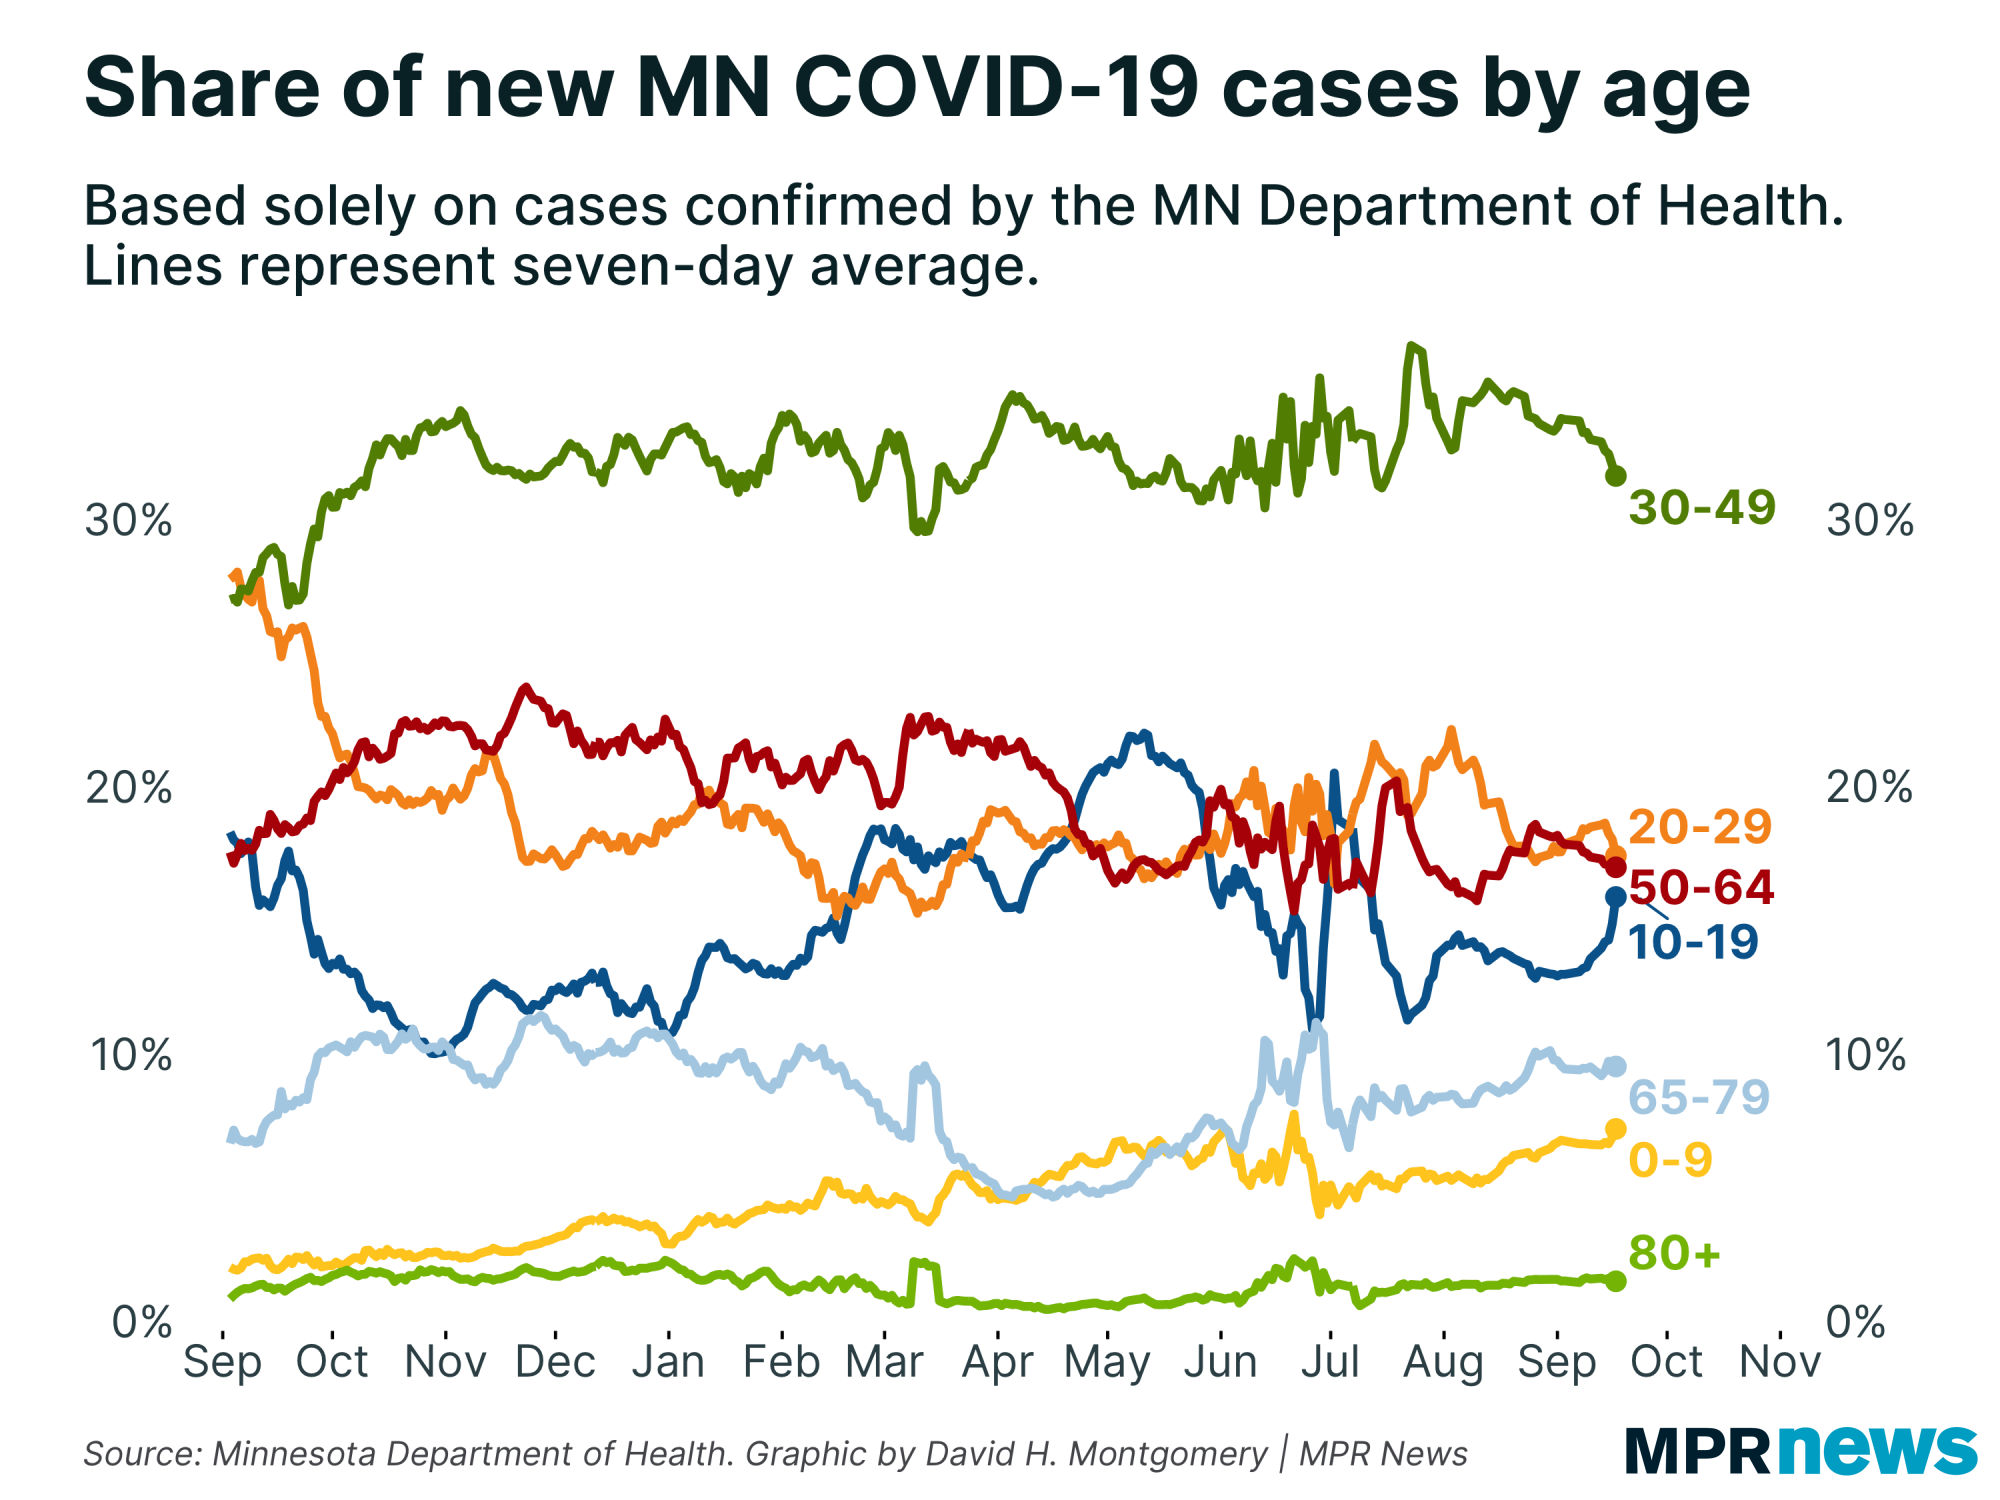
| Overall, we've seen the share of Minnesota's COVID-19 cases that are age 10 to 19 tick up slightly — though not a drastic shift compared to what we've seen in the past. Meanwhile the share of cases that are kids under 10 is relatively flat the past two weeks. | |
|
|
|
| The bottom line: it's possible but not certain that rising cases among children will fuel a broader COVID-19 surge in Minnesota. We'll absolutely see cases among kids go up — that's what happens when you put people together with an infectious disease rolling around — but just how significant this will be on a statewide level is to be determined. |
| |
|
|
Below, I'll explore a few more stats about Minnesota's COVID-19 outbreak. If you want to learn more, I also recommend these other articles:
| | |
|
|
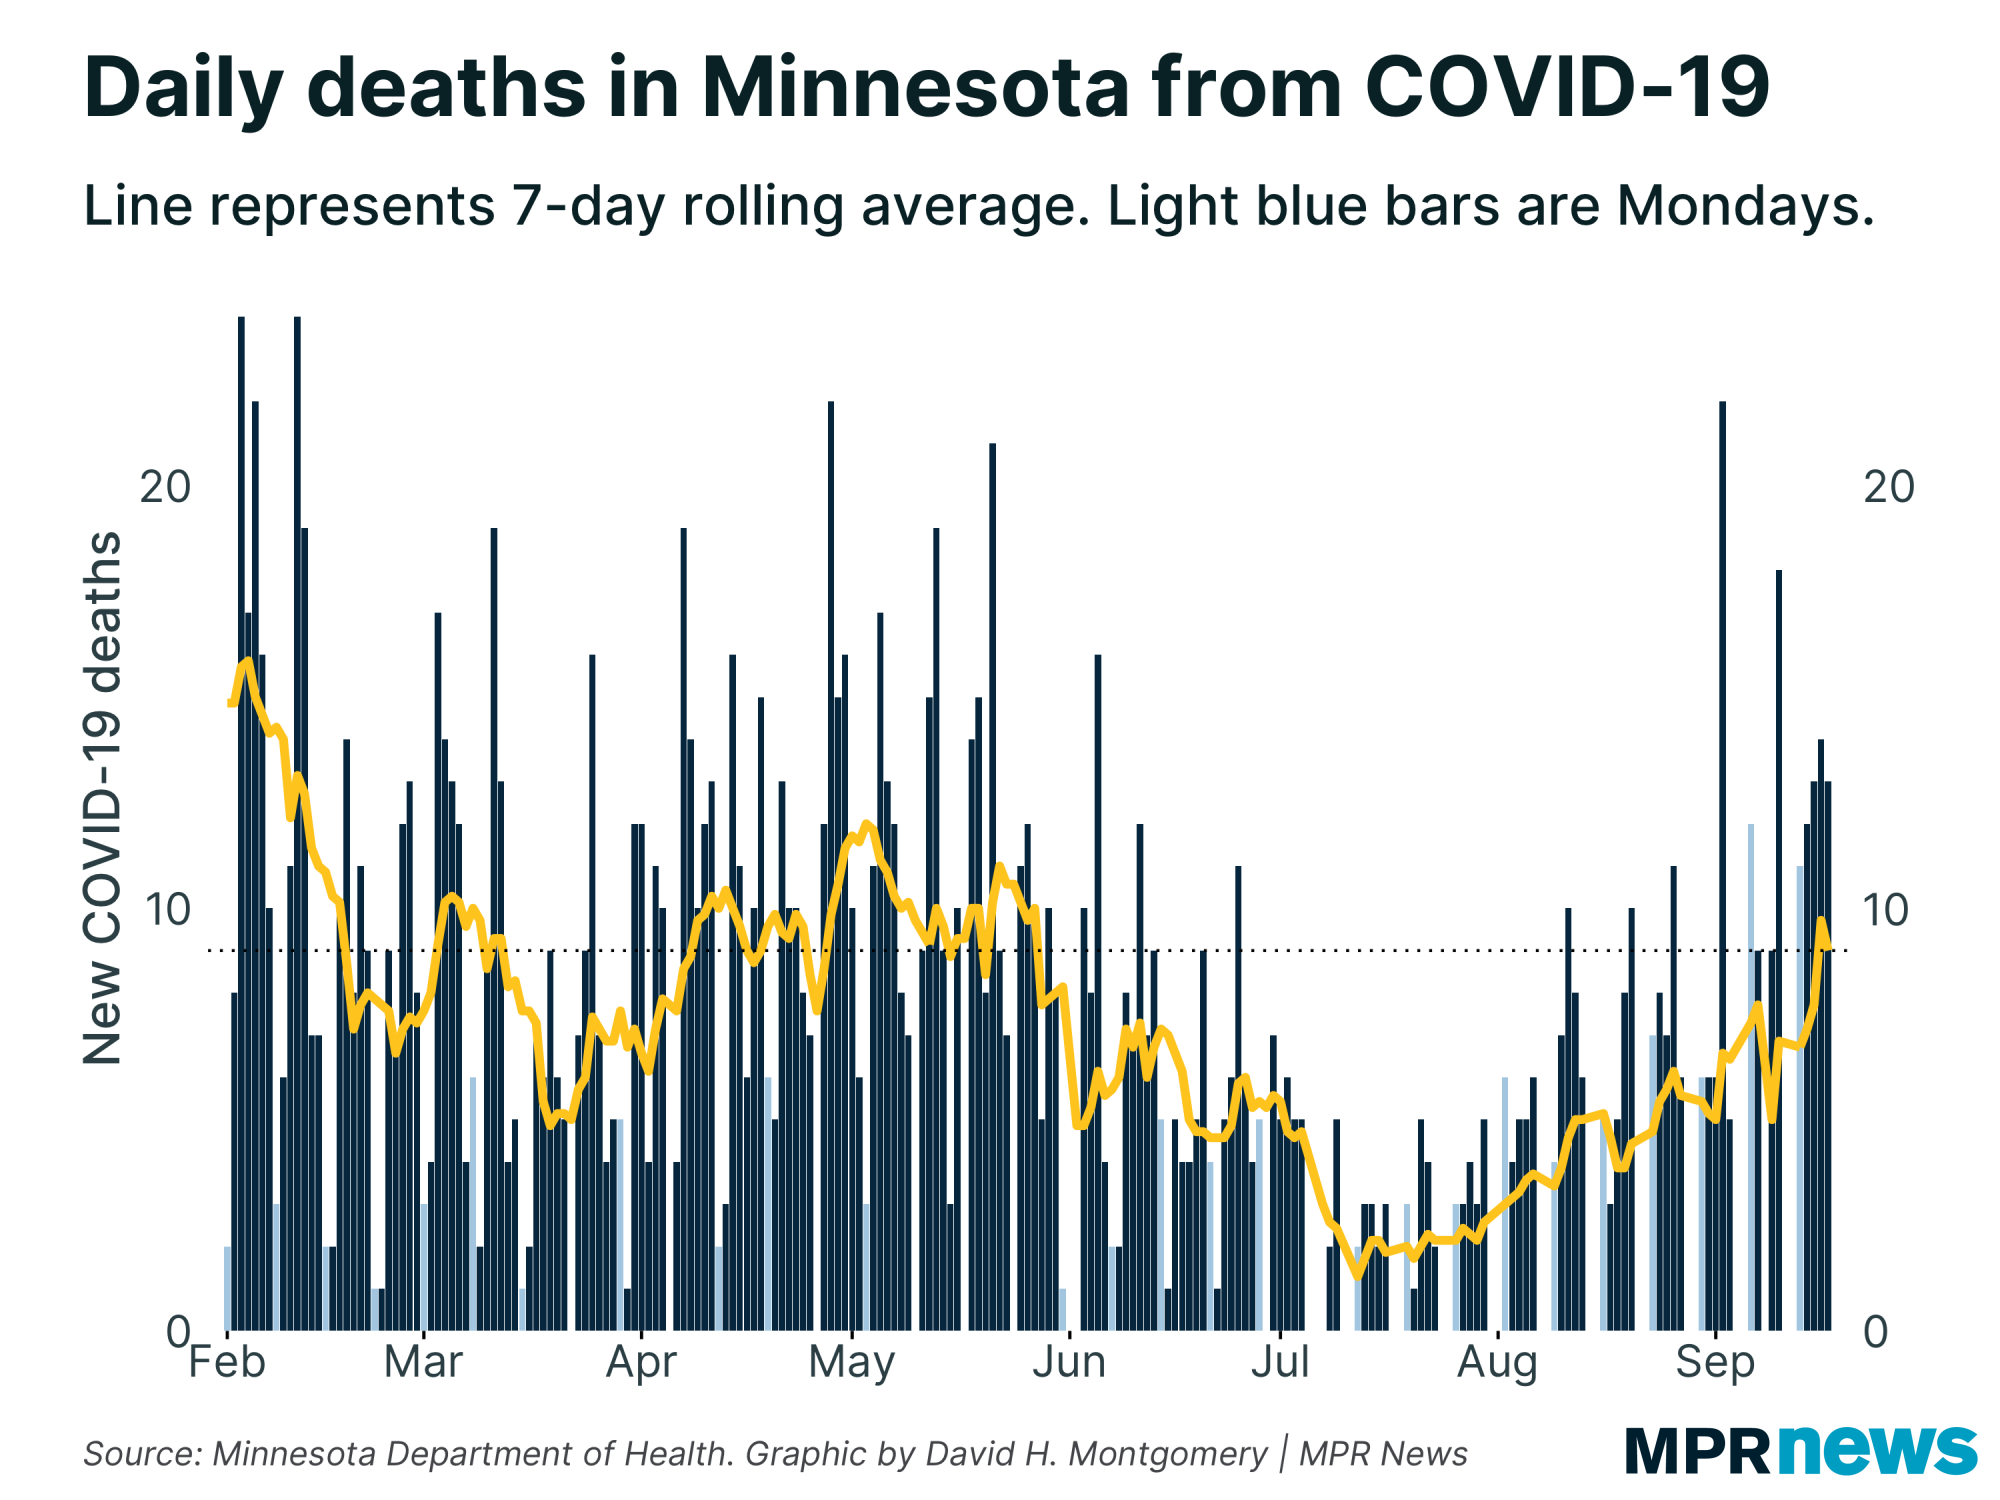
| Deaths rising steadily | | Minnesota's average COVID-19 death death rate has doubled over the past month and is now close to the peaks we saw back in the Spring 2021 wave — though we're still below the symbolic threshold of 10 deaths per day. |
| |
|
|
| Remember, this doesn't mean things are getting bad now — it means things were getting bad weeks ago. The death rate will probably keep on rising for weeks more to come, at a minimum, just because we know more people are still getting infected. | |
|
|
|
The antigen-PCR divergence is closing
|
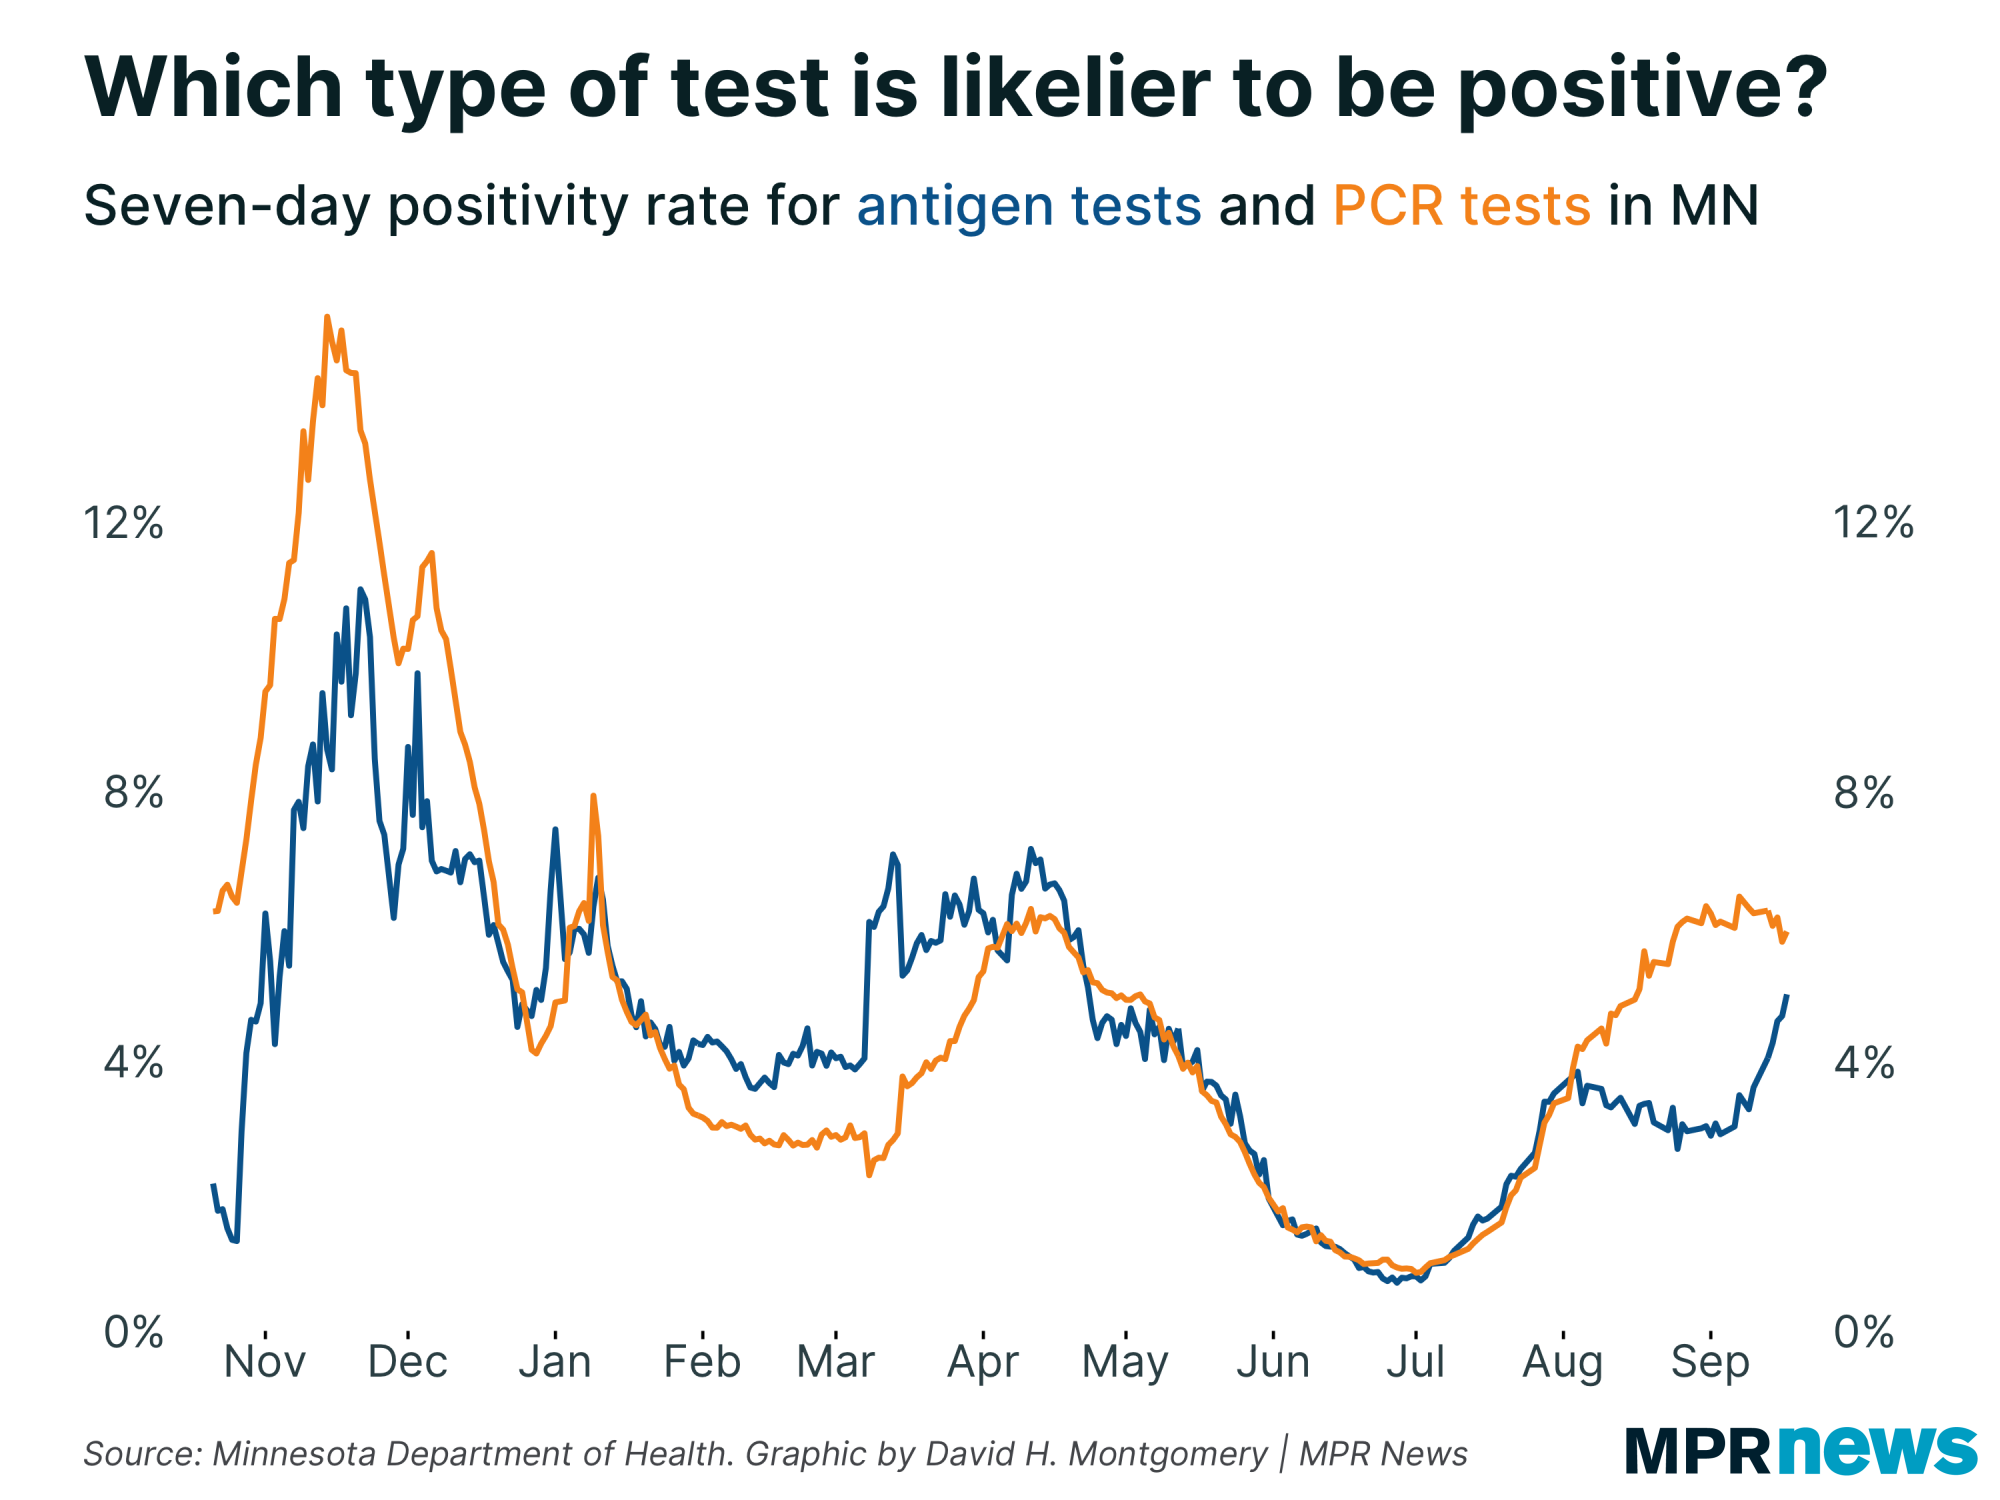
Last time I wrote about how the positivity rate for rapid or antigen tests and that for PCR tests had unexpectedly diverged, with PCR tests much more likely to be positive.
As to why, I didn't have any answers. I checked with the Minnesota Department of Health, who confirmed they had noticed the same thing but didn't know exactly why, either. (Their hypothesis was that long-term care facilities using antigen tests to test everyone at once, which tests to produce lots of negatives unless disease prevalence is really high.)
But even as I and MDH ponder this issue, the gap has begun to close: |
| |
|
|
Now, it's closing primarily because the positivity rate for antigen tests is rising, which isn't the most comforting thing. We'd much rather it close by PCR falling!
On the bright side, PCR tests are seeing falling positivity rates, and also they drastically outnumber antigen tests (about 5:1 right now). So any changes in PCR tests are much more significant statewide than similar changes in antigen tests. |
| |
|
|
What's happening next?
|
Next week is a critical time! If current trends continue, it's when Minnesota could see cases and positivity rate start to decline. But it's also when we would expect to start to see any possible case bump from the State Fair (if one occurs). Any major case bump from school reopenings after Labor Day would take at least another week to show up.
Thanks for subscribing to this newsletter and for all of you who've sent me your feedback. As always, if you like this newsletter, please share it and the sign-up link with others who you think might enjoy it.
— David |
| |
|
|
Preference Center ❘ Unsubscribe You received this email because you subscribed or it was sent to you by a friend. This email was sent by: %%Member_Busname%%
%%Member_Addr%% %%Member_City%%, %%Member_State%%, %%Member_PostalCode%%
  |
|
|
| | |