| Welcome back to COVID in Minnesota TODAY, an email newsletter from MPR News about understanding the latest developments in Minnesota's COVID-19 outbreak. | | |
|
|
Minnesotaʼs never-ending fourth wave continues its little ups and downs, frustratingly never actually peaking, but thankfully never truly accelerating, either.
Underneath these topline figures, COVID appears to be spreading among children and in rural Minnesota, while itʼs slow or flat among older people and in the Twin Cities metro. (Unfortunately, data on cases by age by geography are not regularly released by the Minnesota Department of Health, so we canʼt readily see whether, say, cases are actually on the decline among adults in the Twin Cities. This is an entirely plausible reality based on the overall data, but we just canʼt say for sure if itʼs happening.)
All that and more below. |
| |
|
|
Three things to know
| - COVID-19 continues to spread in Minnesota, though some of the increases in case counts are probably driven by expanded testing
- Minnesotaʼs outbreak right now is concentrated in children and Greater Minnesota. Older adults and the Twin Cities metro are seeing flat case counts
- COVID deaths continue to mount, though mortality remains below the prevaccine 2020 peaks
|
| |
|
|
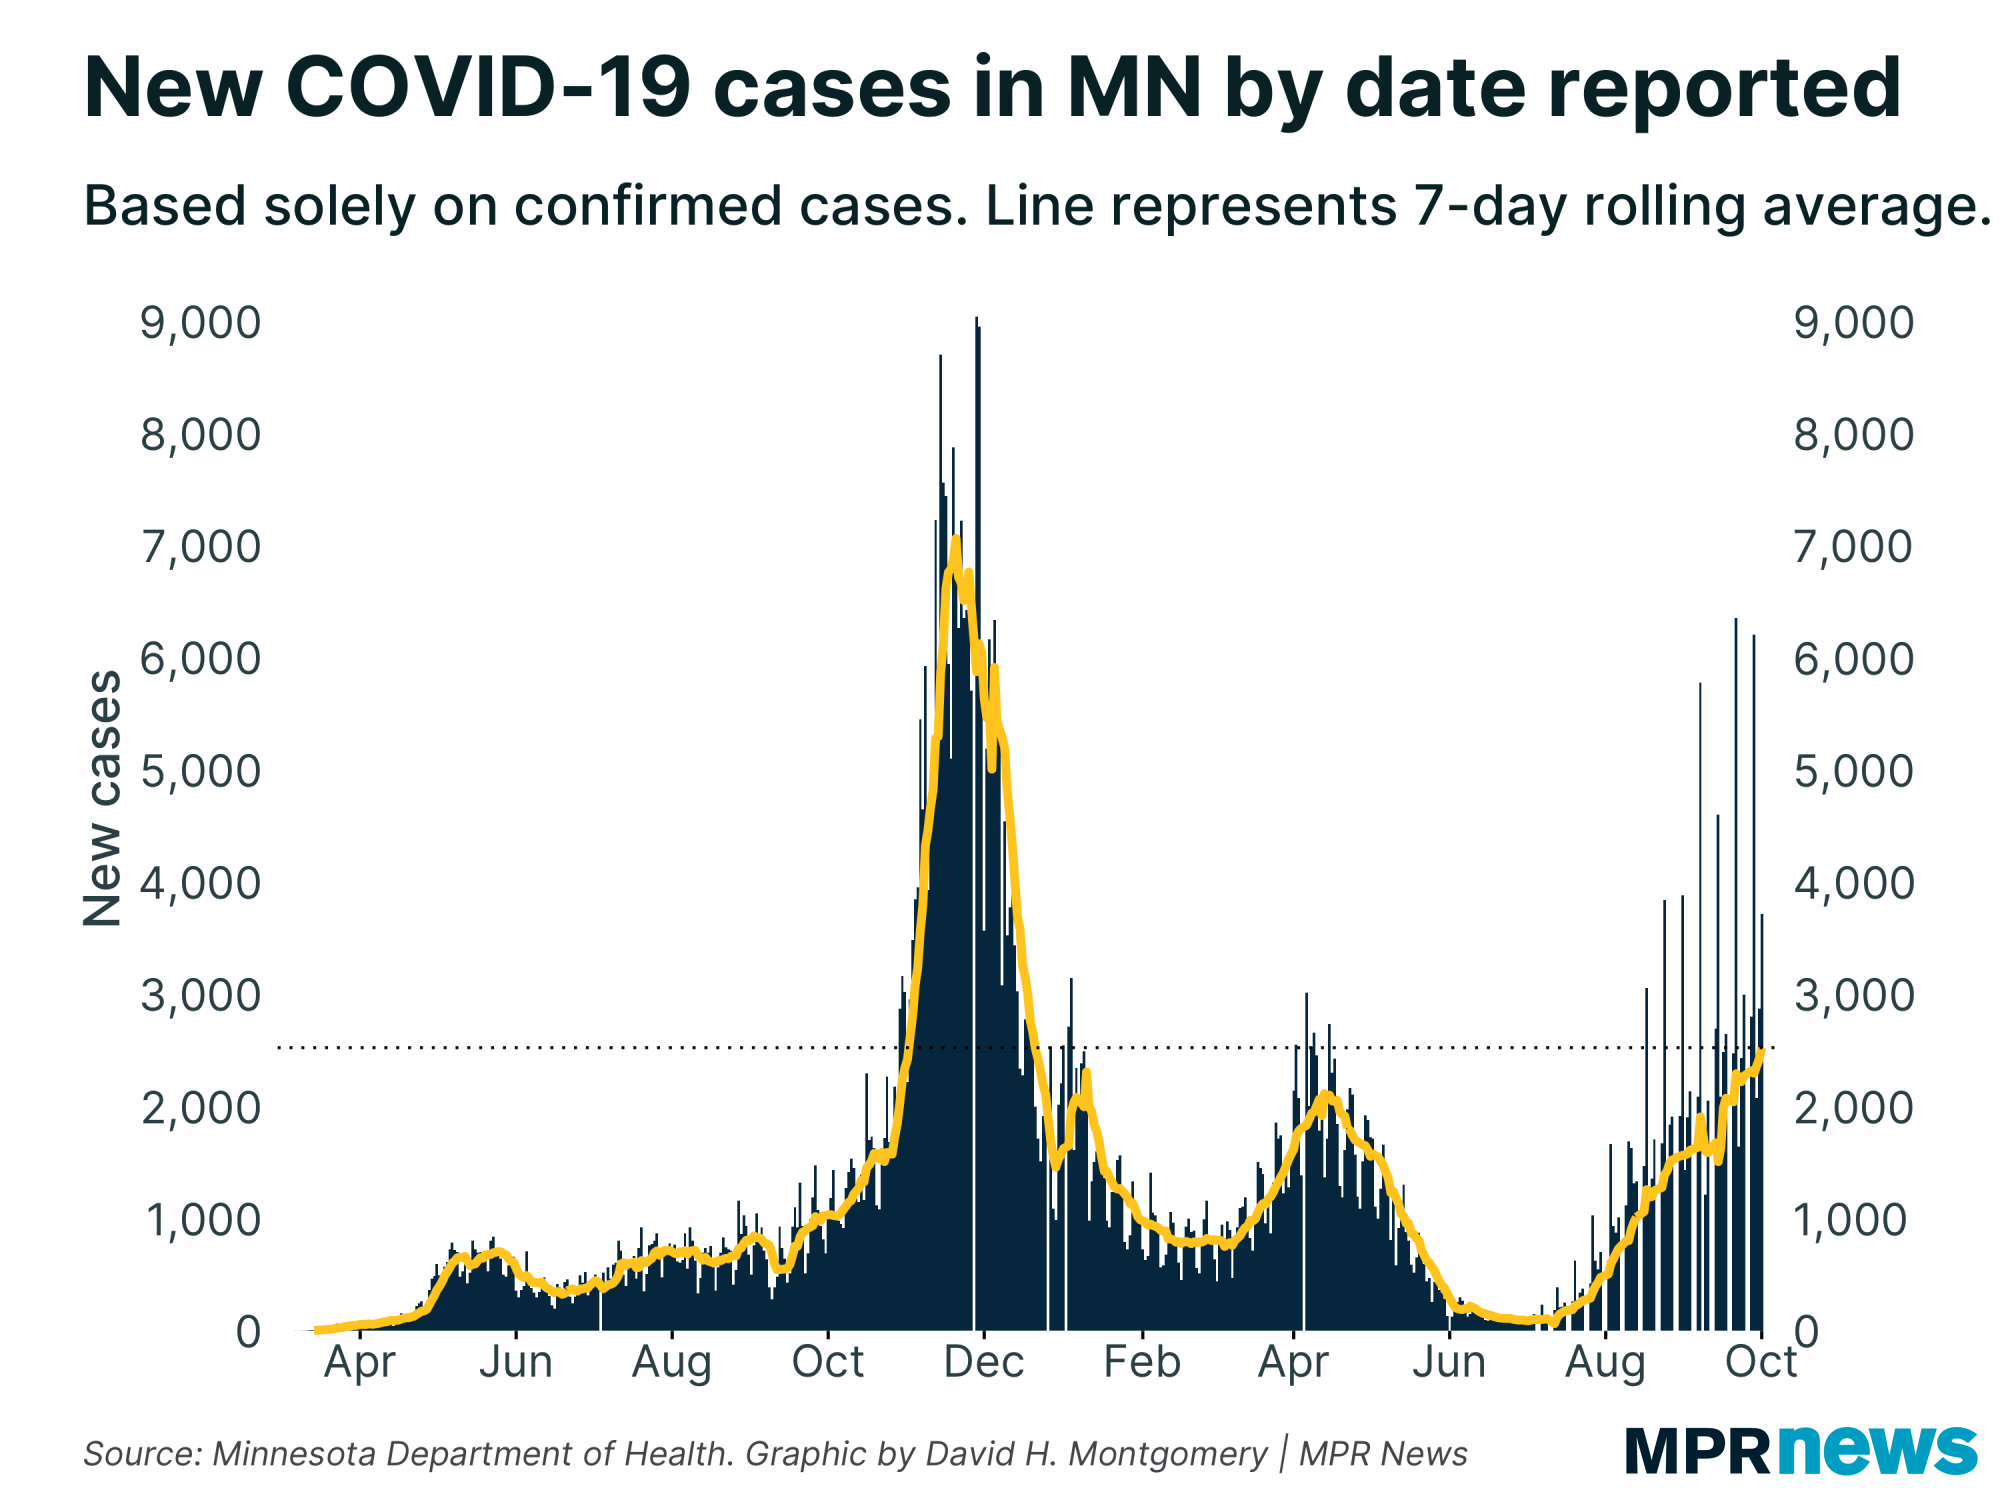
| Newly discovered cases continue their steady, fairly linear growth upward. Over the past week weʼve averaged about 2,500 newly confirmed cases per day. Thatʼs about 250 more daily cases than we were averaging last Friday — which is just barely above the average 230 cases per week weʼve added since the start of August. | |
|
|
|
Now on the one hand, this is frustratingly persistent. On the other hand, a consistent increase of +230 cases per week is an ever-shrinking percent growth rate. Weʼre seeing about 11 percent more daily cases this week than last week. But back in August we were seeing 20, 30, or even 50 percent growth rate.
Whatʼs scary about COVID-19 is when it is growing at a consistent percentage; thatʼs when you see the raw case counts increase by ever larger figures each week. And right now weʼre just not seeing that, and havenʼt for some time.
Basically: our outbreak could be a lot better, but it could also be a lot worse.
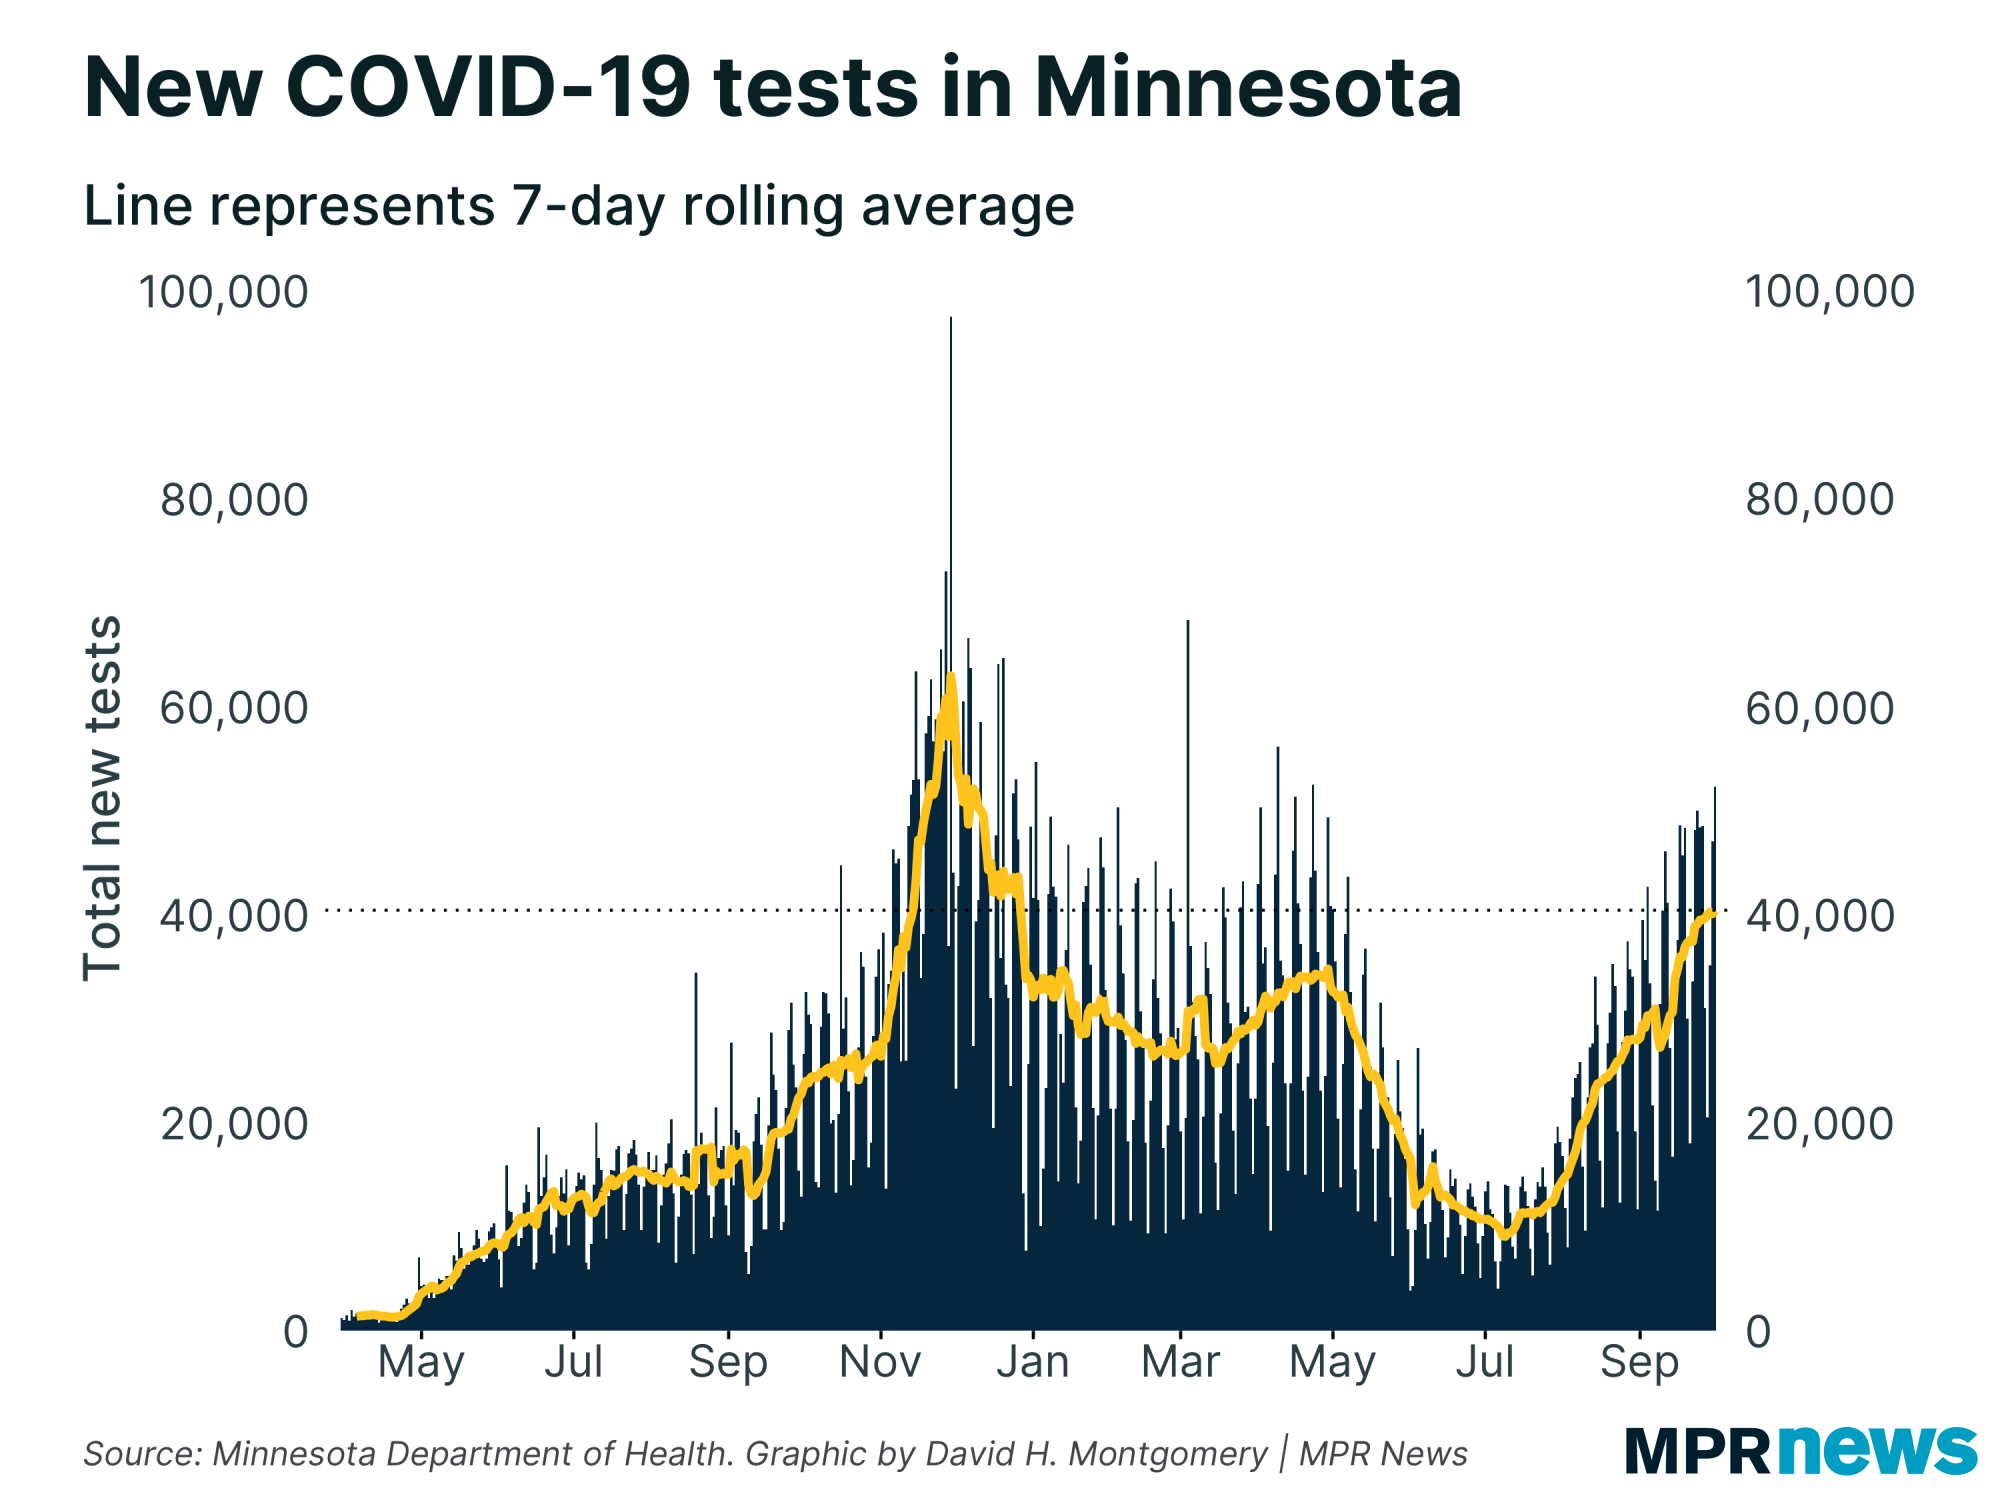
And of course a good deal of this increase may be explained by expanded testing, which has consistently risen and are now at levels not seen since the brutal Fall 2020 surge. |
| |
|
|
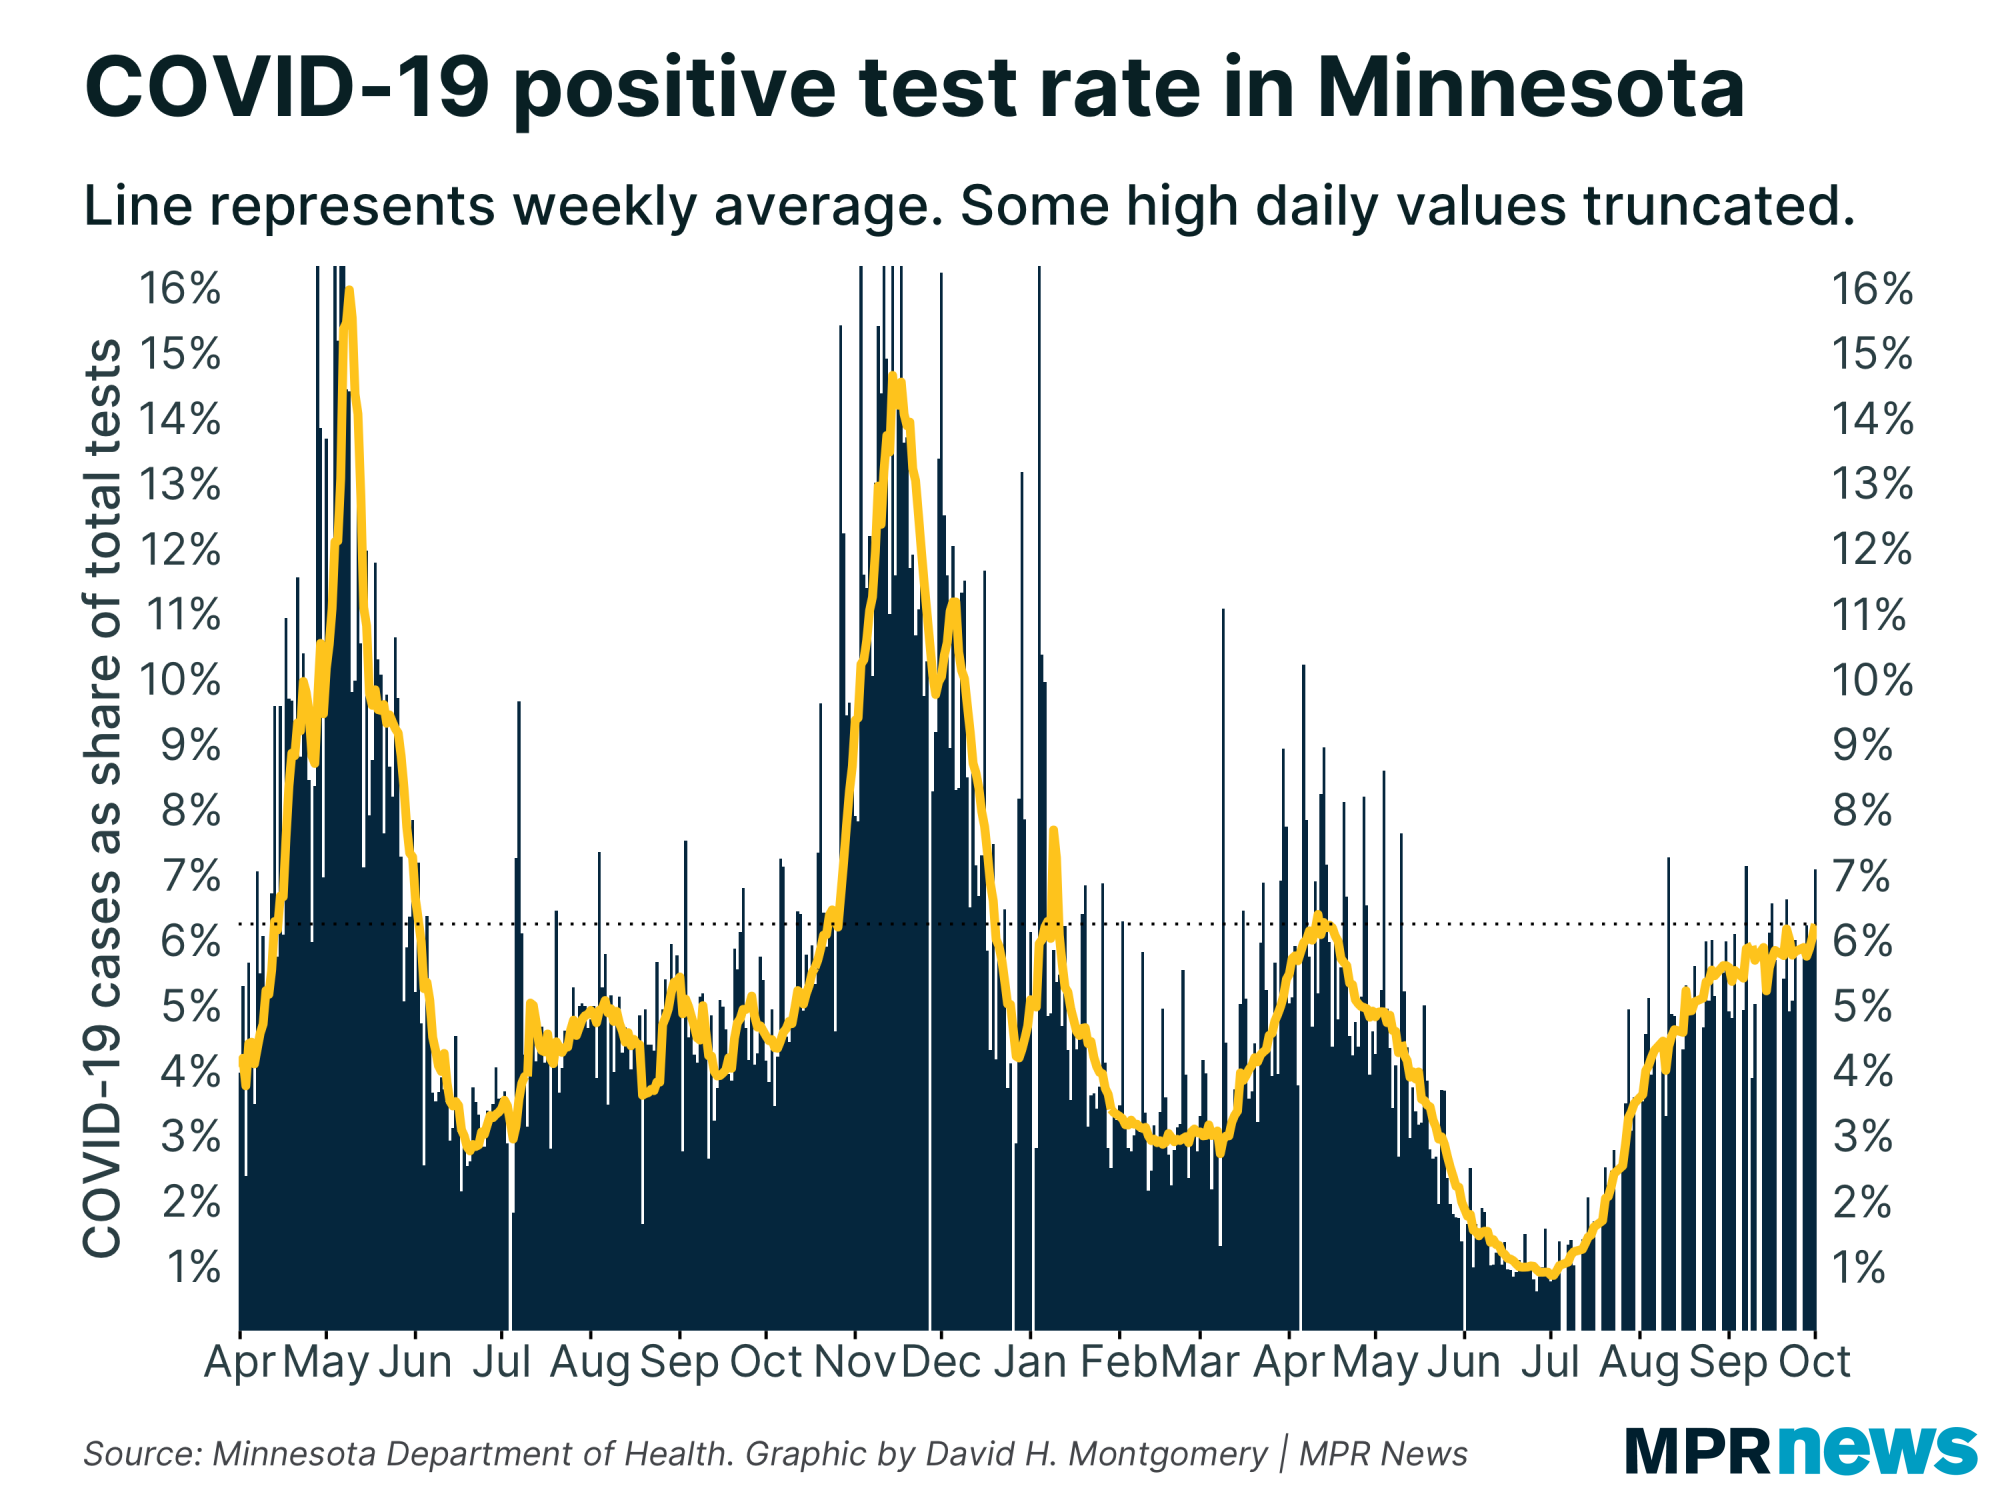
| But back in the fall wave, Minnesota was seeing more than 10 percent (and sometimes far more than 10 percent) of those tests come back positive. Right now weʼre holding pretty steady at around 6 percent positive — about where we peaked this spring. | |
|
|
|
What are we to conclude when cases are going up but positivity rate is flat? The former suggests an expanding outbreak (albeit a decelerating one); the latter suggests a plateau. My longstanding position is that positivity rate is a more reliable stat than raw cases, and I stand by that, but itʼs not as simple as saying that “positivity rate is right and cases are wrong.” Itʼs a chicken-and-egg problem: more tests produce more cases by finding a higher share of infections, but more infections also produce more tests as more people develop symptoms or get exposed.
When cases are growing and positivity rate is flat, what that tells me is not that cases arenʼt growing, but that much of that growth (not all!) is driven by testing.
But even as much as tests are growing, itʼs not enough to actually bring Minnesotaʼs positivity rate down. If our positivity rate were consistently falling, that would give me more confidence to disregard an increase in confirmed cases. Alas, thatʼs not happening yet.
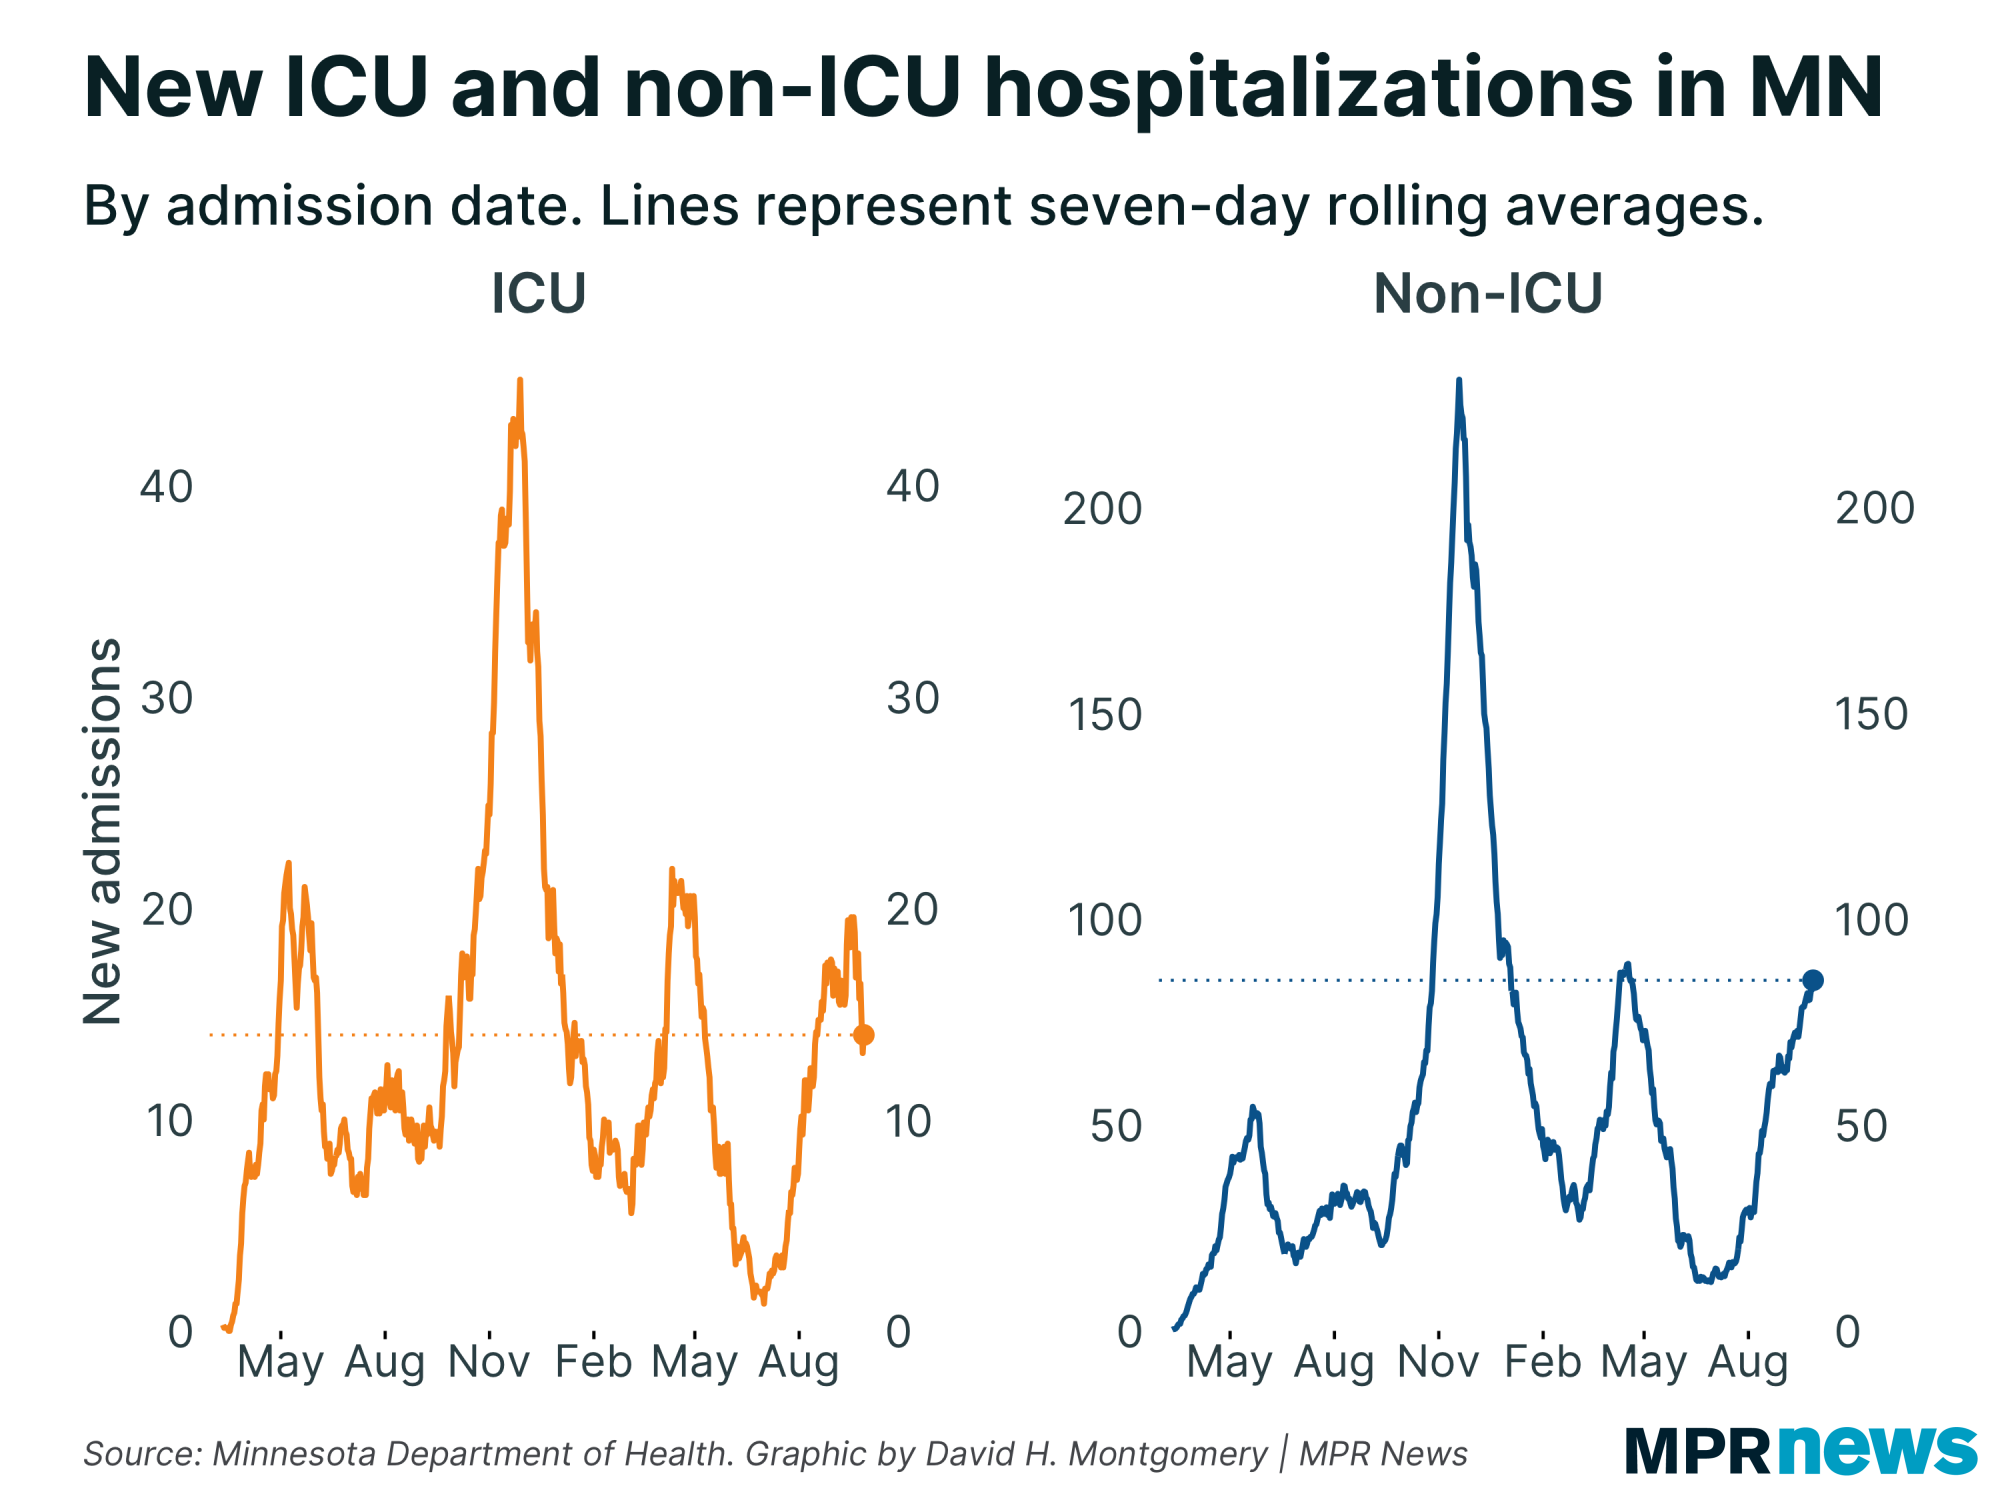
Turning to hospitalizations, there are some interesting dynamics going on. This metric is a little messier than cases or positivity, but there are some encouraging signs that ICU admissions might be peaking or plateauing. Non-ICU admissions, alas, are still rising. |
| |
|
|
Again, Iʼd advise caution interpreting this in the moment because of how messy the data can be.
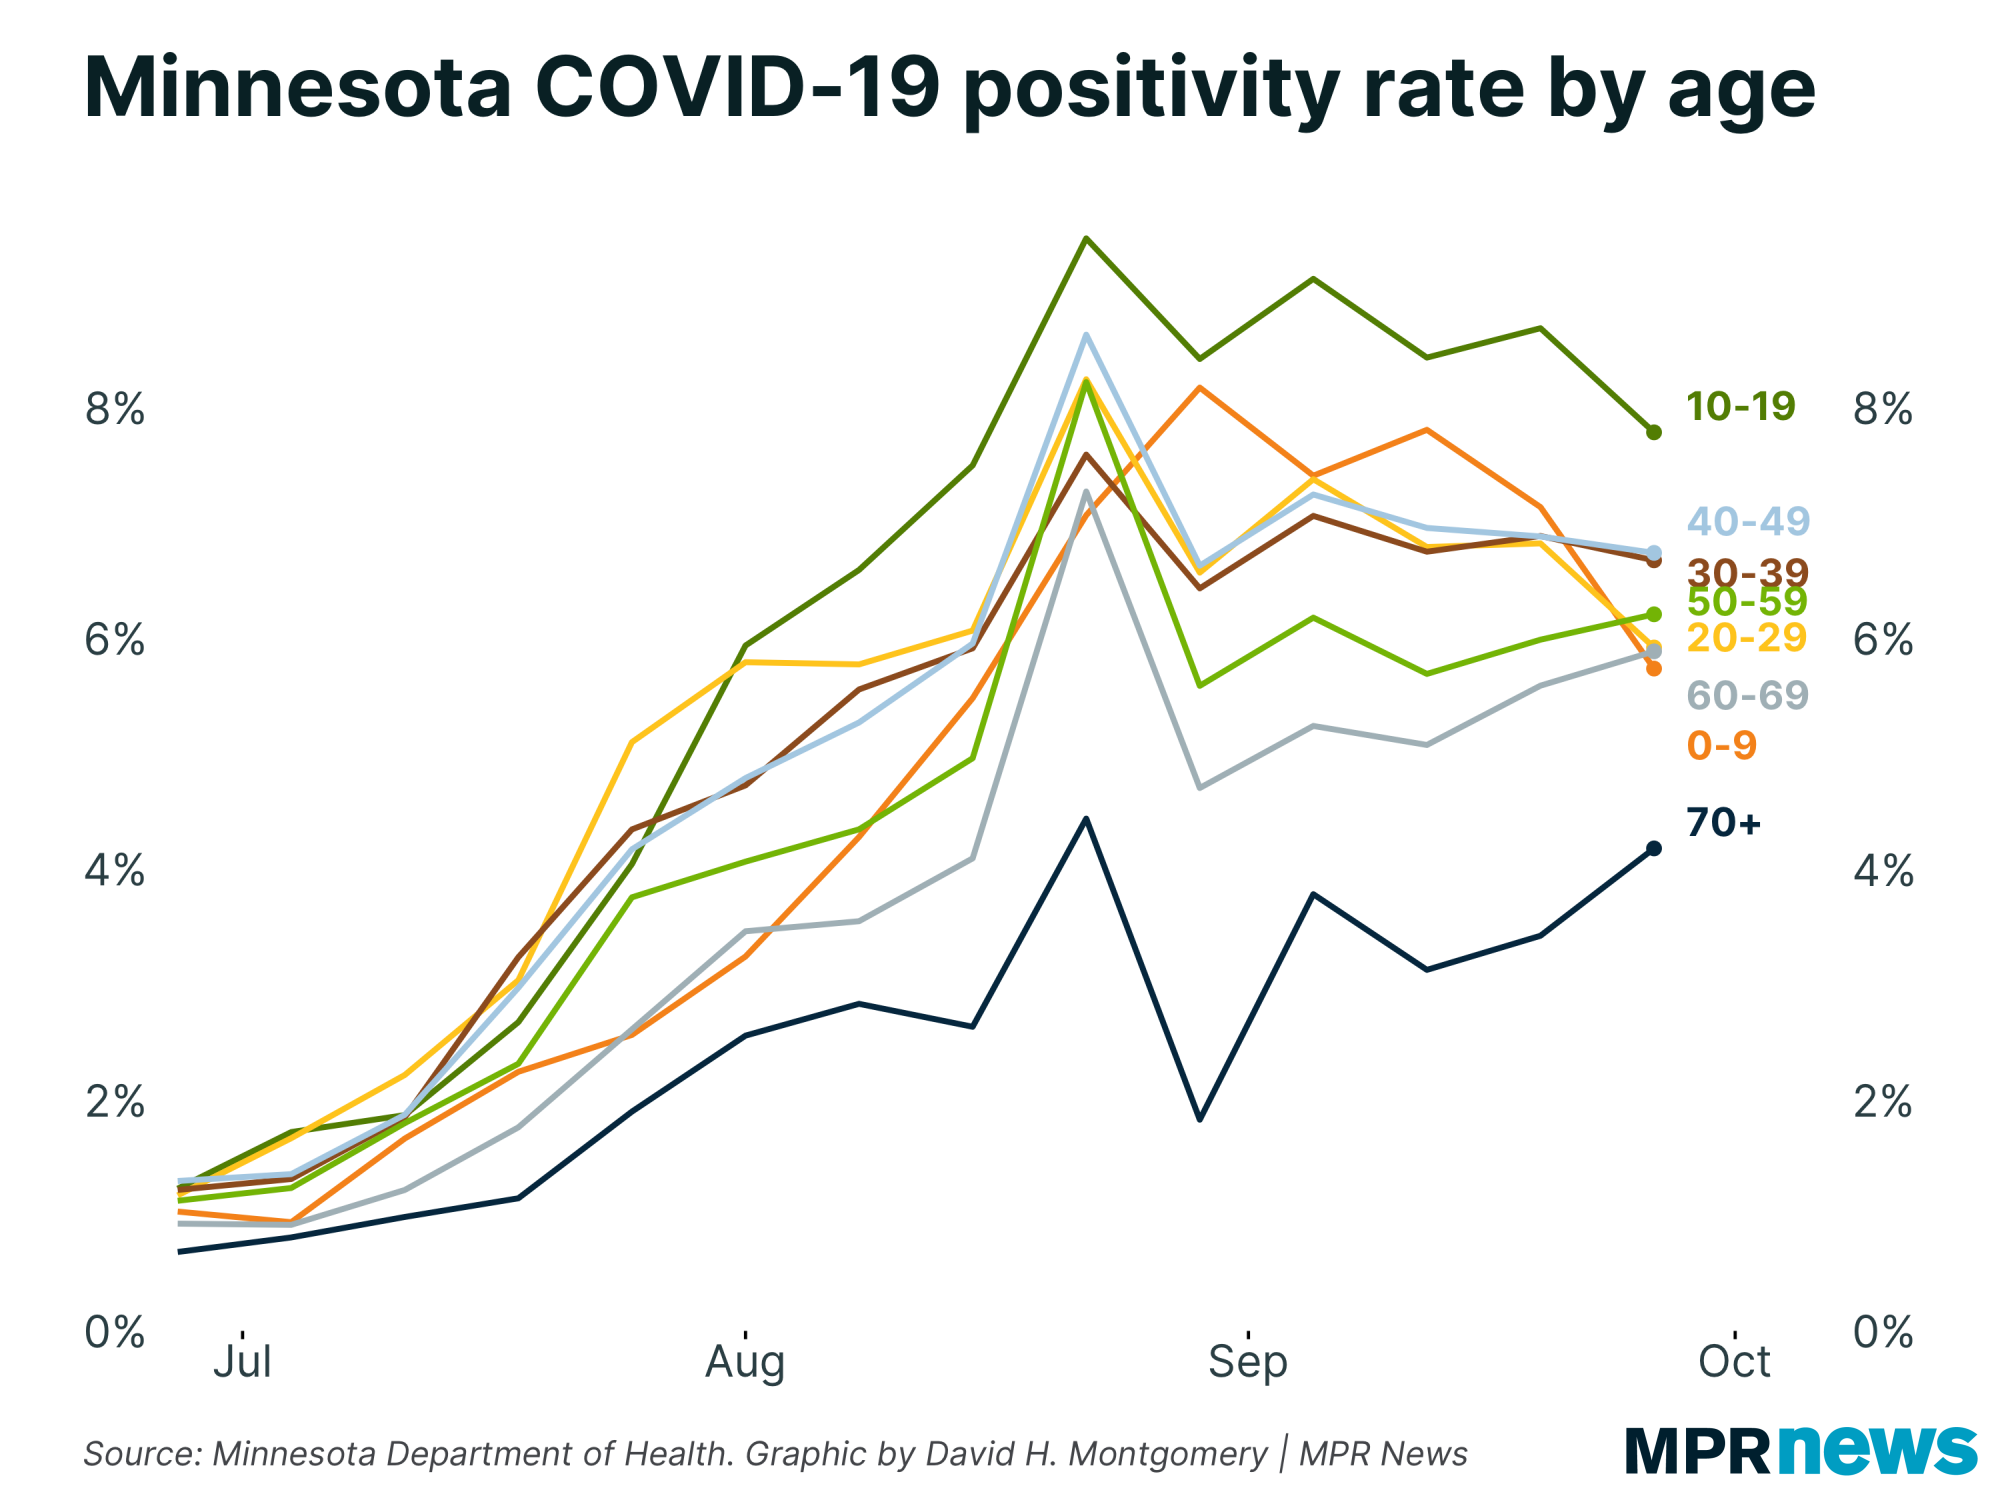
The pressing concern for so many people in Minnesota is cases among children. Iʼve talked about this a lot in recent weeksʼ of this newsletter, so Iʼll be a little more concise this time.
I think infections among children are clearly rising right now, and are definitely rising more quickly here than any other age group. That said I think the measured growth in confirmed cases might be overstating the rise in infections because the return of school means kids are being tested a lot more, and thus infections with mild or no symptoms are more likely to be confirmed as cases.
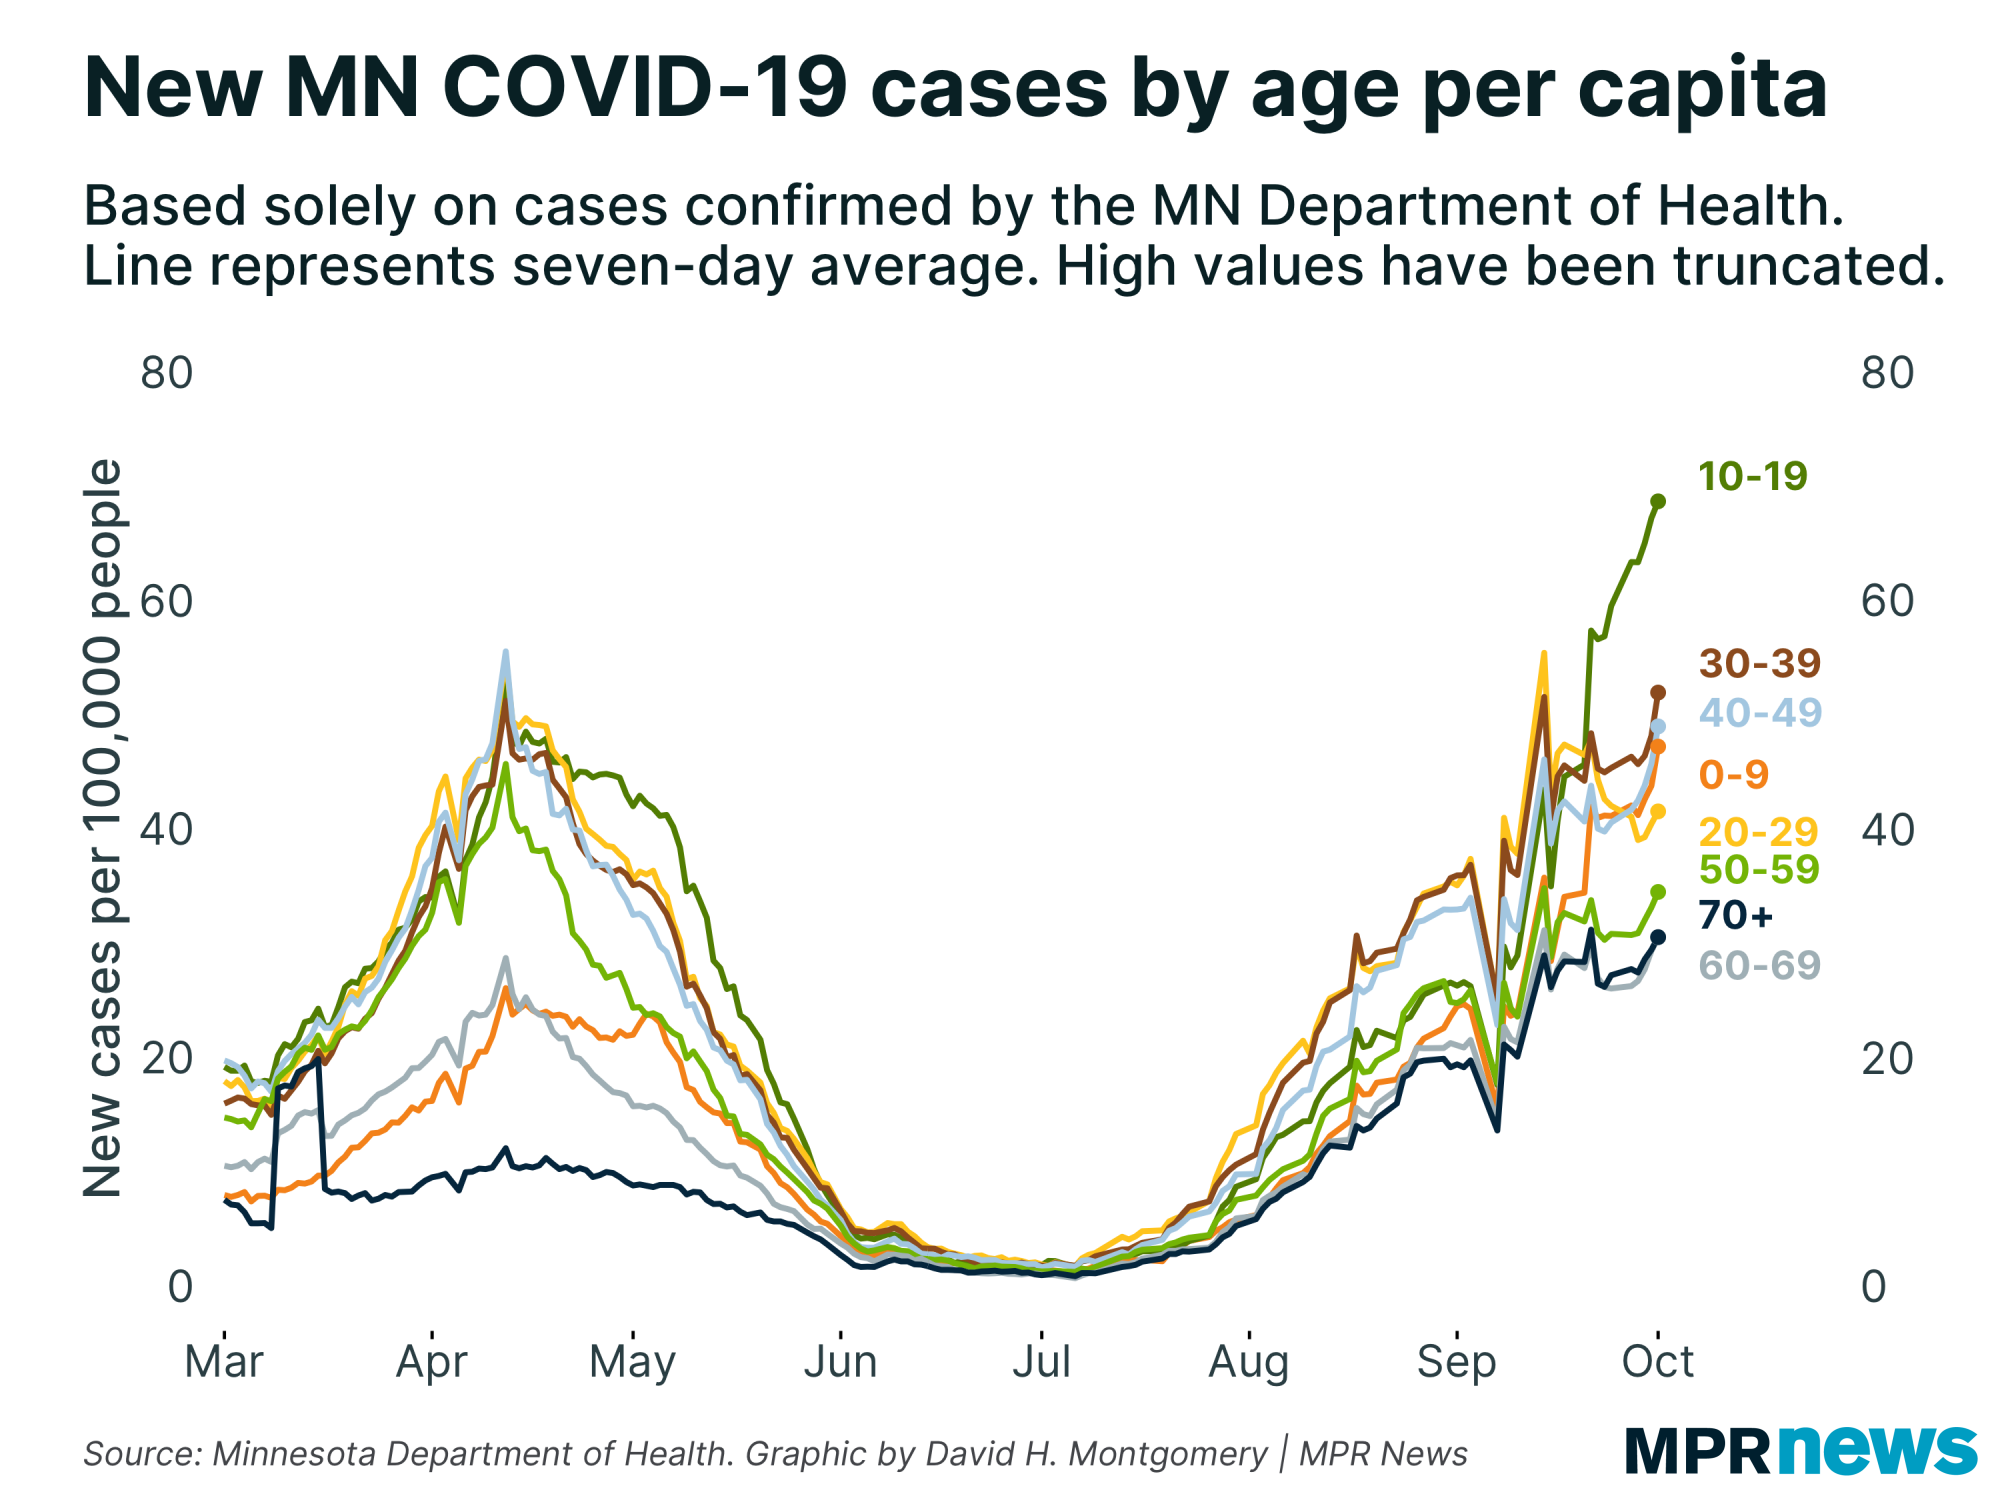
Hereʼs the overall count of cases by age group right now; as you can see, confirmed cases are high and rising quickly among kids 10-19, and also on the rise among kids under 10. |
| |
|
|
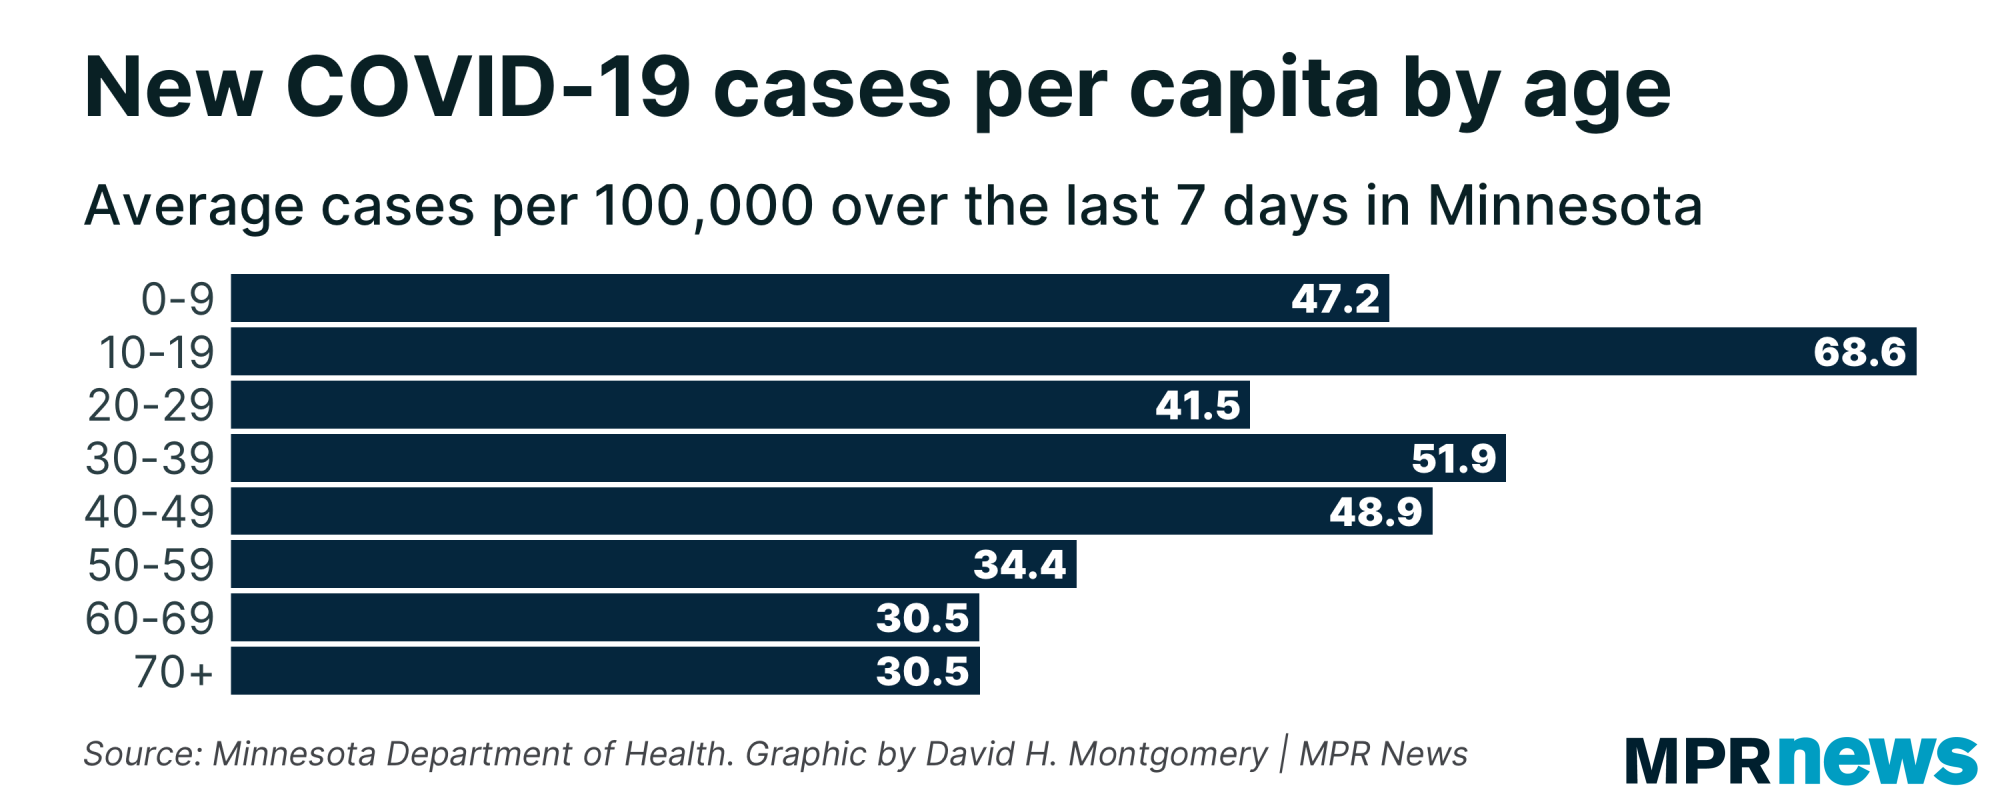
| Overall, confirmed cases are more than twice as high among teenagers as they are among seniors. Cases among kids are also steadily rising, and might possibly be in second place by the end of next week. (If this happens, it would be pretty unprecedented — these youngest kids have been the one group to never show that many confirmed cases, though some of that is likely due to more limited testing in this group until now.) |
| |
|
|
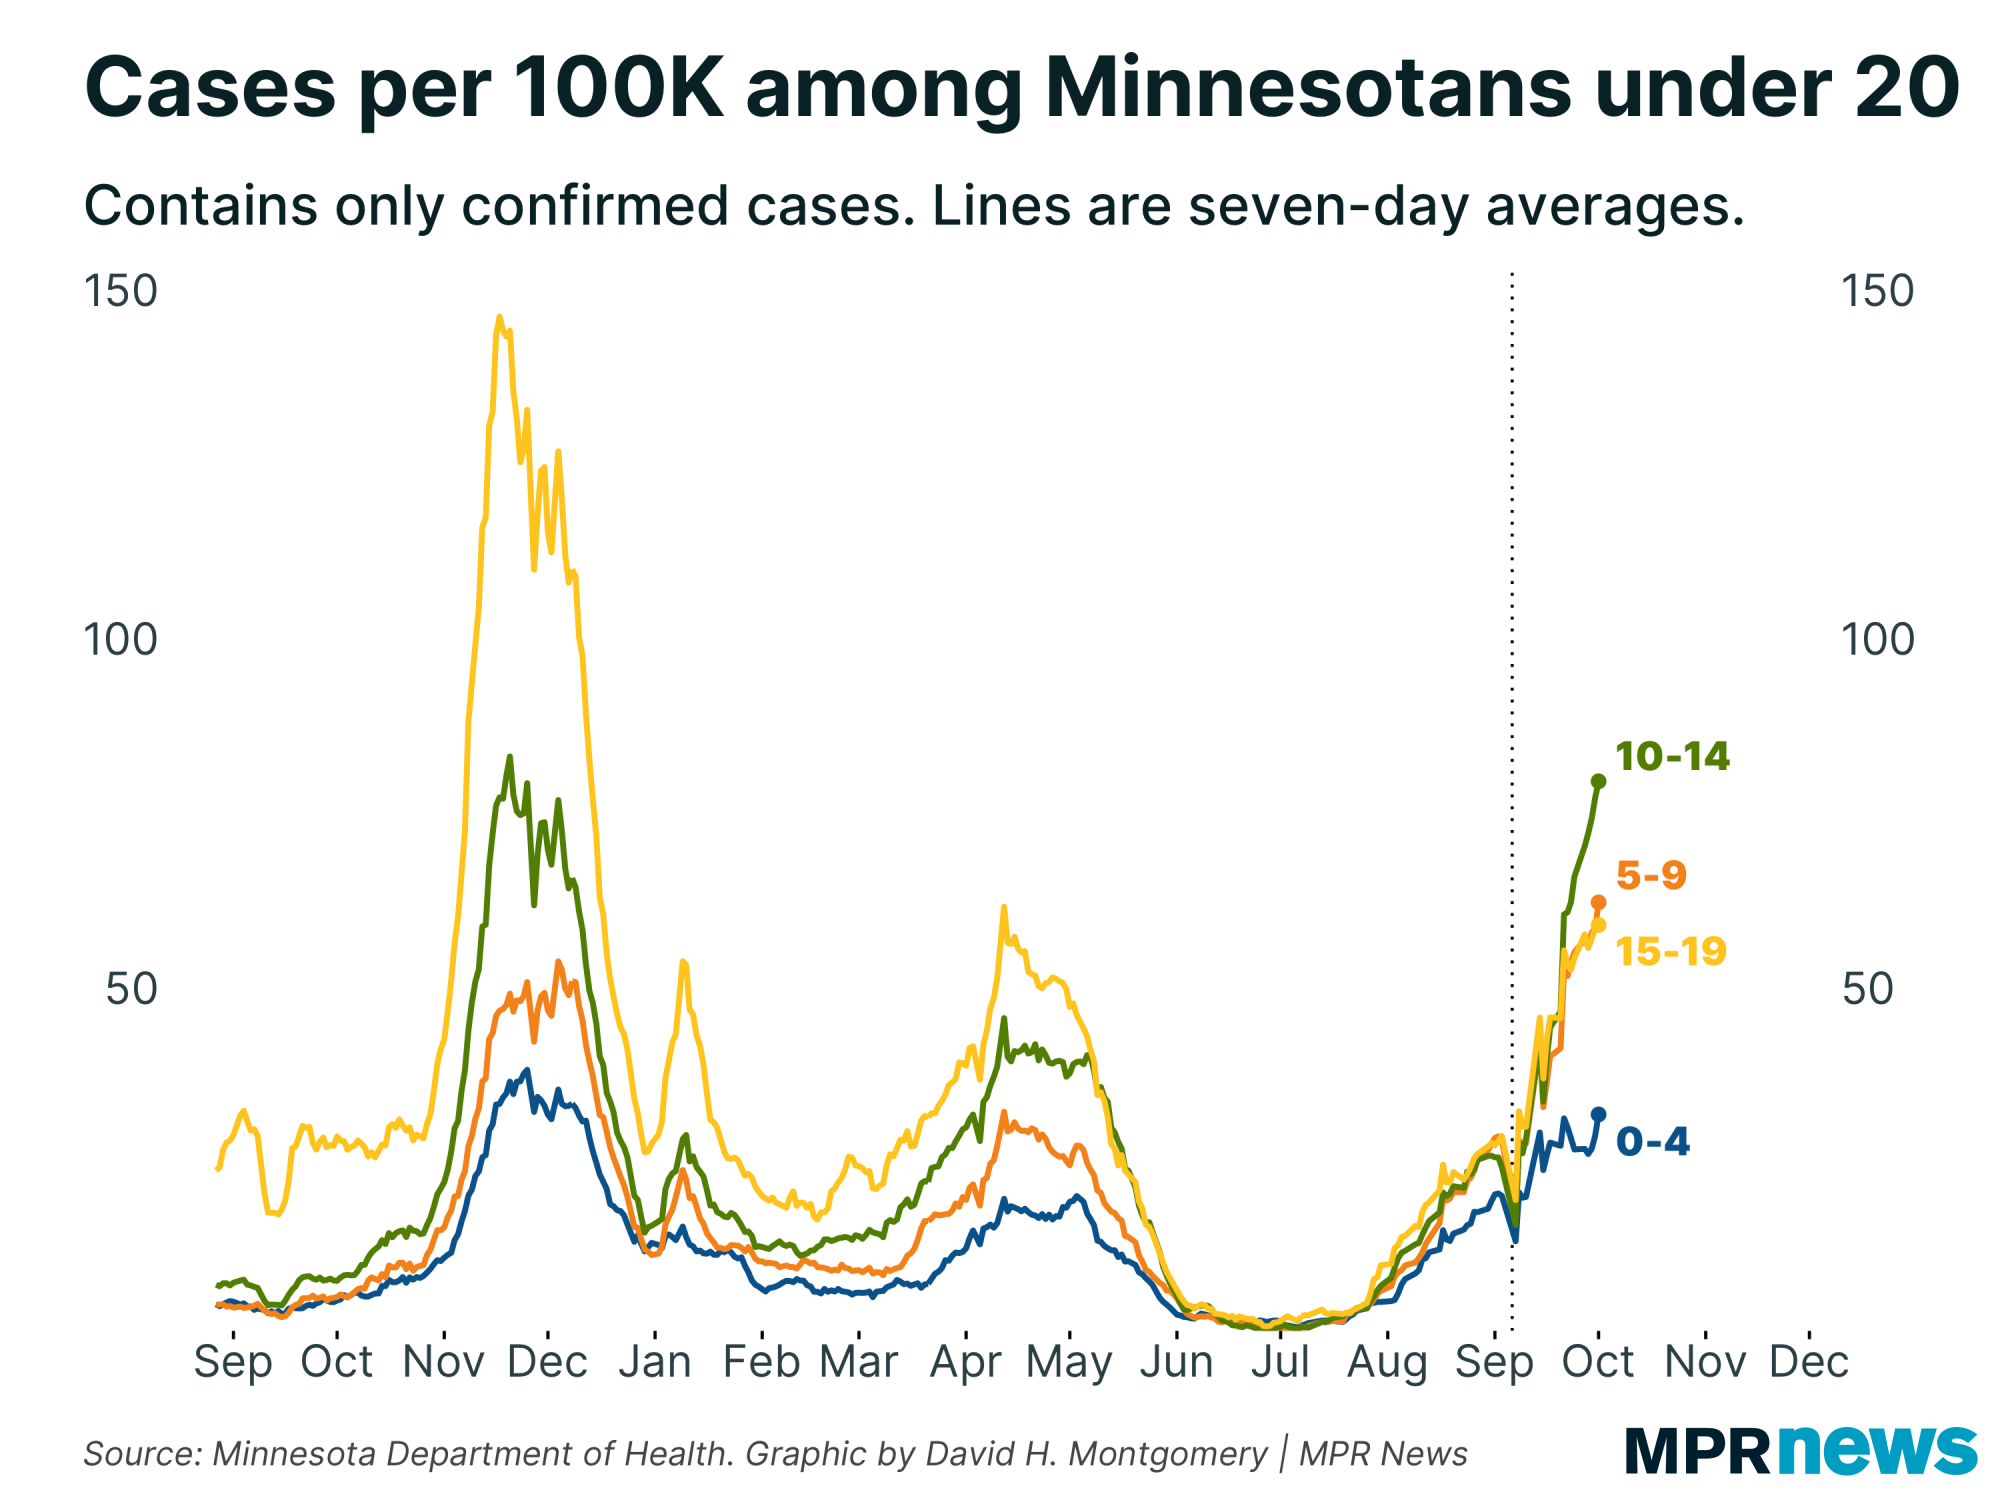
| If you dive in a little more granularly, by the way, the fastest case growth is among kids 10 to 14, followed by 15-19 and 5-9. Kids under 5 have by far the lowest rate of confirmed cases (which again is not the same thing as saying they have the lowest rate of infection). | |
|
|
|
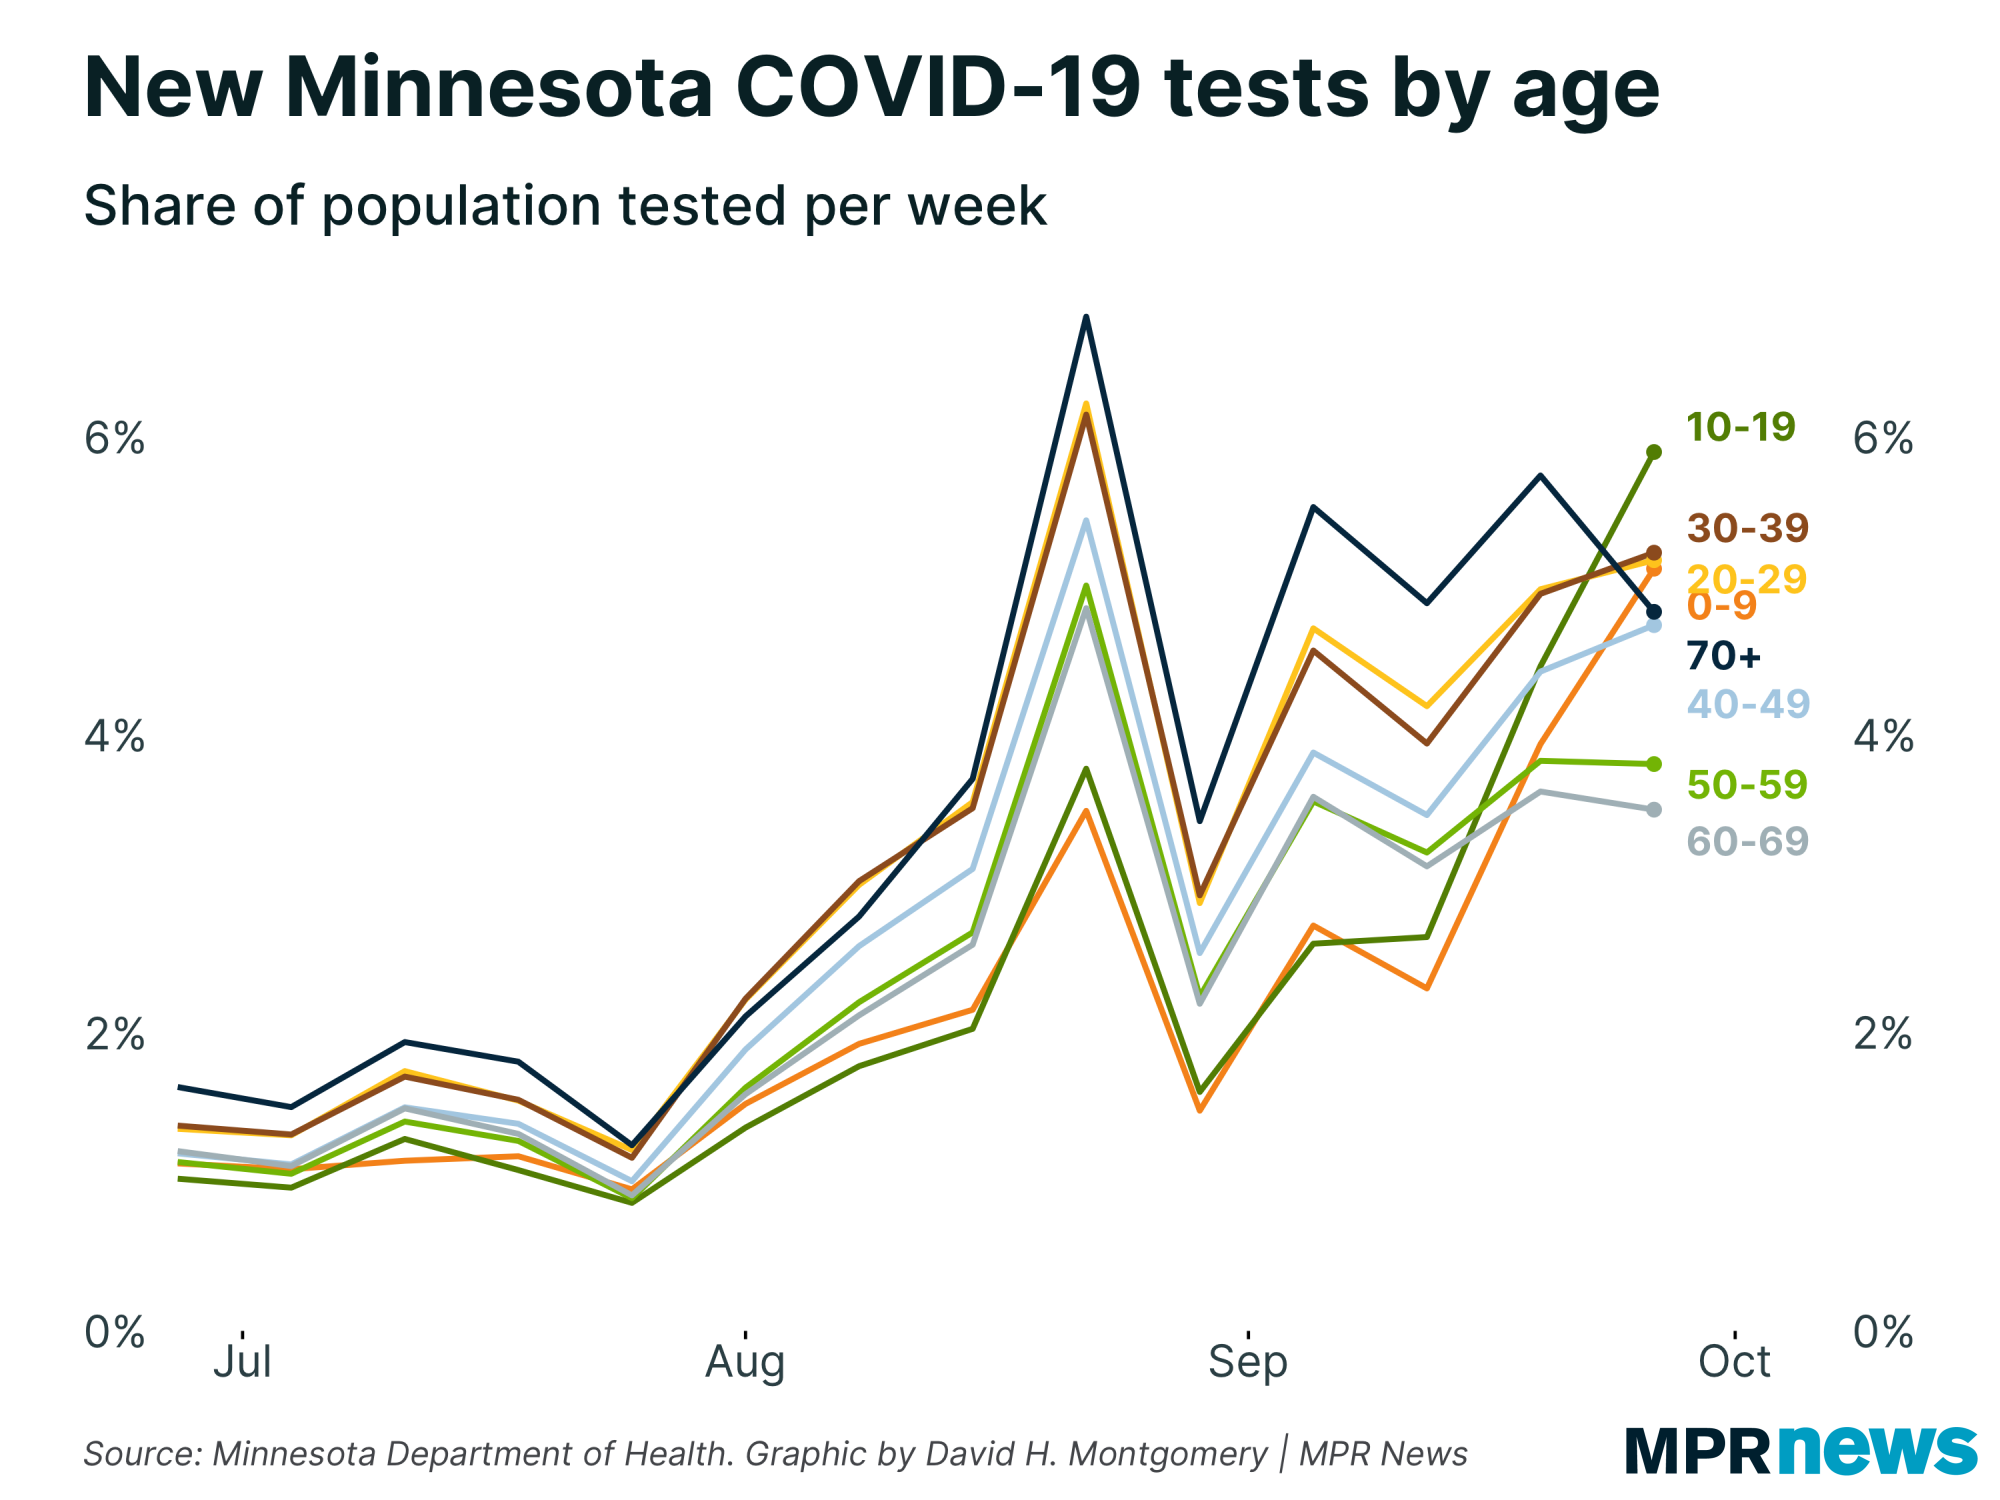
| But as I shared last week, while cases are up dramatically among kids, so are tests. Weʼre seeing about 6 percent of kids 10 to 19 getting tested per week, double the rate a few weeks ago. (These numbers might be slightly inflated if individuals are taking more than one test in a week.) Tests have also more than doubled among kids under 10. | |
|
|
|
| As a result, if you calculate positivity rate among kids, it's actually going down. | | |
|
|
Now I donʼt think that necessarily means infections arenʼt on the rise in this age group. But itʼs reason to not get hysterical over the sometimes eye-popping levels of new cases weʼre seeing among kids now. This is an age group thatʼs disproportionately likely to have cases with mild or no symptoms, so itʼs possible their rate of infection before school started was much higher than our case states would indicate, and now testing has caught up.
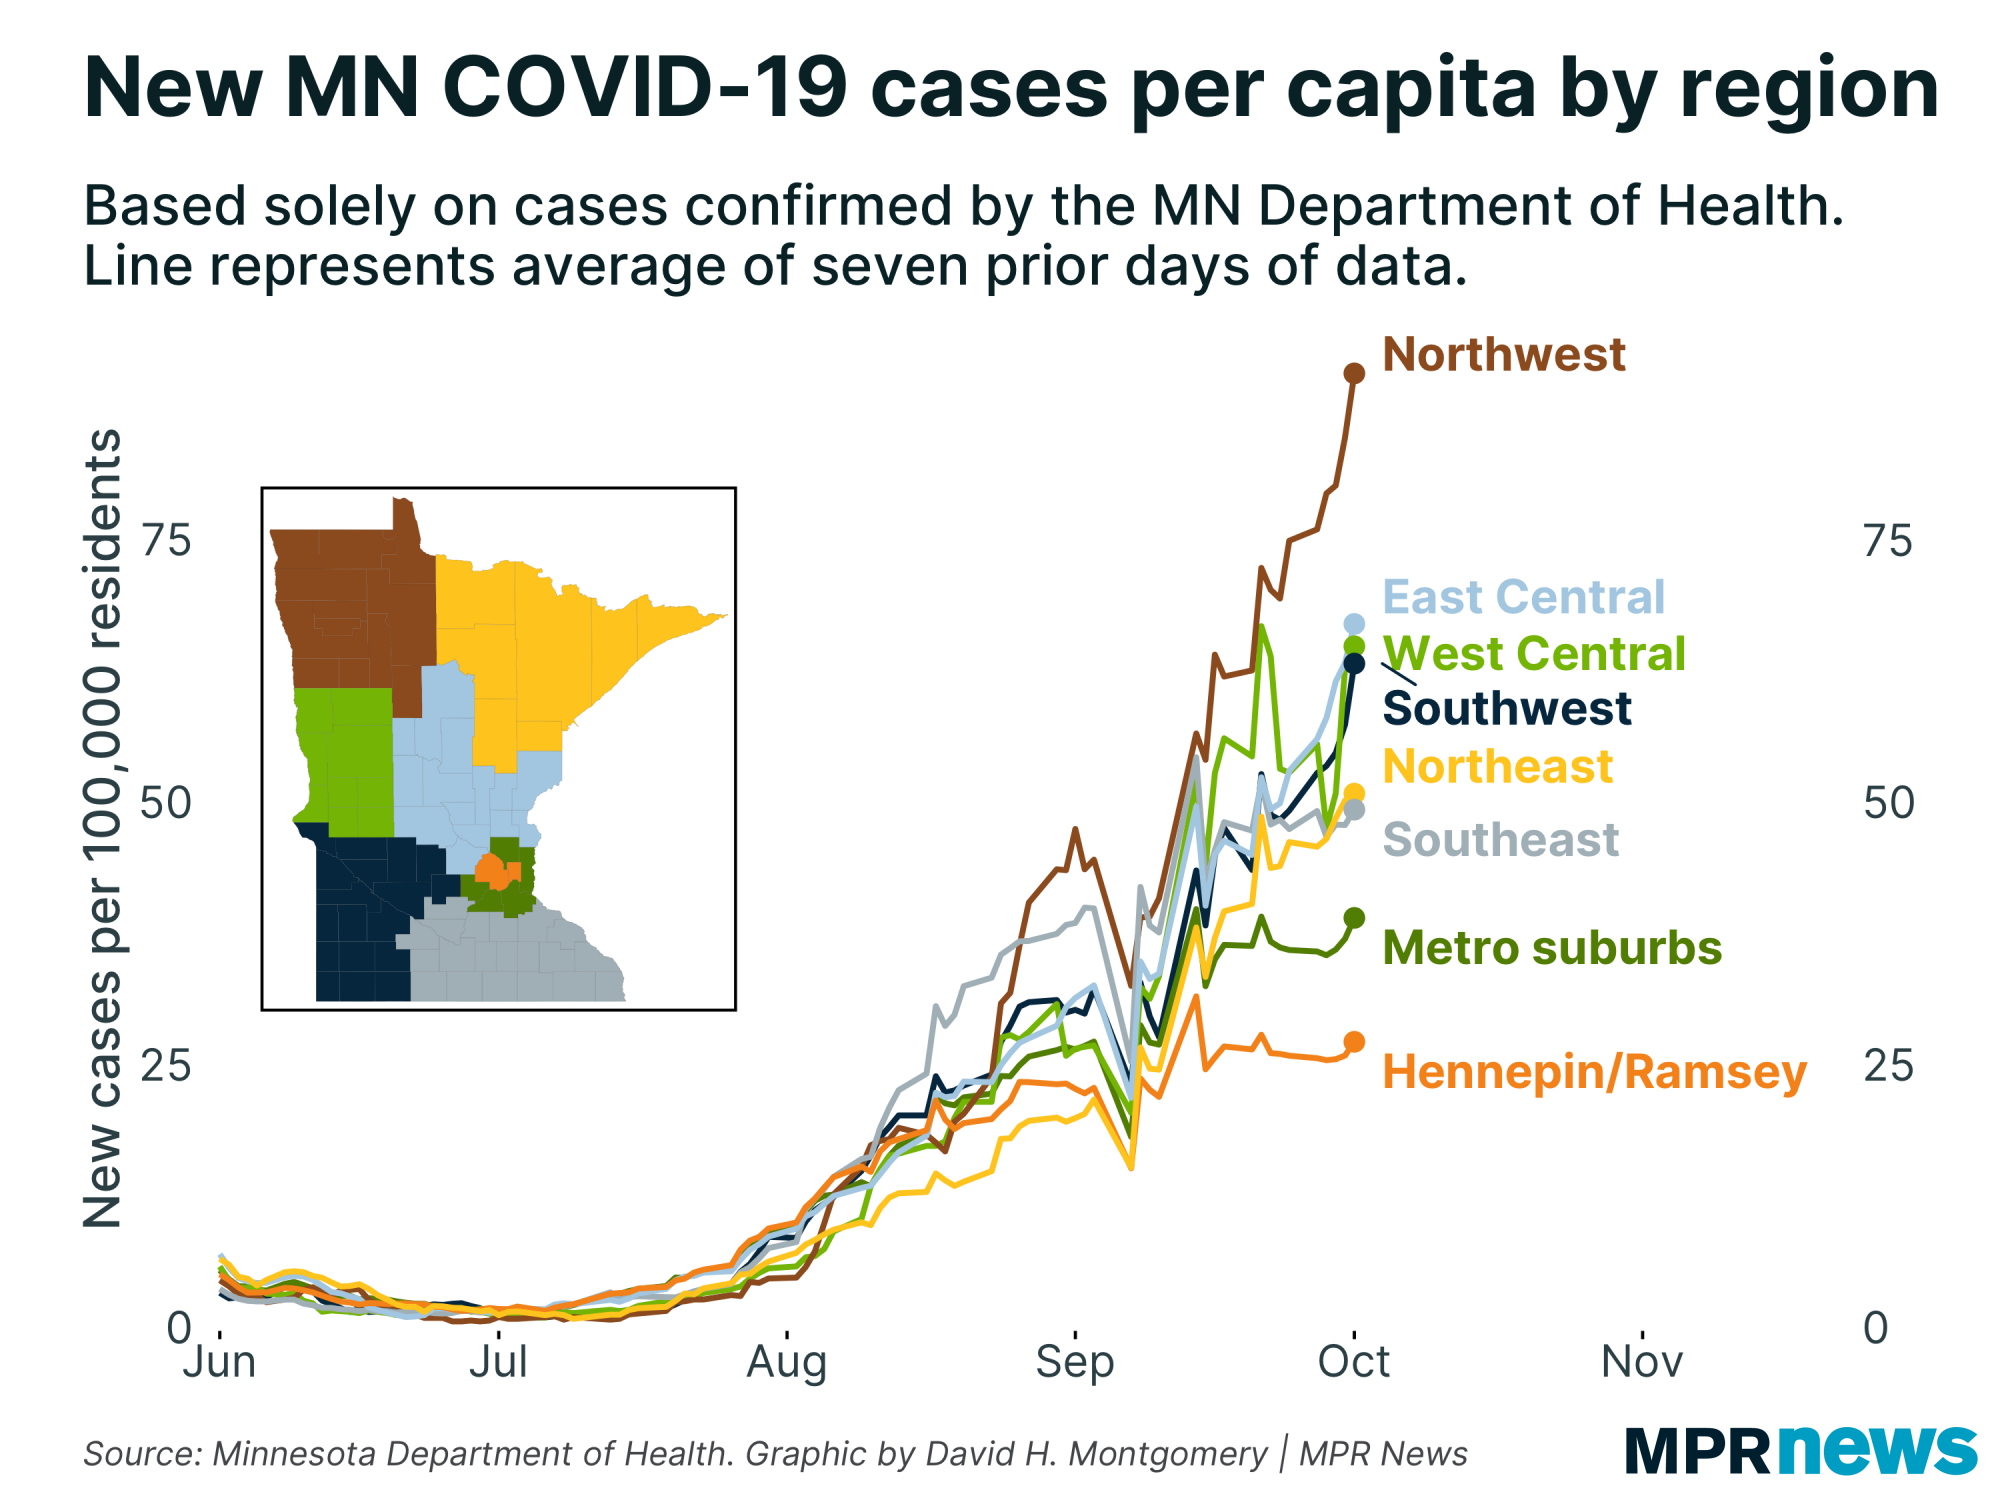
Geographically, cases continue to be pretty flat in the Twin Cities metro — both the core metro and the suburbs. Theyʼre also growing pretty slowly in
northeastern and southeastern Minnesota.
But the rest of the state is seeing fairly dramatic growth, especially the northwestern corner. |
| |
|
|
Below, I'll explore a few more stats about Minnesota's COVID-19 outbreak. If you want to learn more, I also recommend these other articles:
| | |
|
|
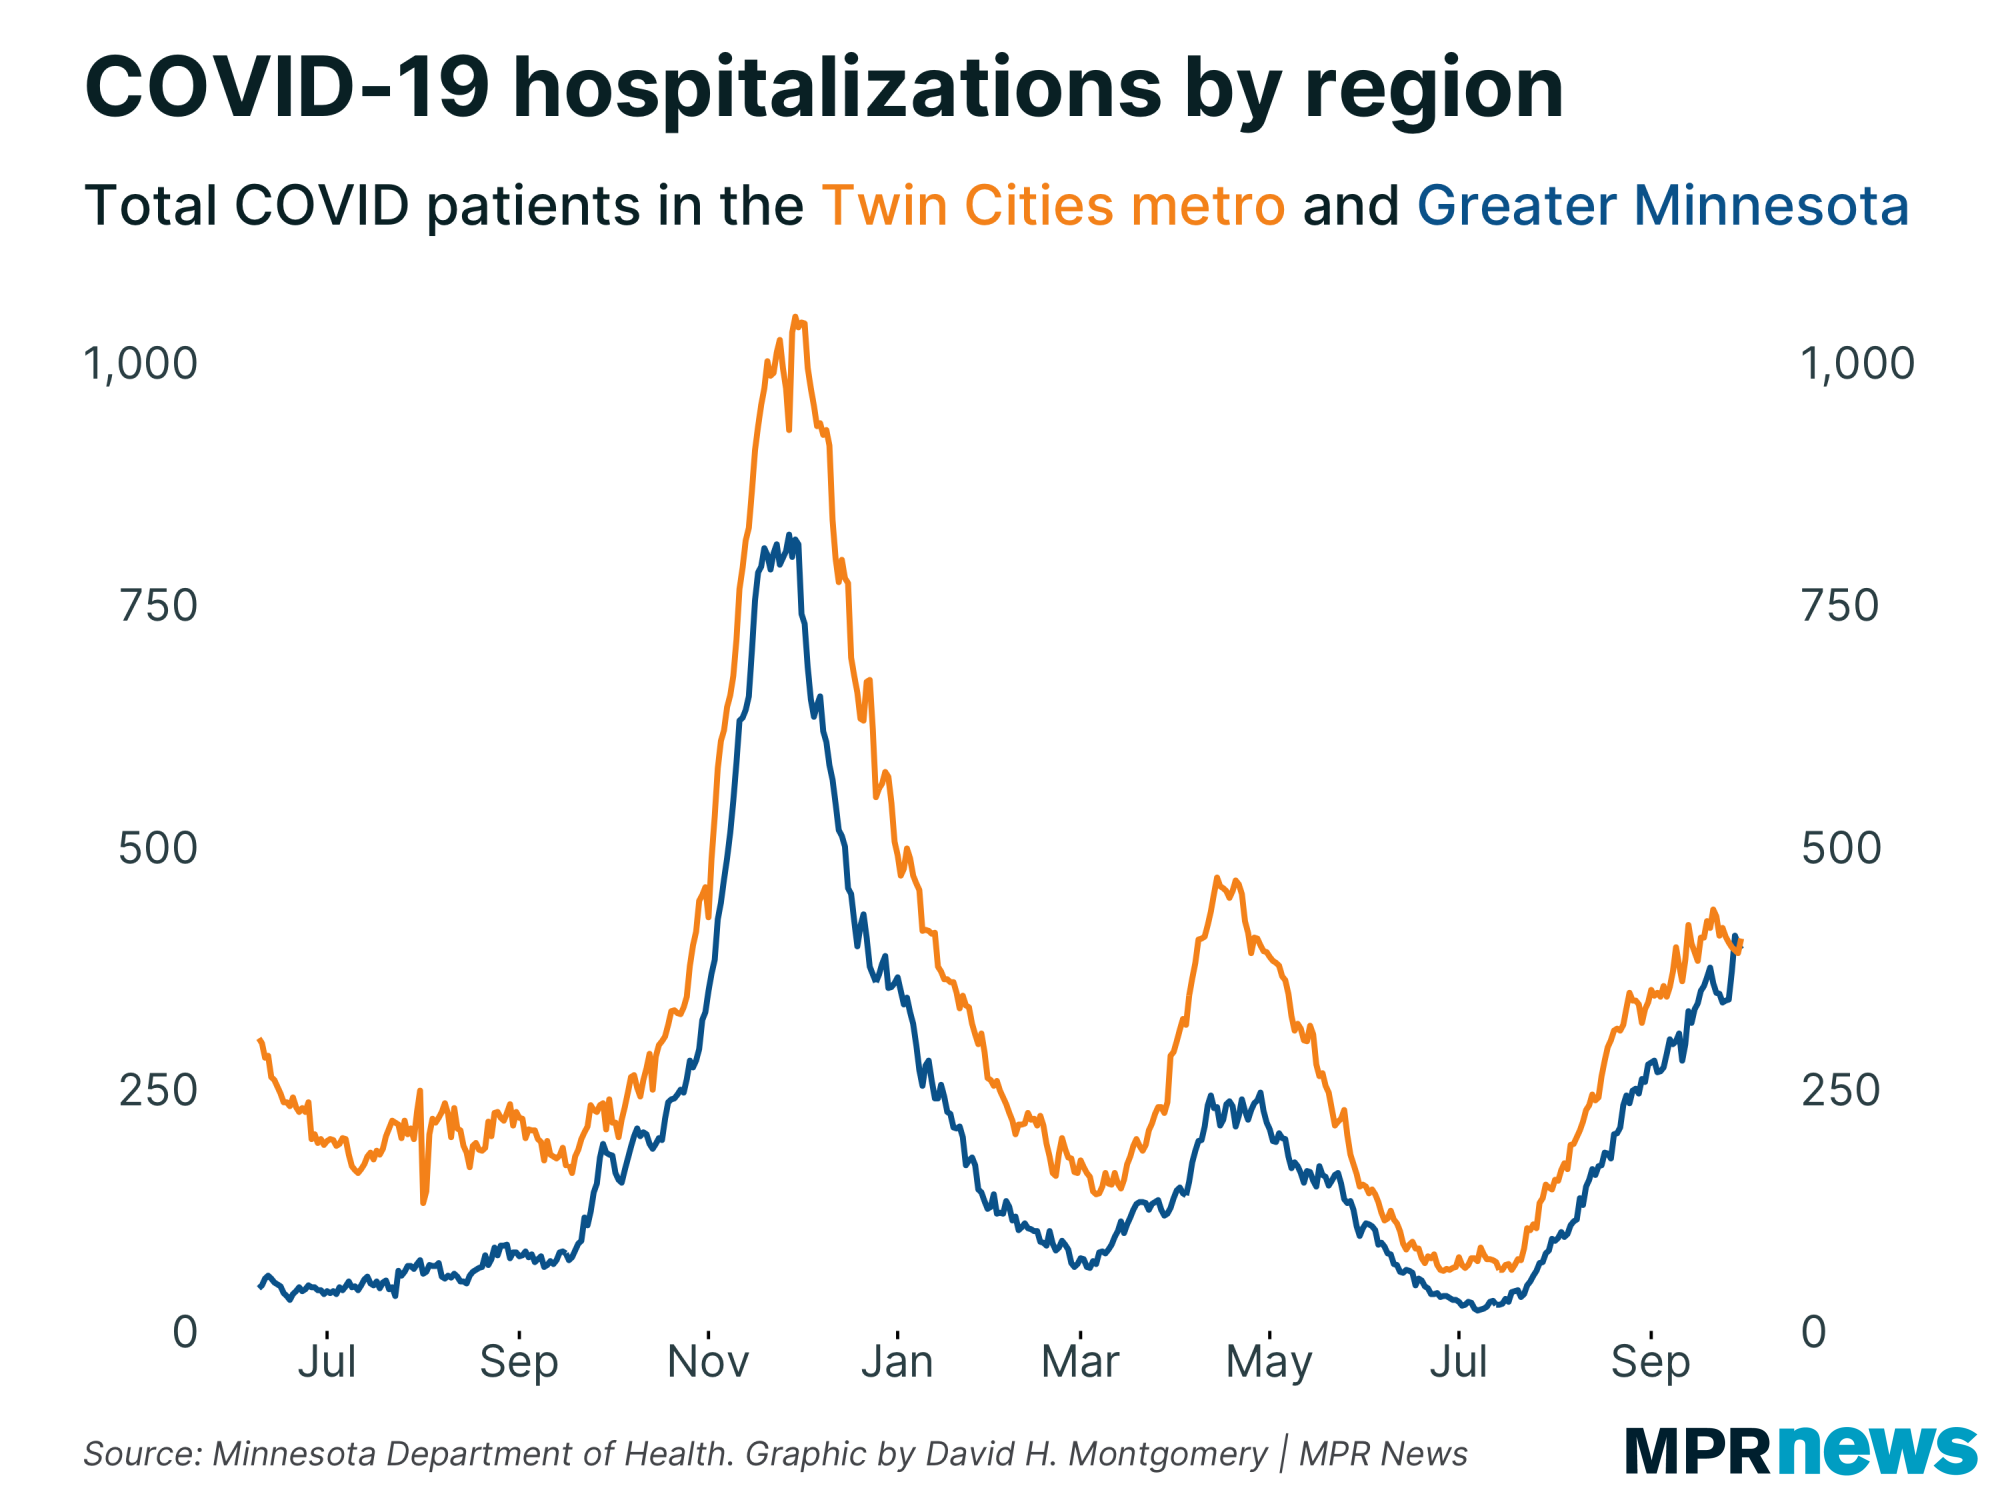
Cases, hospitalizations shift to Greater Minnesota
| Something very interesting happened this week: the number of COVID-19 patients hospitalized there exceeded the number of COVID patients in metro-area hospitals.
That had never happened before all pandemic (or at least the period for which we have data). |
| |
|
|
Note that this data is by where people are hospitalized, not by where theyʼre from. So someone who lives in Greater Minnesota who gets transported to a metro hospital would show up under the “metro” category here.
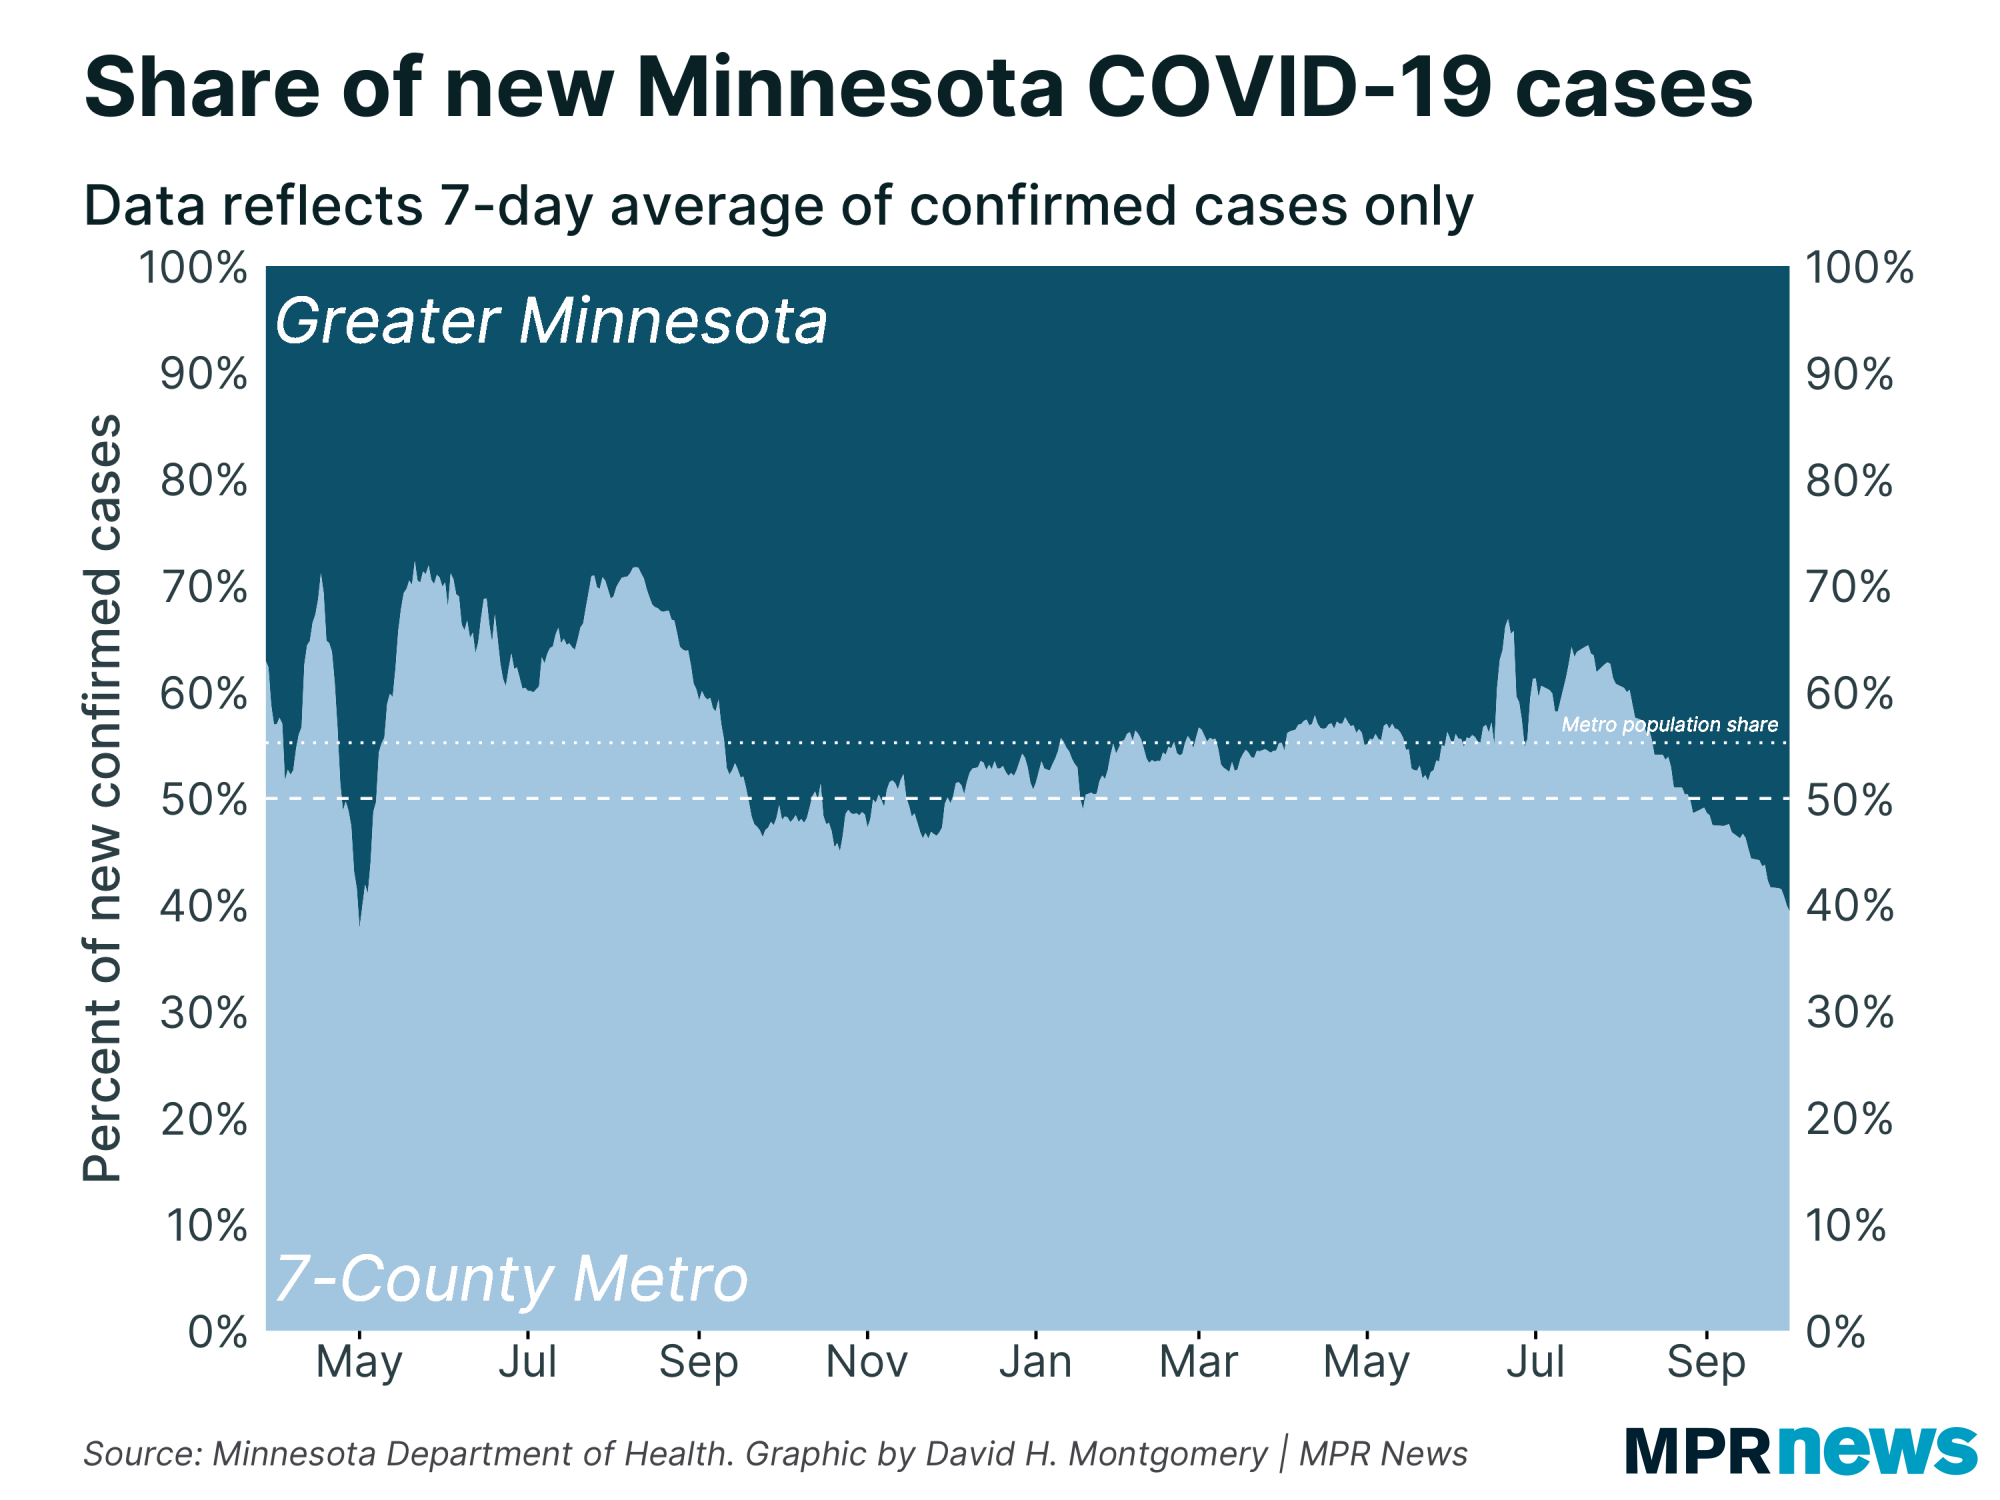
But even with this caveat, this novel development isnʼt completely shocking. The past month has seen a steady and almost unprecedented shift of Minnesotaʼs COVID-19 cases into Greater Minnesota.
Most of the outbreak has seen cases either split proportionately between the metro and Greater Minnesota, or disproportionately focused on the metro. That is no longer the case, and (unlike a brief spike near the end of April) does not appear to be a fluke. |
| |
|
|
Deaths rising, though still below 2020 peaks
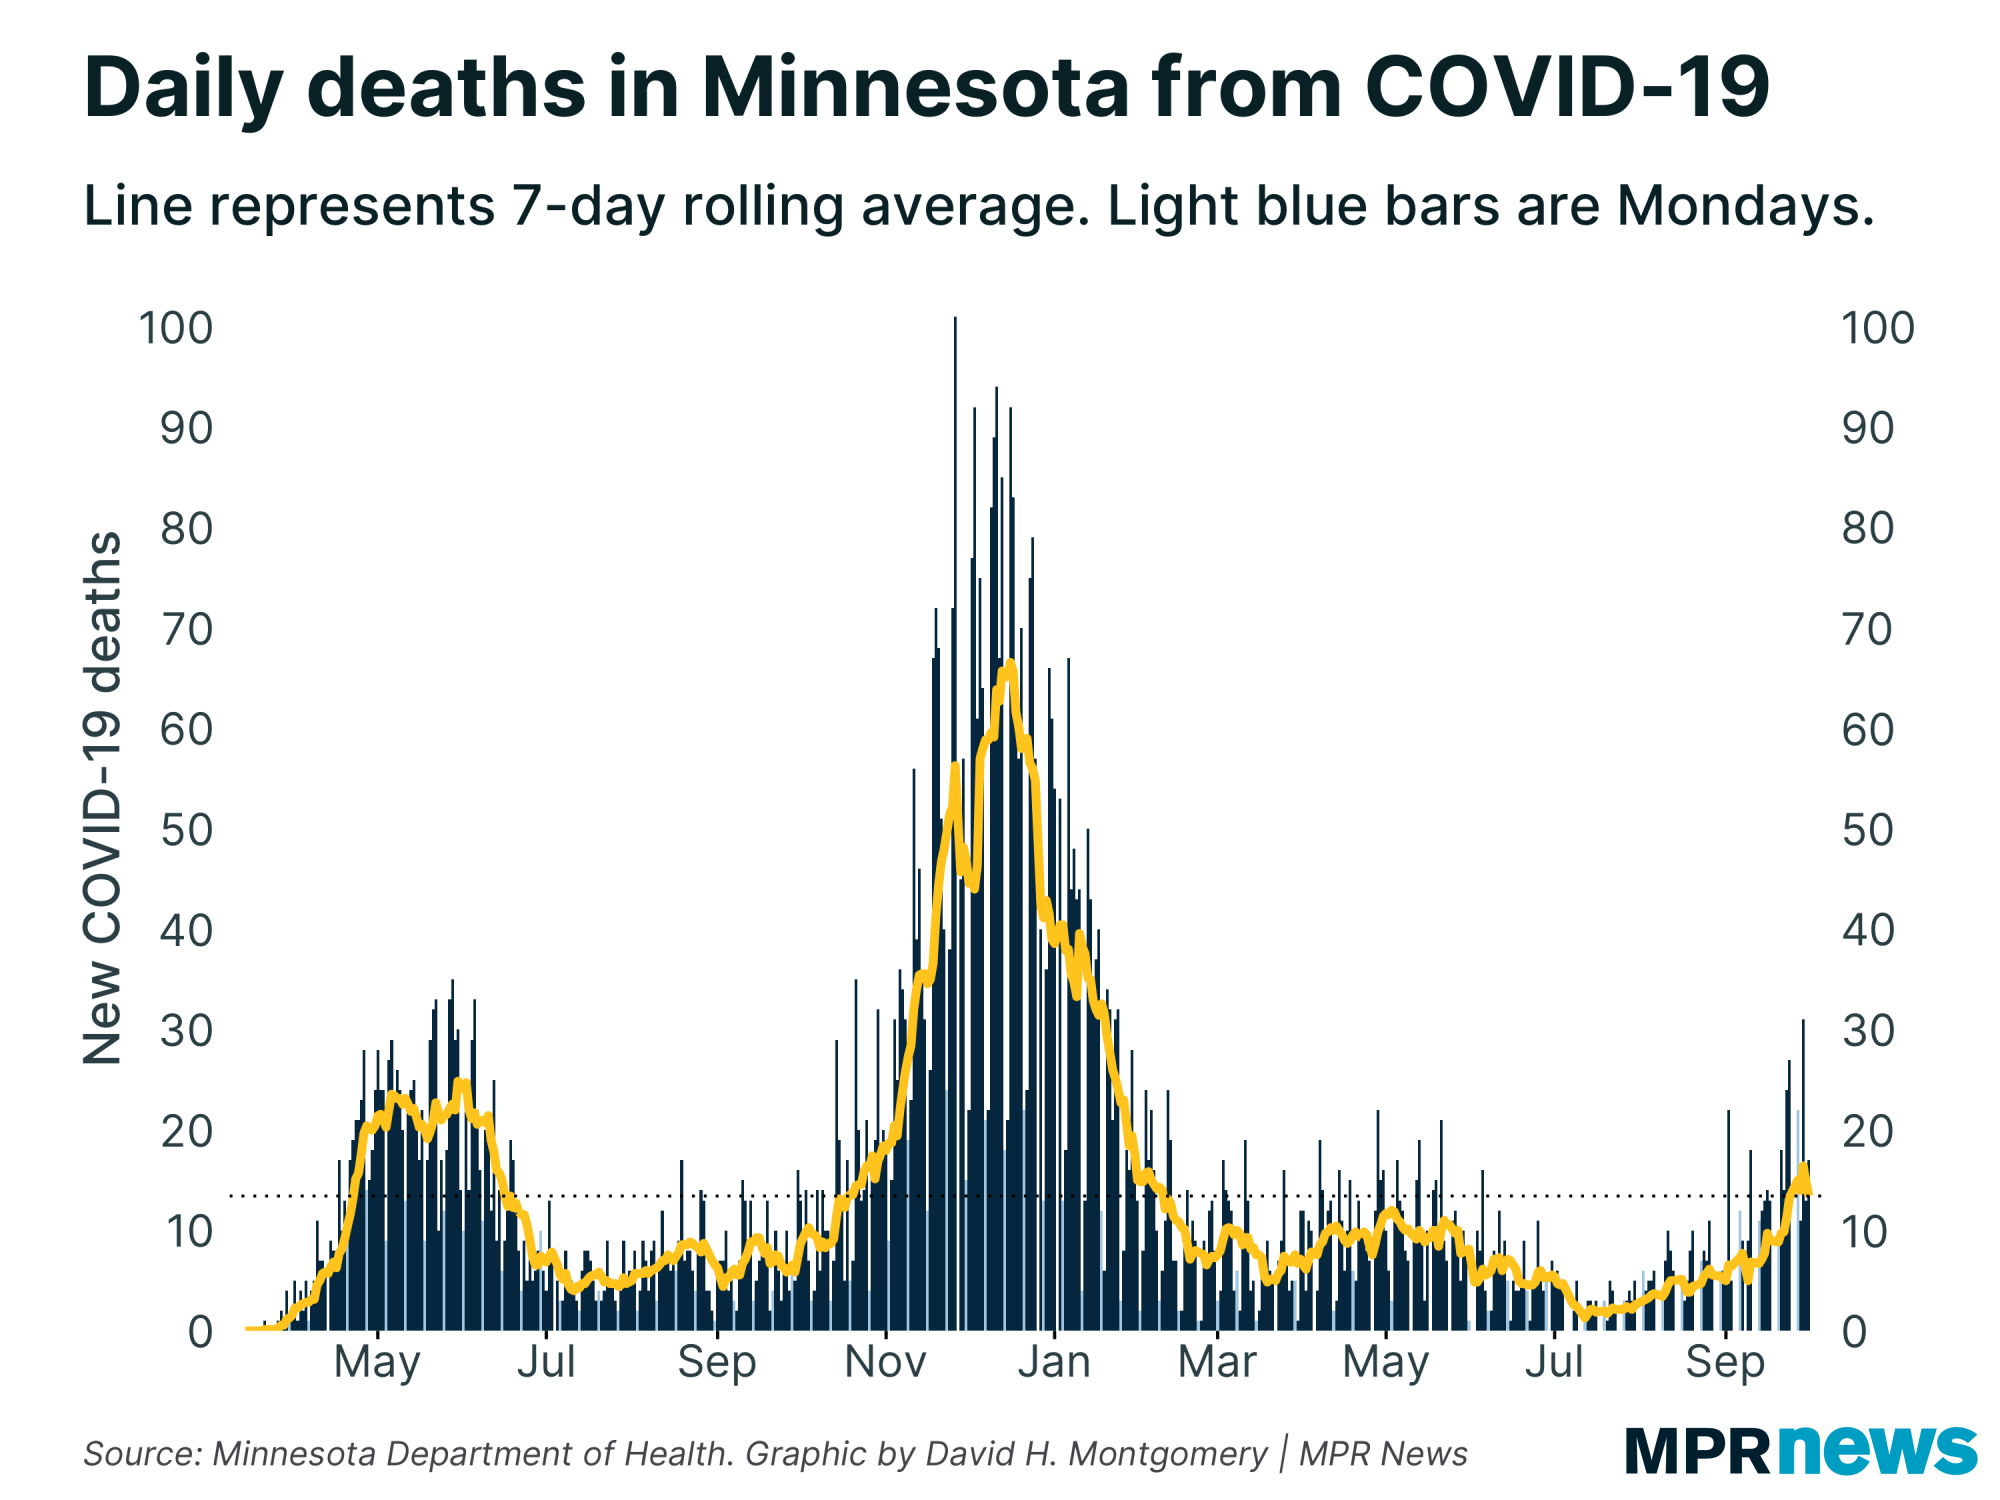
| | Over the past week or so, Minnesota finally surpassed its COVID-19 death rate from the Spring 2021 wave. Weʼre still below the death rates seen in 2020ʼs waves, but weʼre still averaging 13 to 16 COVID-19 deaths per day. |
| |
|
|
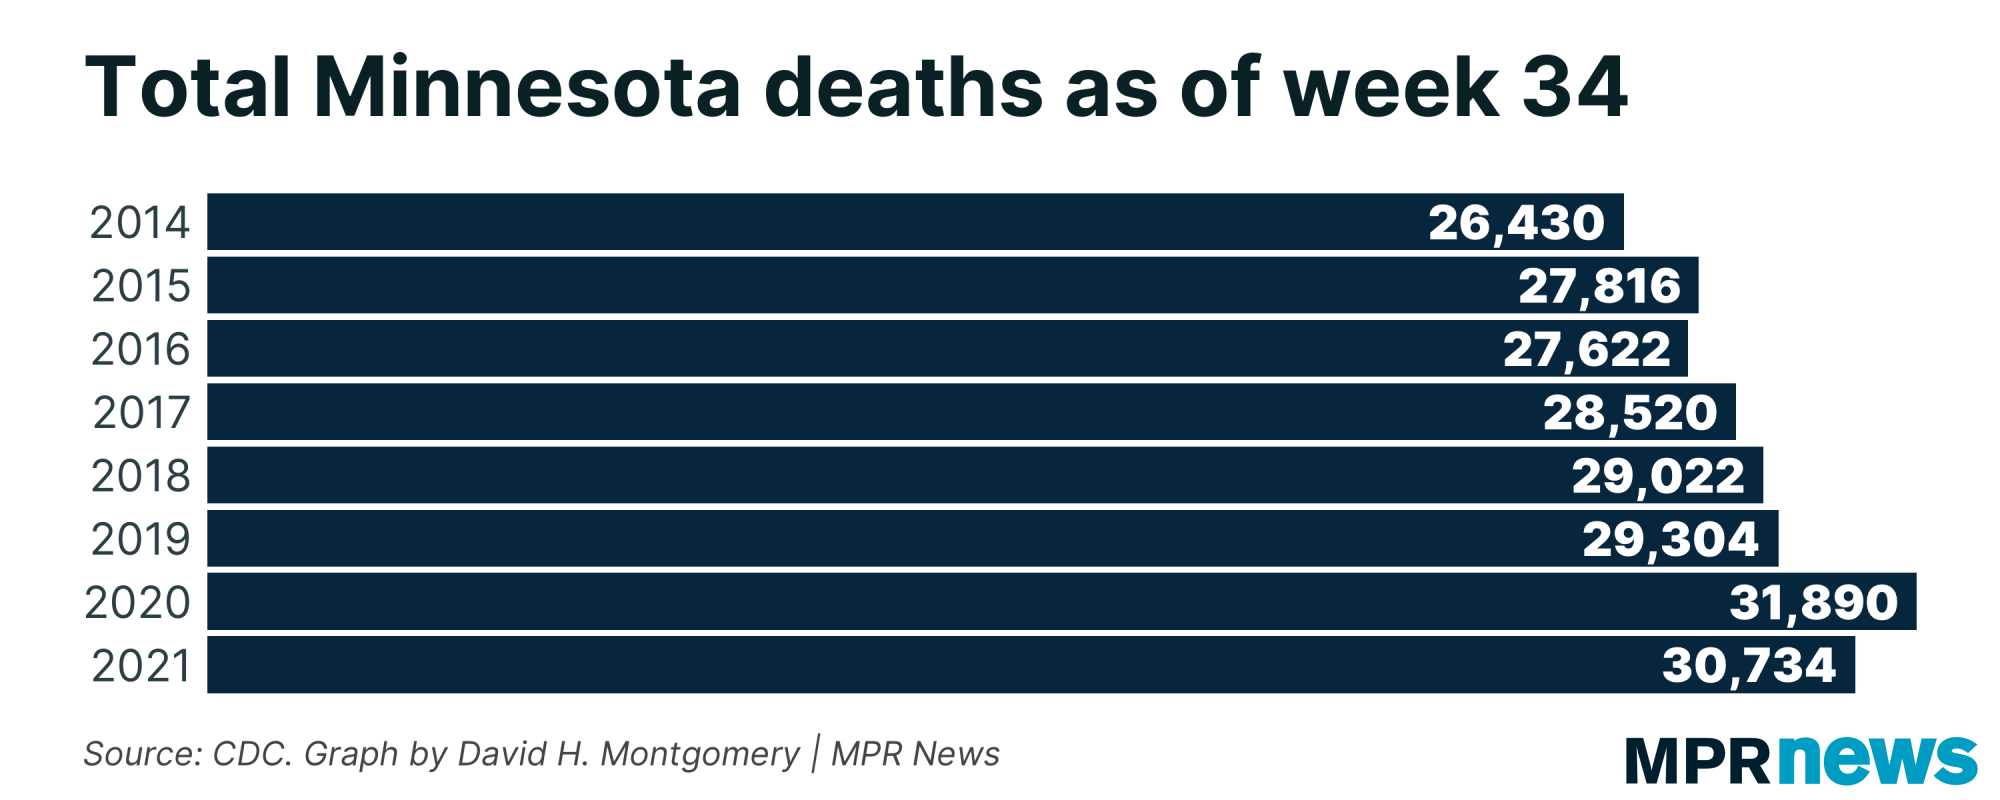
| Letʼs zoom out a bit, though. Through late August this year, Minnesota has reported 30,734 total deaths from all causes in 2021. Thatʼs more than 1,000 deaths fewer than weʼd seen at this time last year, but 1,400 more than by this time in 2019 (the prior high). | |
|
|
|
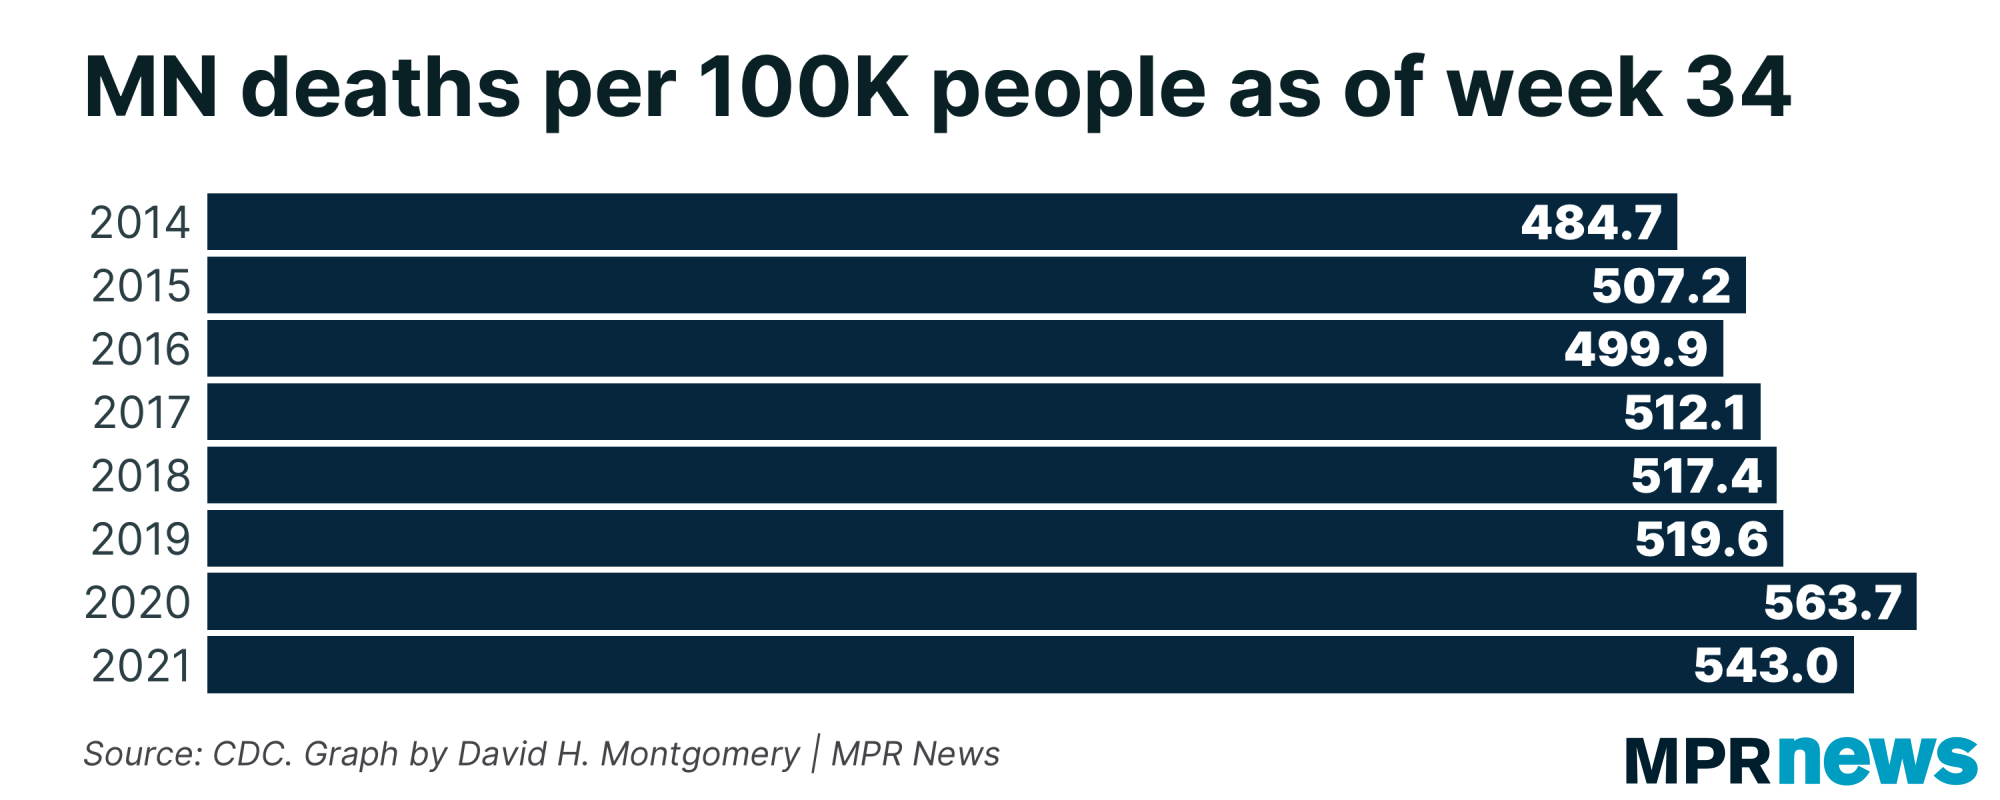
| This holds true if you adjust for population growth, too. Deaths are elevated this year, but not nearly as bad as the truly deadly 2020. | | |
|
|
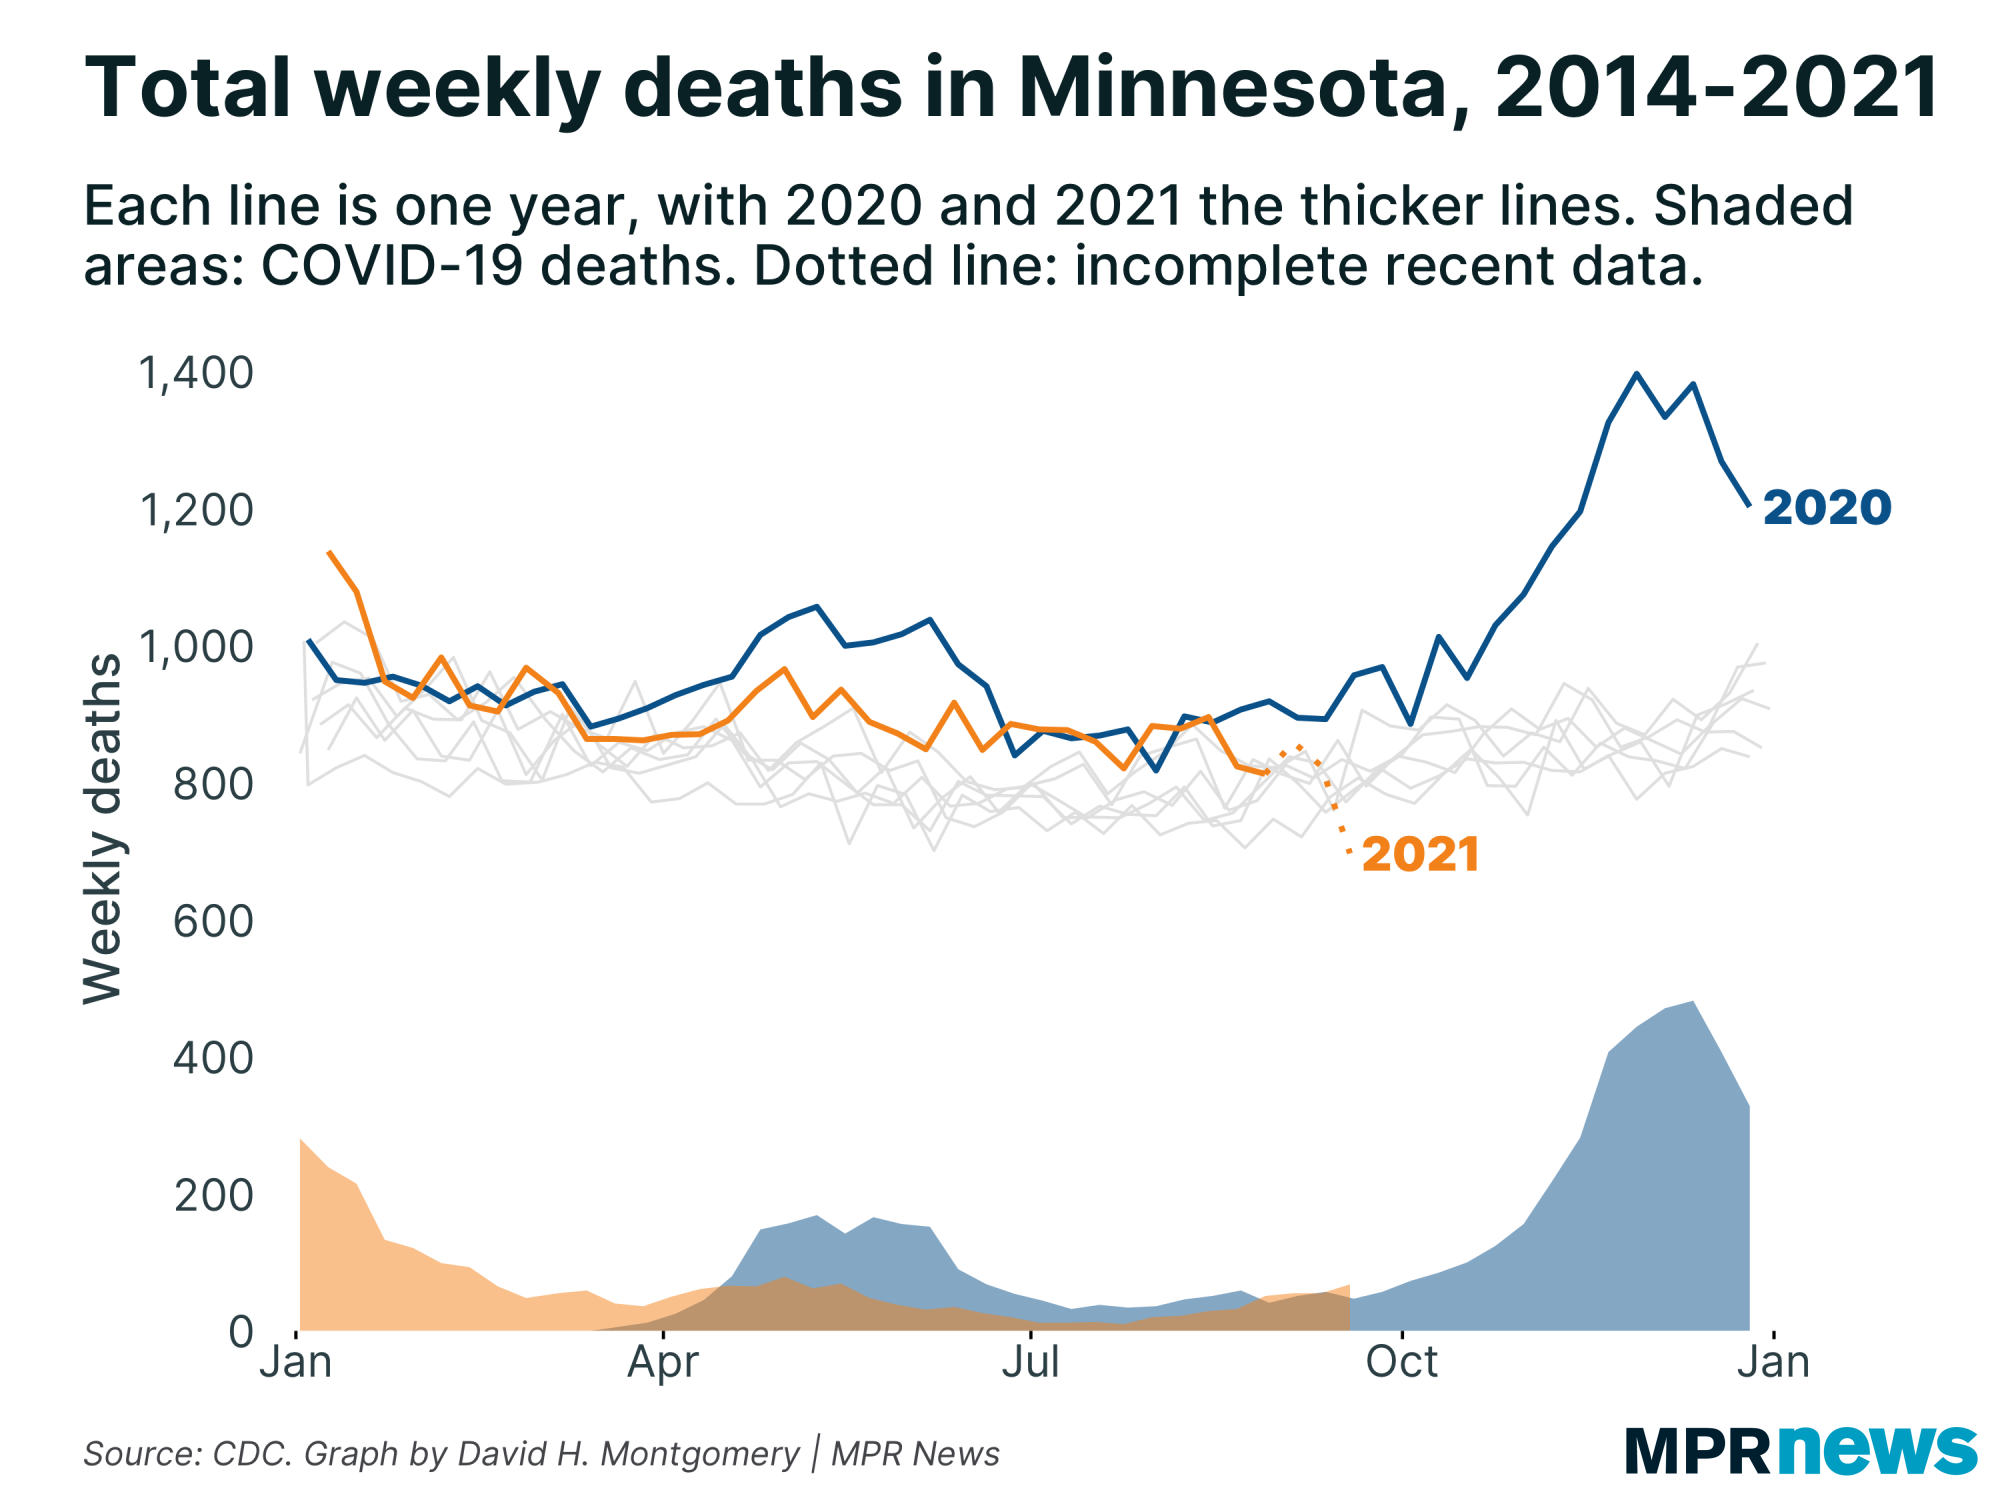
| As Iʼve shared before, when you plot out these total, all-cause deaths, they match up nearly perfectly with periods of reported COVID-19 deaths. This is the single, most incontrovertible fact about the COVID-19 pandemic — it caused a major spike in U.S. mortality. Believe whatever you want about case counts, hospitalizations, and other metrics — mortality is up because of COVID, and itʼs not just a numbers trick. |
| |
|
|
While 2020 was exceptionally deadly, 2021 so far is merely somewhat more deadly for Minnesotans. For most of 2021 huge proportions of the most vulnerable Minnesotans have been vaccinated against COVID-19, and by all indications this has had a major impact.
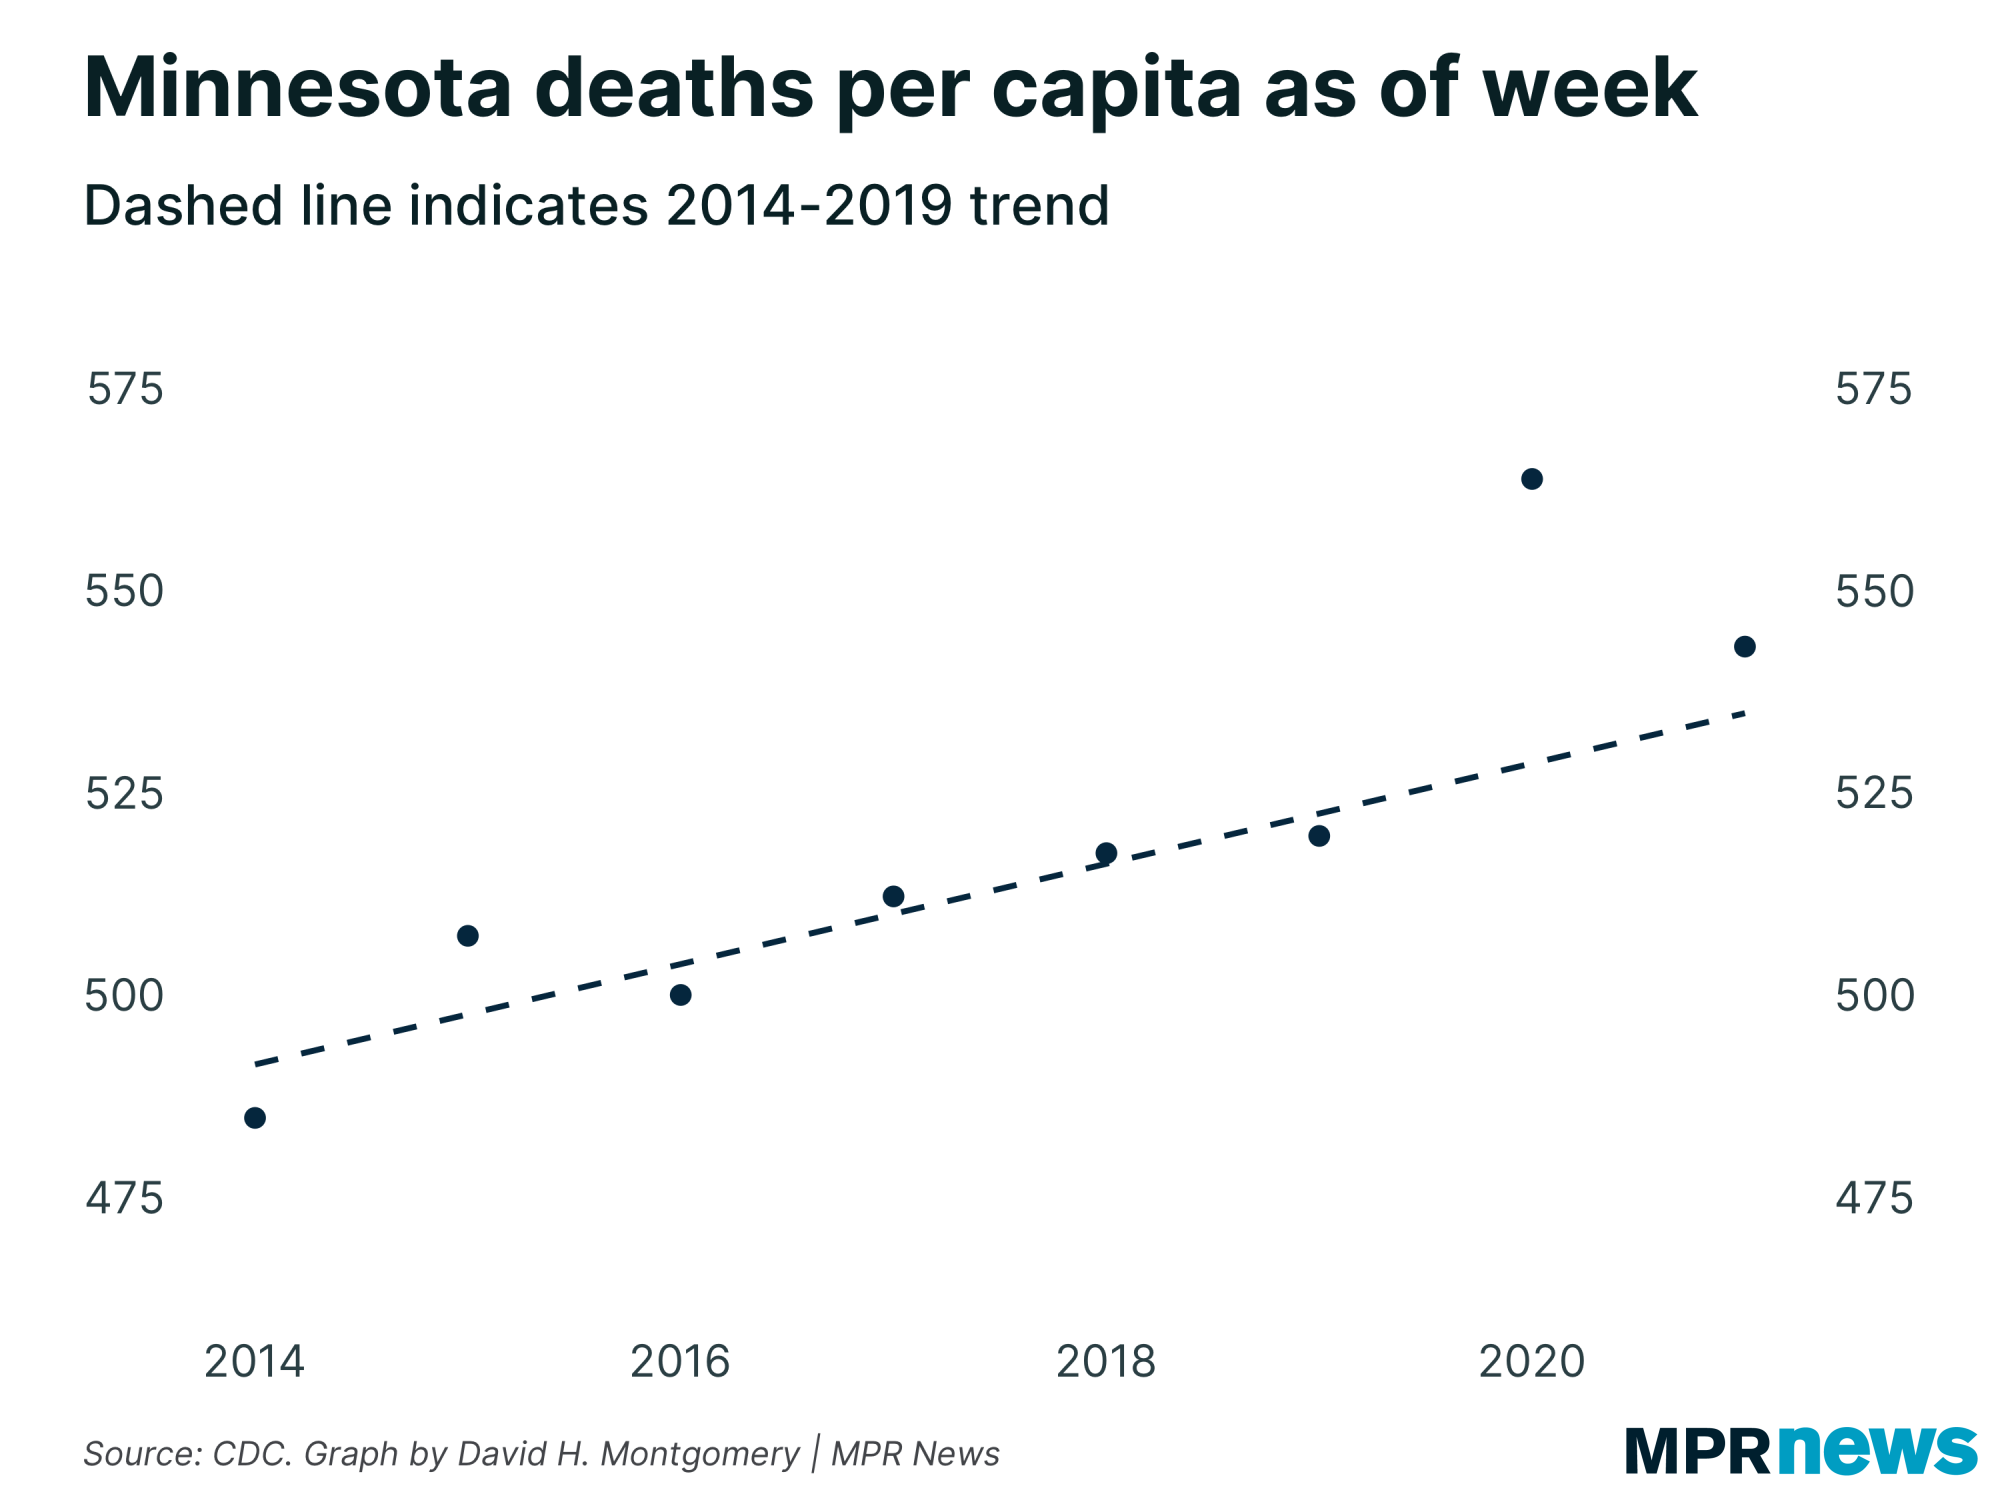
If you plot out the pre-2020 trendline of Minnesotaʼs annual deaths per capita, 2021 is above-average, but not a bizarre outlier like 2020 was. |
| |
|
|
| (This also pushes back to a degree against the theory that COVID-19 was merely shifting deaths, killing old or sick people a few months earlier than theyʼd have otherwise died. Thereʼs no evidence yet of a compensatory dip in mortality.) | | |
|
|
What's happening next?
|
Next week I hope to try to sort out whatʼs happening in the subgroups where COVID-19 isnʼt booming — the Twin Cities metro, older adults, etc.
Thanks for subscribing to this newsletter and for all of you who've sent me your feedback. As always, if you like this newsletter, please share it and the sign-up link with others who you think might enjoy it.
— David |
| |
|
|
Preference Center ❘ Unsubscribe You received this email because you subscribed or it was sent to you by a friend. This email was sent by: %%Member_Busname%%
%%Member_Addr%% %%Member_City%%, %%Member_State%%, %%Member_PostalCode%%
  |
|
|
| | |