%%[ SET @ViewURL = view_email_url
SET @ListID = ListID SET @SubChecker = _subscriberkey SET @EmailName = EmailName_ if @SubChecker == "ask@mpr.org" then insertde('ENT.newsletter_archive_2','VAWPURL',@ViewURL,'SubscriberKey',
@SubChecker,'EmailName',@EmailName,'Date',NOW(),'ListID',@ListID) ELSE endif ]%% |
%%[ if _MessageContext != "VAWP" then ]%% %%[ endif ]%% |
| Welcome back to COVID in Minnesota TODAY, an email newsletter from MPR News about understanding the latest developments in Minnesota's COVID-19 outbreak. | | |
|
|
We can see the light at the end of the tunnel, and it smells like poop.
While Minnesota's COVID-19 case data remains hopelessly snarled in days- or even weekslong delays, the wastewater analysis from the Met Council that I unveiled last week is much more current.
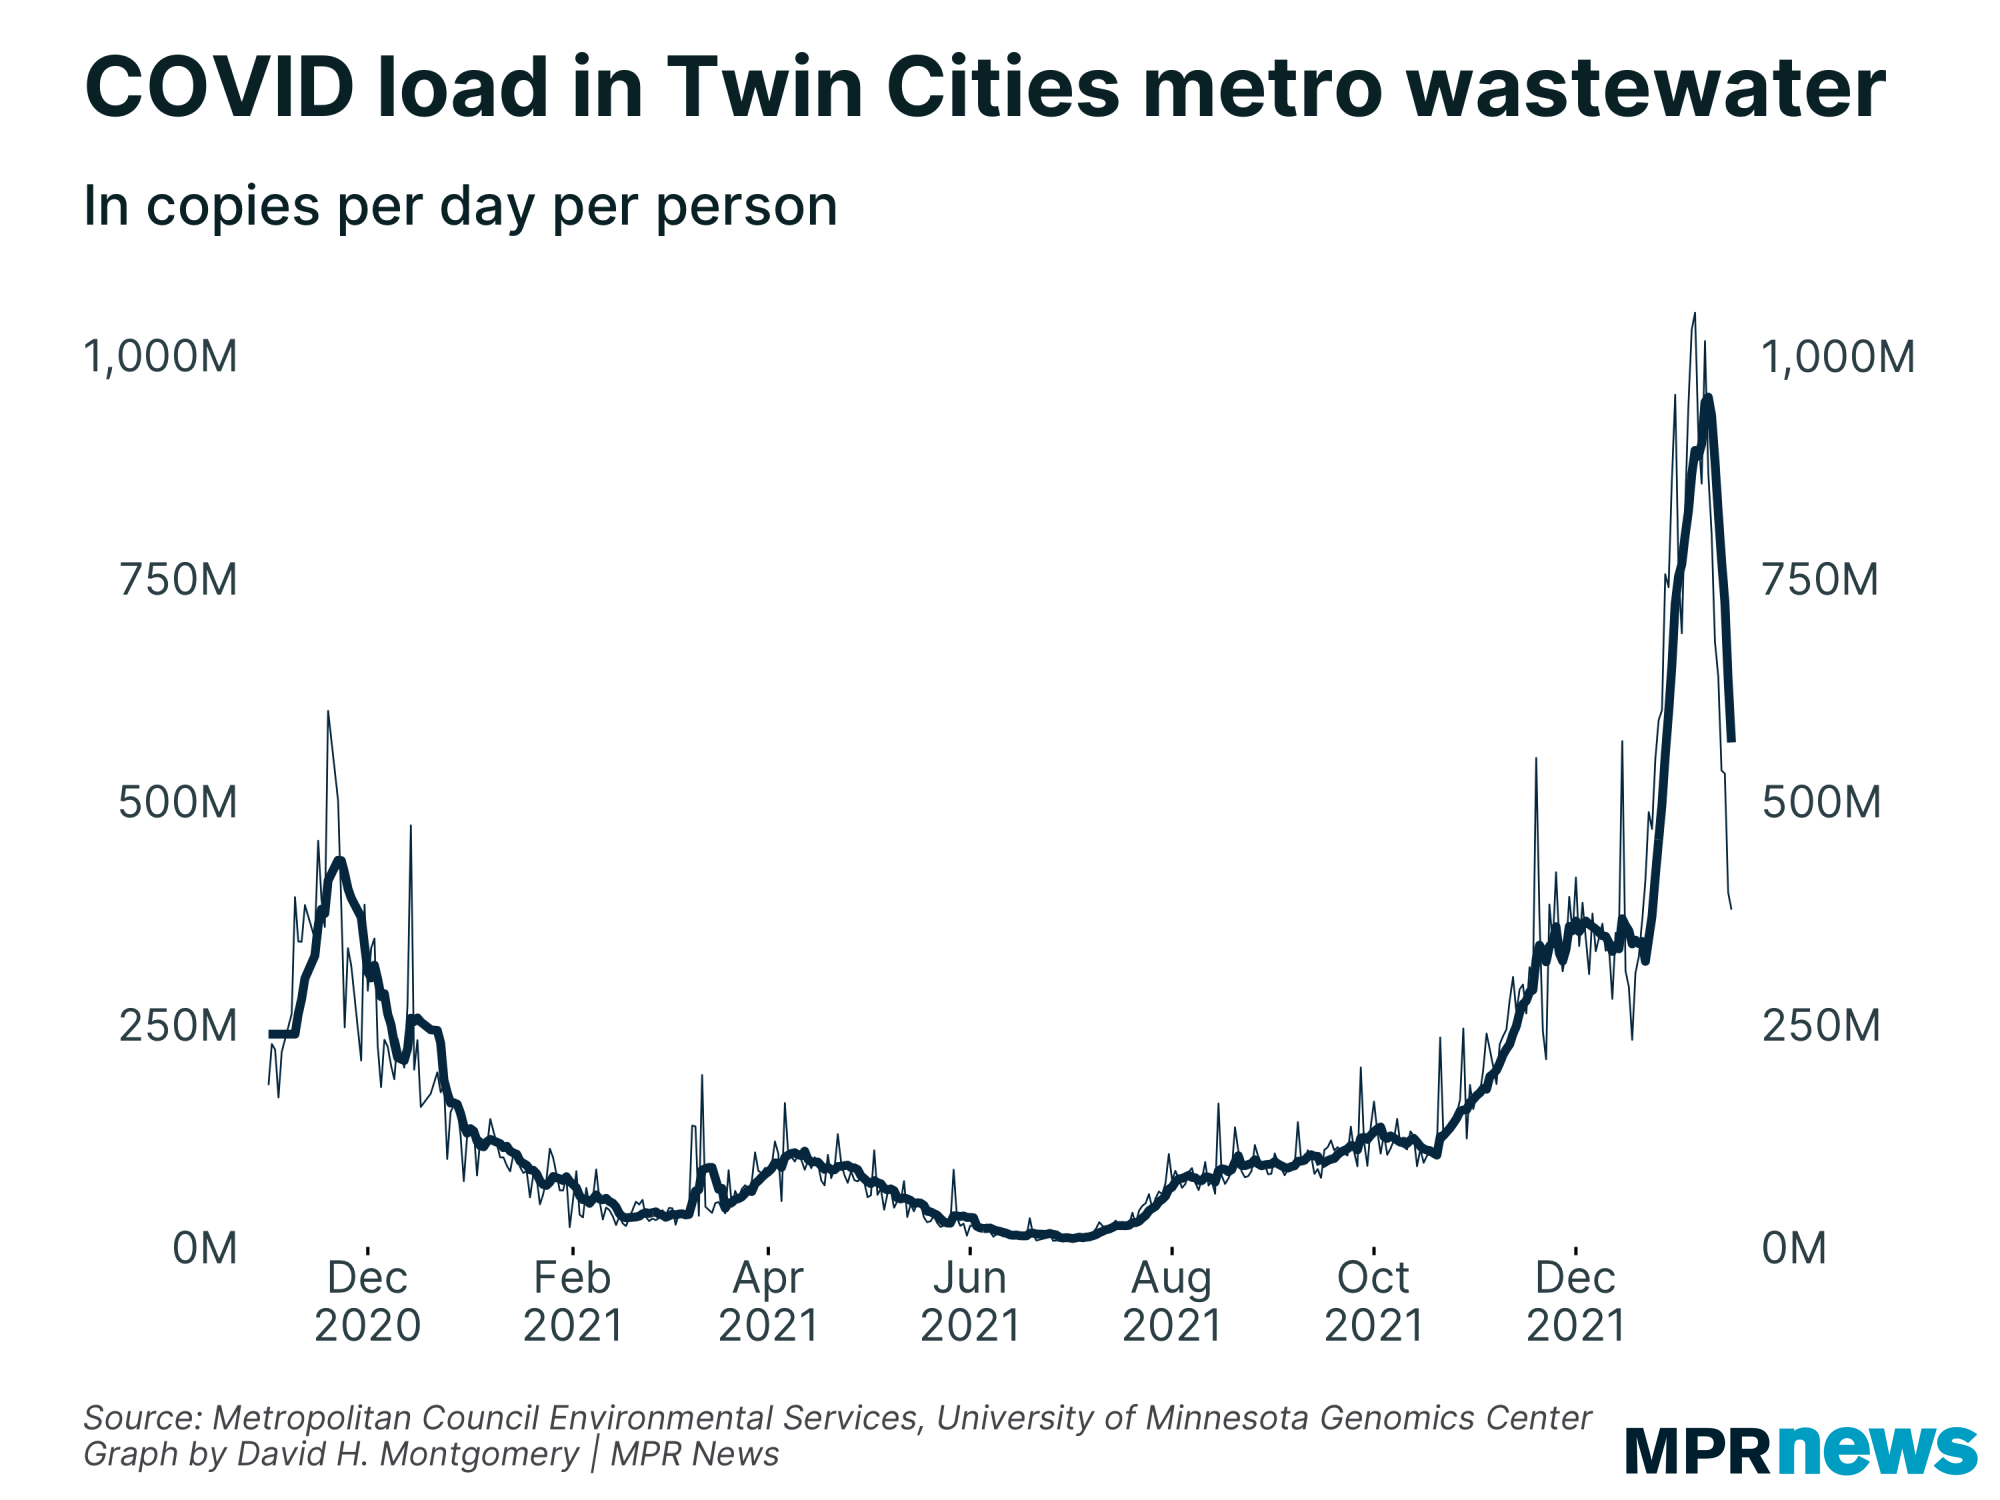
And this wastewater data has very good news. COVID concentrations in Twin Cities wastewater started falling steadily on Jan. 10, and have continued falling through the most recent data on Jan. 17.
This drop — in line with quick peaks seen in other places — inspires hope that we'll soon see other metrics like cases and hospitalizations fall, too.
More below. |
| |
|
|
Three things to know
| - Wastewater analysis in the Twin Cities suggests the omicron surge here has already peaked
- More traditional COVID-19 metrics like case counts continue to be severely lagged
- Even hospital admission data is lagging now by nearly a week
|
| |
|
|
| Let's jump straight to the chart you all want to see: the drop in COVID levels in Twin Cities poop. | | |
|
|
Now, this load remains pretty high — on par with where we were at the peaks of the fall 2020 and fall 2021 waves. But it's headed in the right direction, and falling as quickly as it rose.
The big question we'll hopefully get a grasp on next week is, will COVID prevalence keep falling down to levels like we saw last summer or last February, or will we plateau back at a relatively high level.
Unfortunately this is the only real metric we have to tell us what's happening right now. The data lags I've been talking about for some time remain atrocious, rendering case data in Minnesota nearly useless.
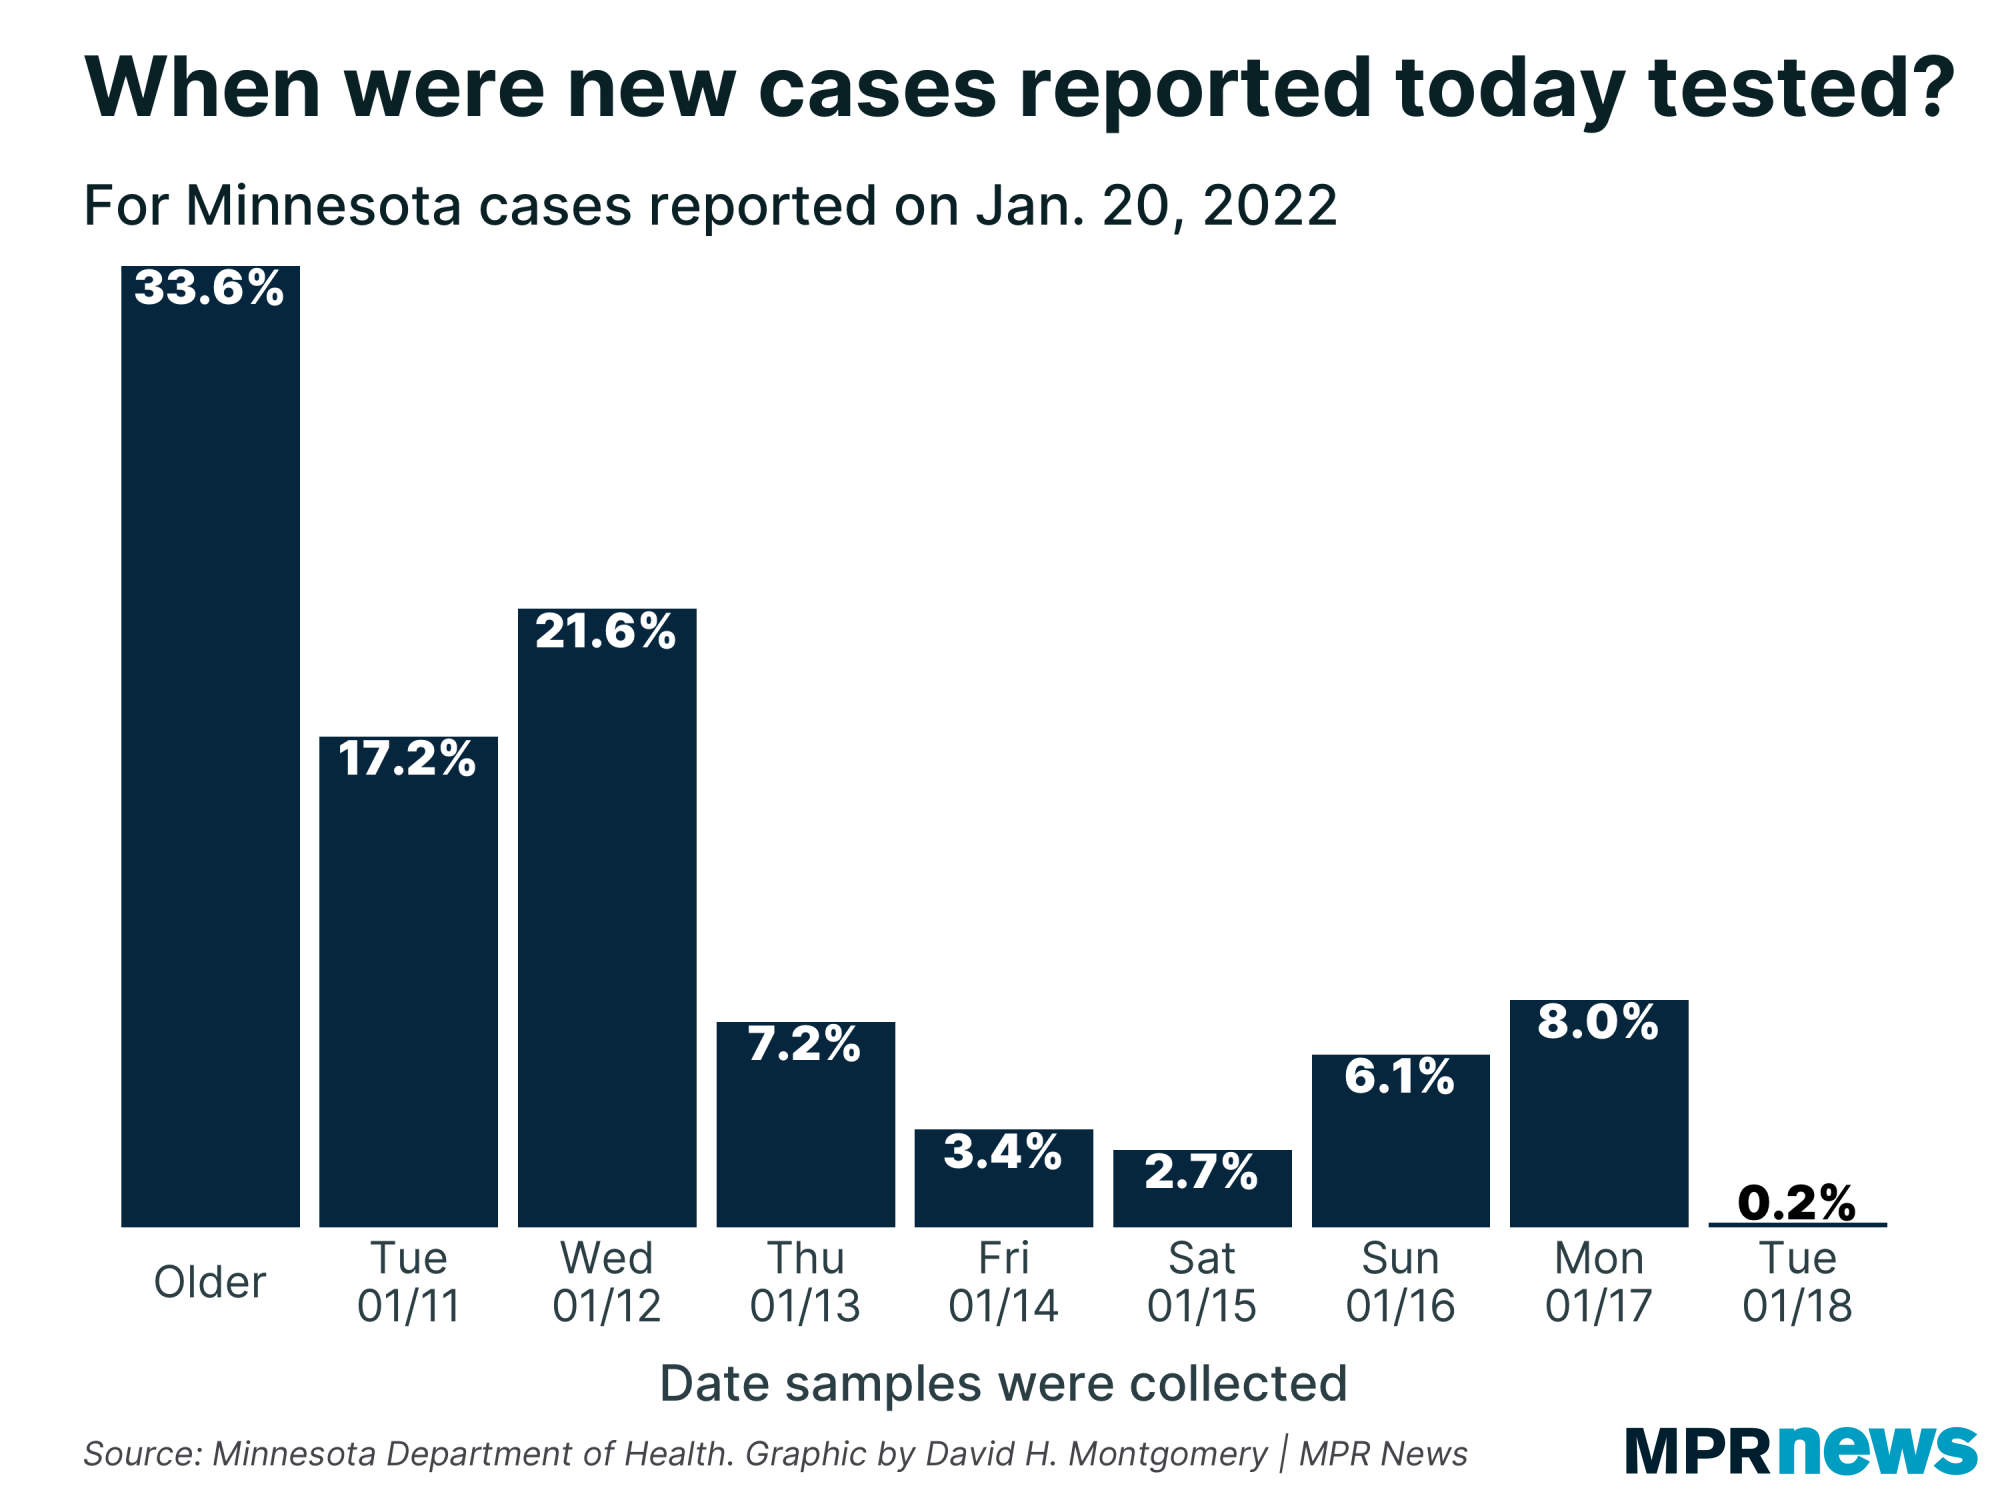
An example: Today's report from the Minnesota Department of Health included 11,440 new cases. Nearly 80 percent of those cases came from tests more than a week old! |
| |
|
|
Another example of the horrendous delays right now: Yesterday's report included 2,658 cases from tests taken on Jan. 3. That's 17 percent of the 15,184 cases reported from that day so far, more than two weeks after the fact.
The worst part is these delays aren't consistent or regular. If it were simply the case that Minnesota's testing data had gone from the five- to seven-day lag we were used to most of the pandemic to a nine- or 10-day lag, we could adjust for that.
Instead this data is coming in fits and spurts.
For example, in Thursday's report, here are the numbers of tests and cases the health department reported from each day of testing:
| Sample date | Cases | Tests | | Tuesday 1/18 | 20 | 17,707 | | Monday 1/17 | 910 | 28,479 | | Sunday 1/16 | 692 | 4,127 | | Saturday 1/15 | 310 | 2,051 | | Friday 1/14 | 392 | 8,345 | | Thursday 1/13 | 822 |
2,371 | | Wednesday 1/12 | 2,474 | 1,151 | | Older | 5,808 | 4,590 |
You'll immediately notice: tens of thousands of new tests from just a few days ago, but only a tiny number of cases from those days.
The exact proportions there vary from day to day, but that's the general trend we've observed in the data in recent weeks — the Health Department updates its testing data fairly promptly, with cases lagging behind by days (or weeks).
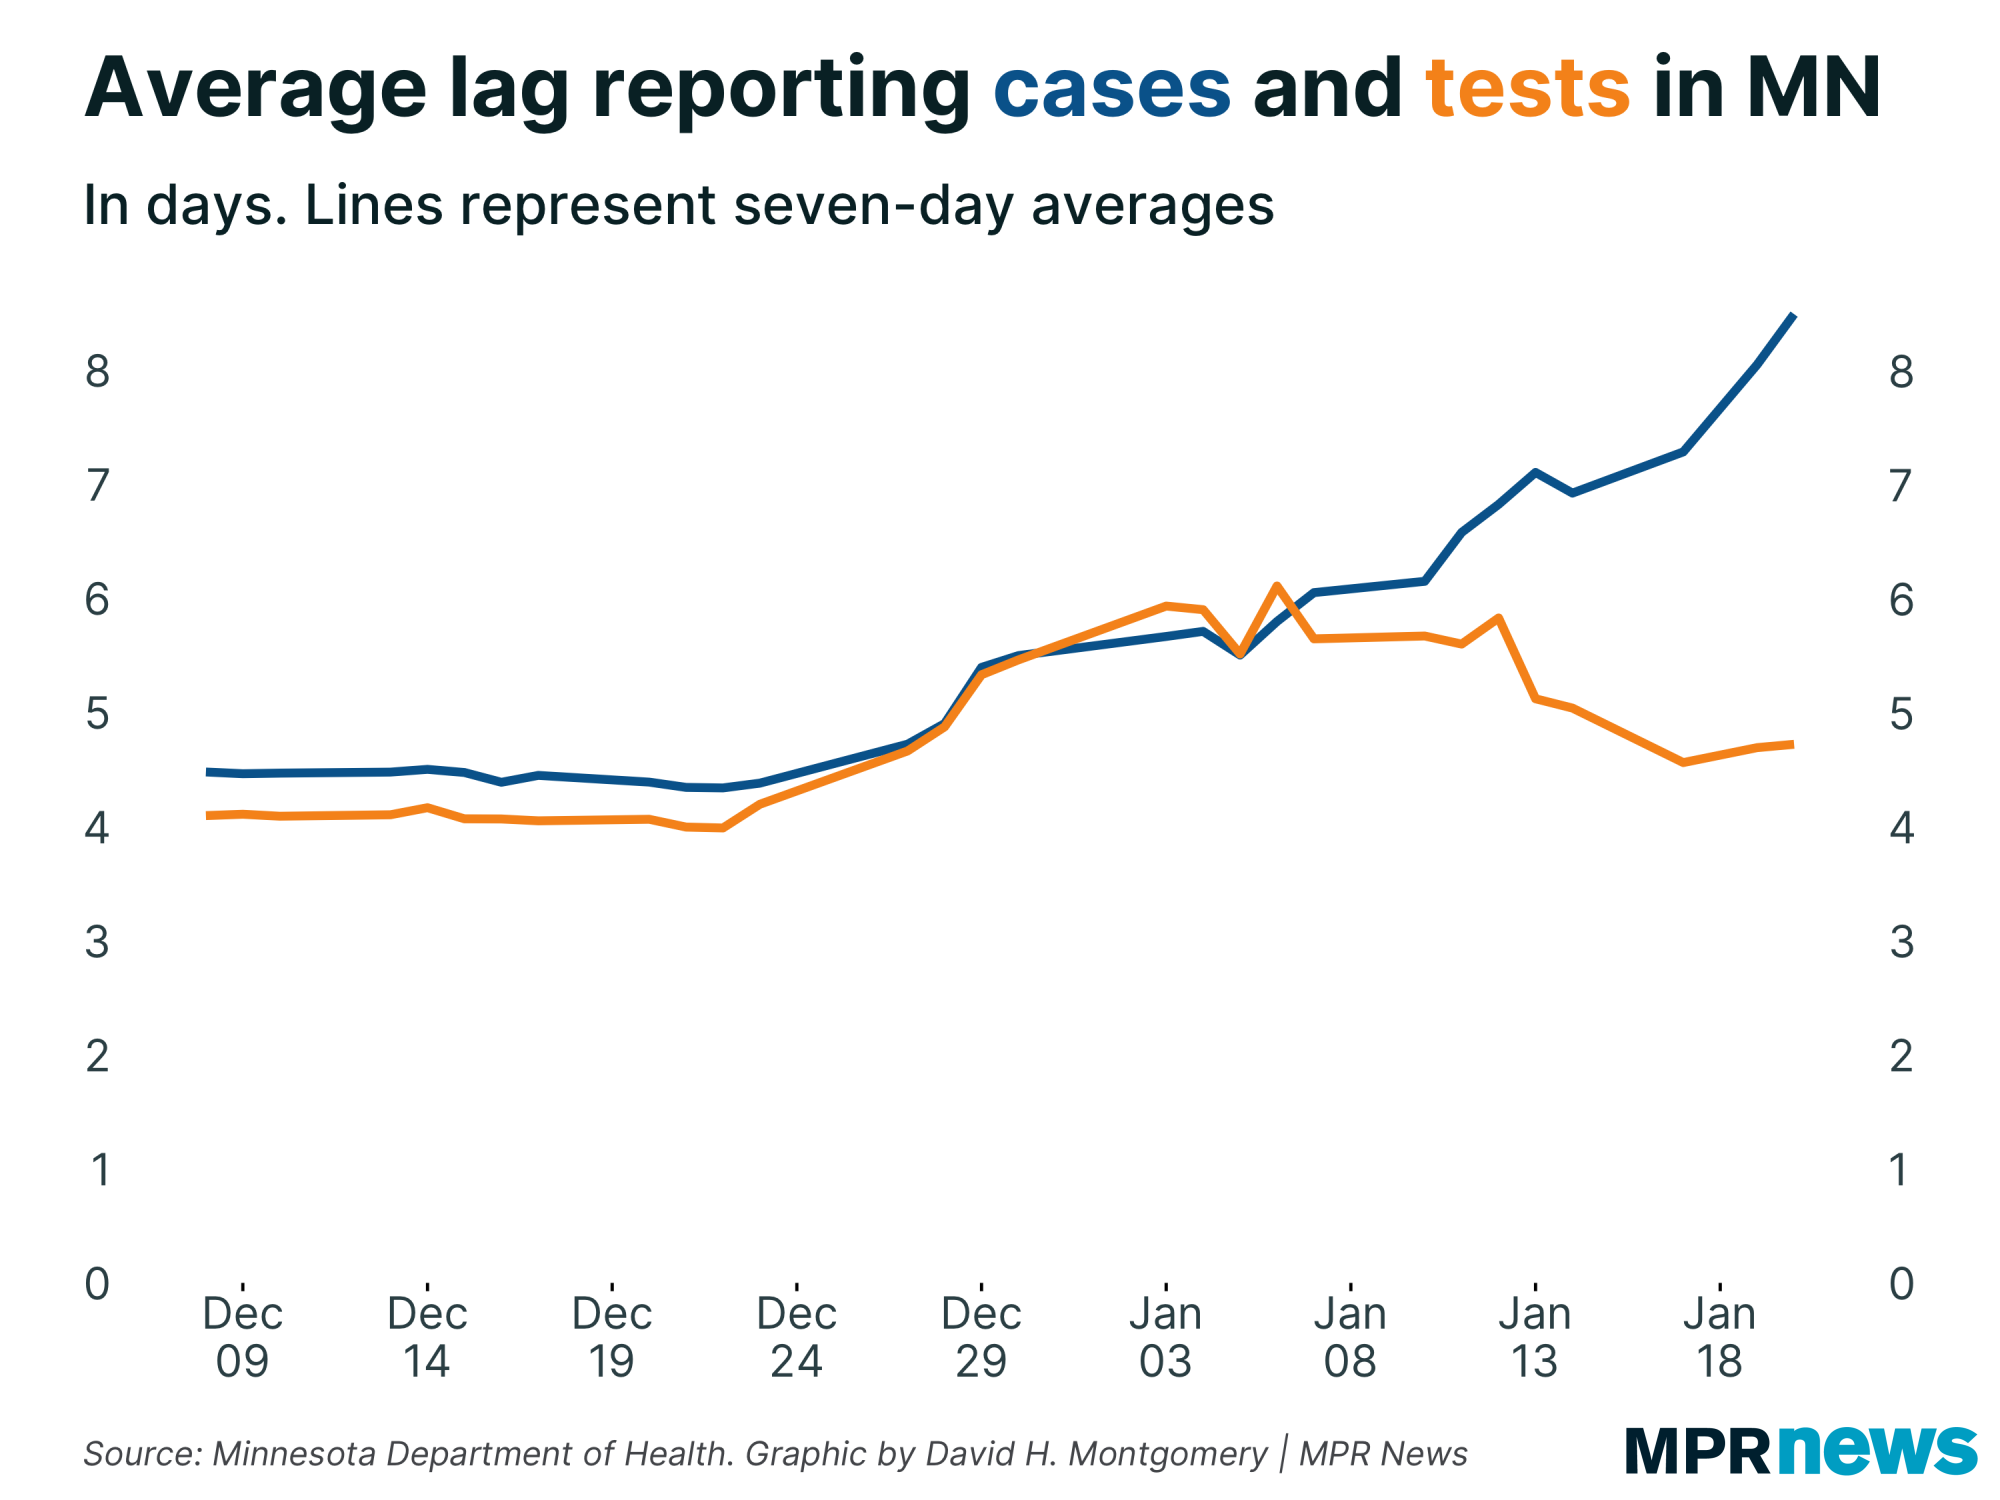
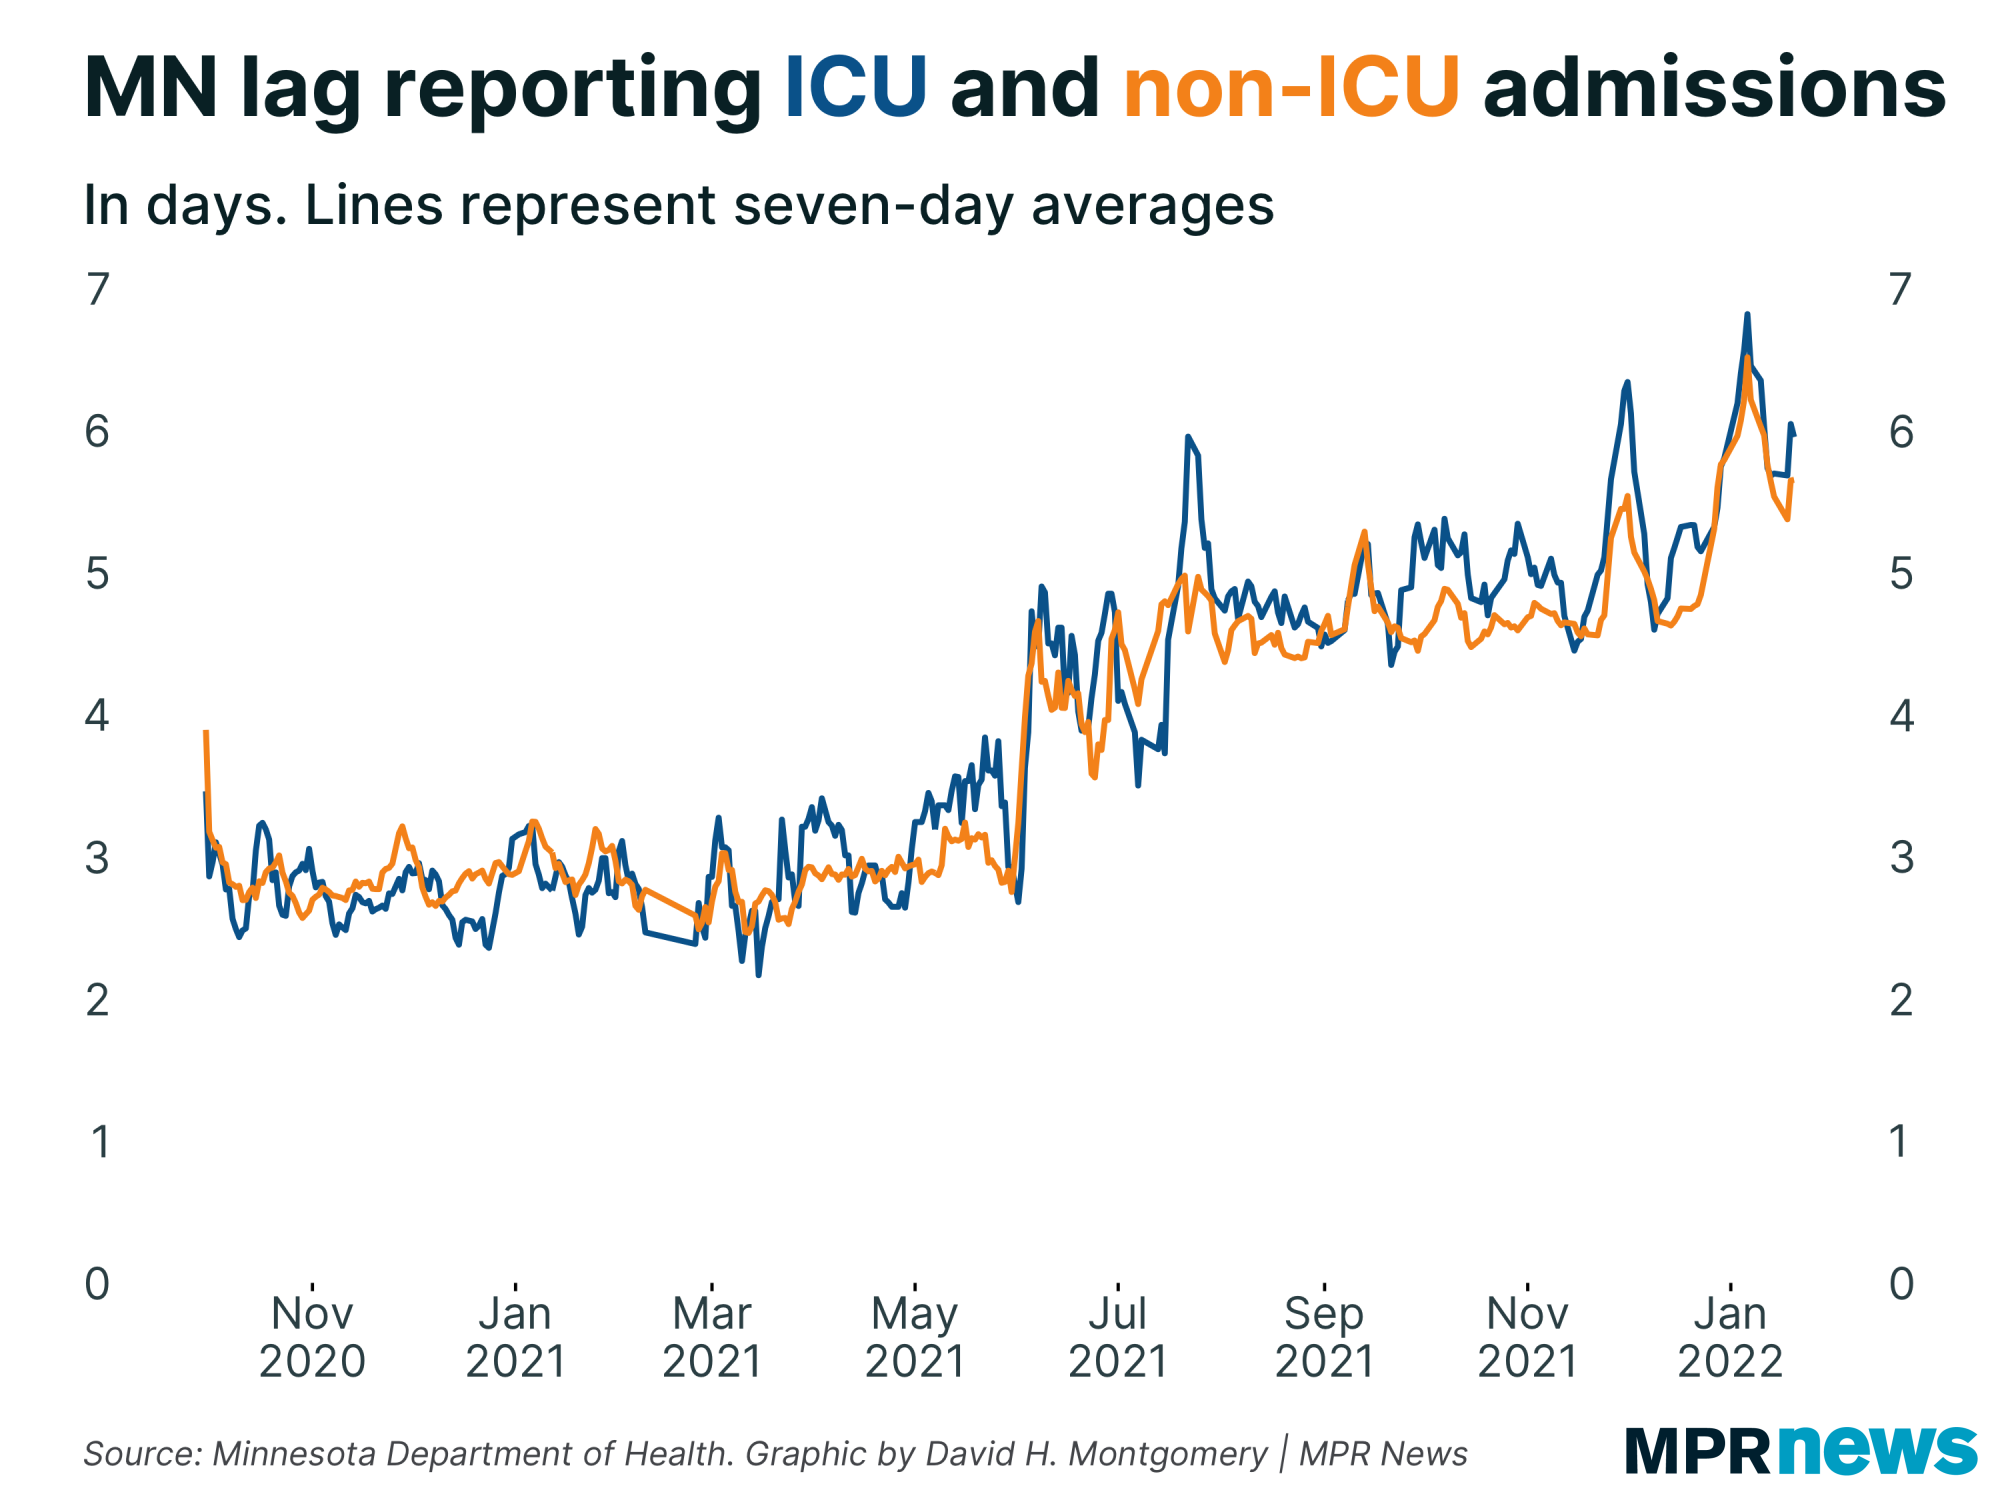
You can see this in this chart comparing the average reporting lag for cases and tests in Minnesota over the past six weeks or so. (We only started getting the necessary data to calculate this for tests back in early December.) |
| |
|
|
The two metrics moved largely in concert through early January, with both rising after Christmas as holidays threw off reporting — as we'd expect.
But starting in early January, the case lag started rising and rising — while tests didn't, and have receded down to a little above their early-December average.
(Attentive readers will note the case lag numbers here are higher than in the chart in last week's newsletter. That's a correction on my part — today I found an error in my code for calculating a seven-day rolling average when there's usually four or five days of data. The error had been producing lag figures that were too small, though the relative trends were generally accurate.)
This divergence means that positivity rate is just as skewed as case counts are. The most recent 10 days or so of data are going to appear to have significantly lower positivity rates than they actually do, because tests are being reported promptly and cases aren't.
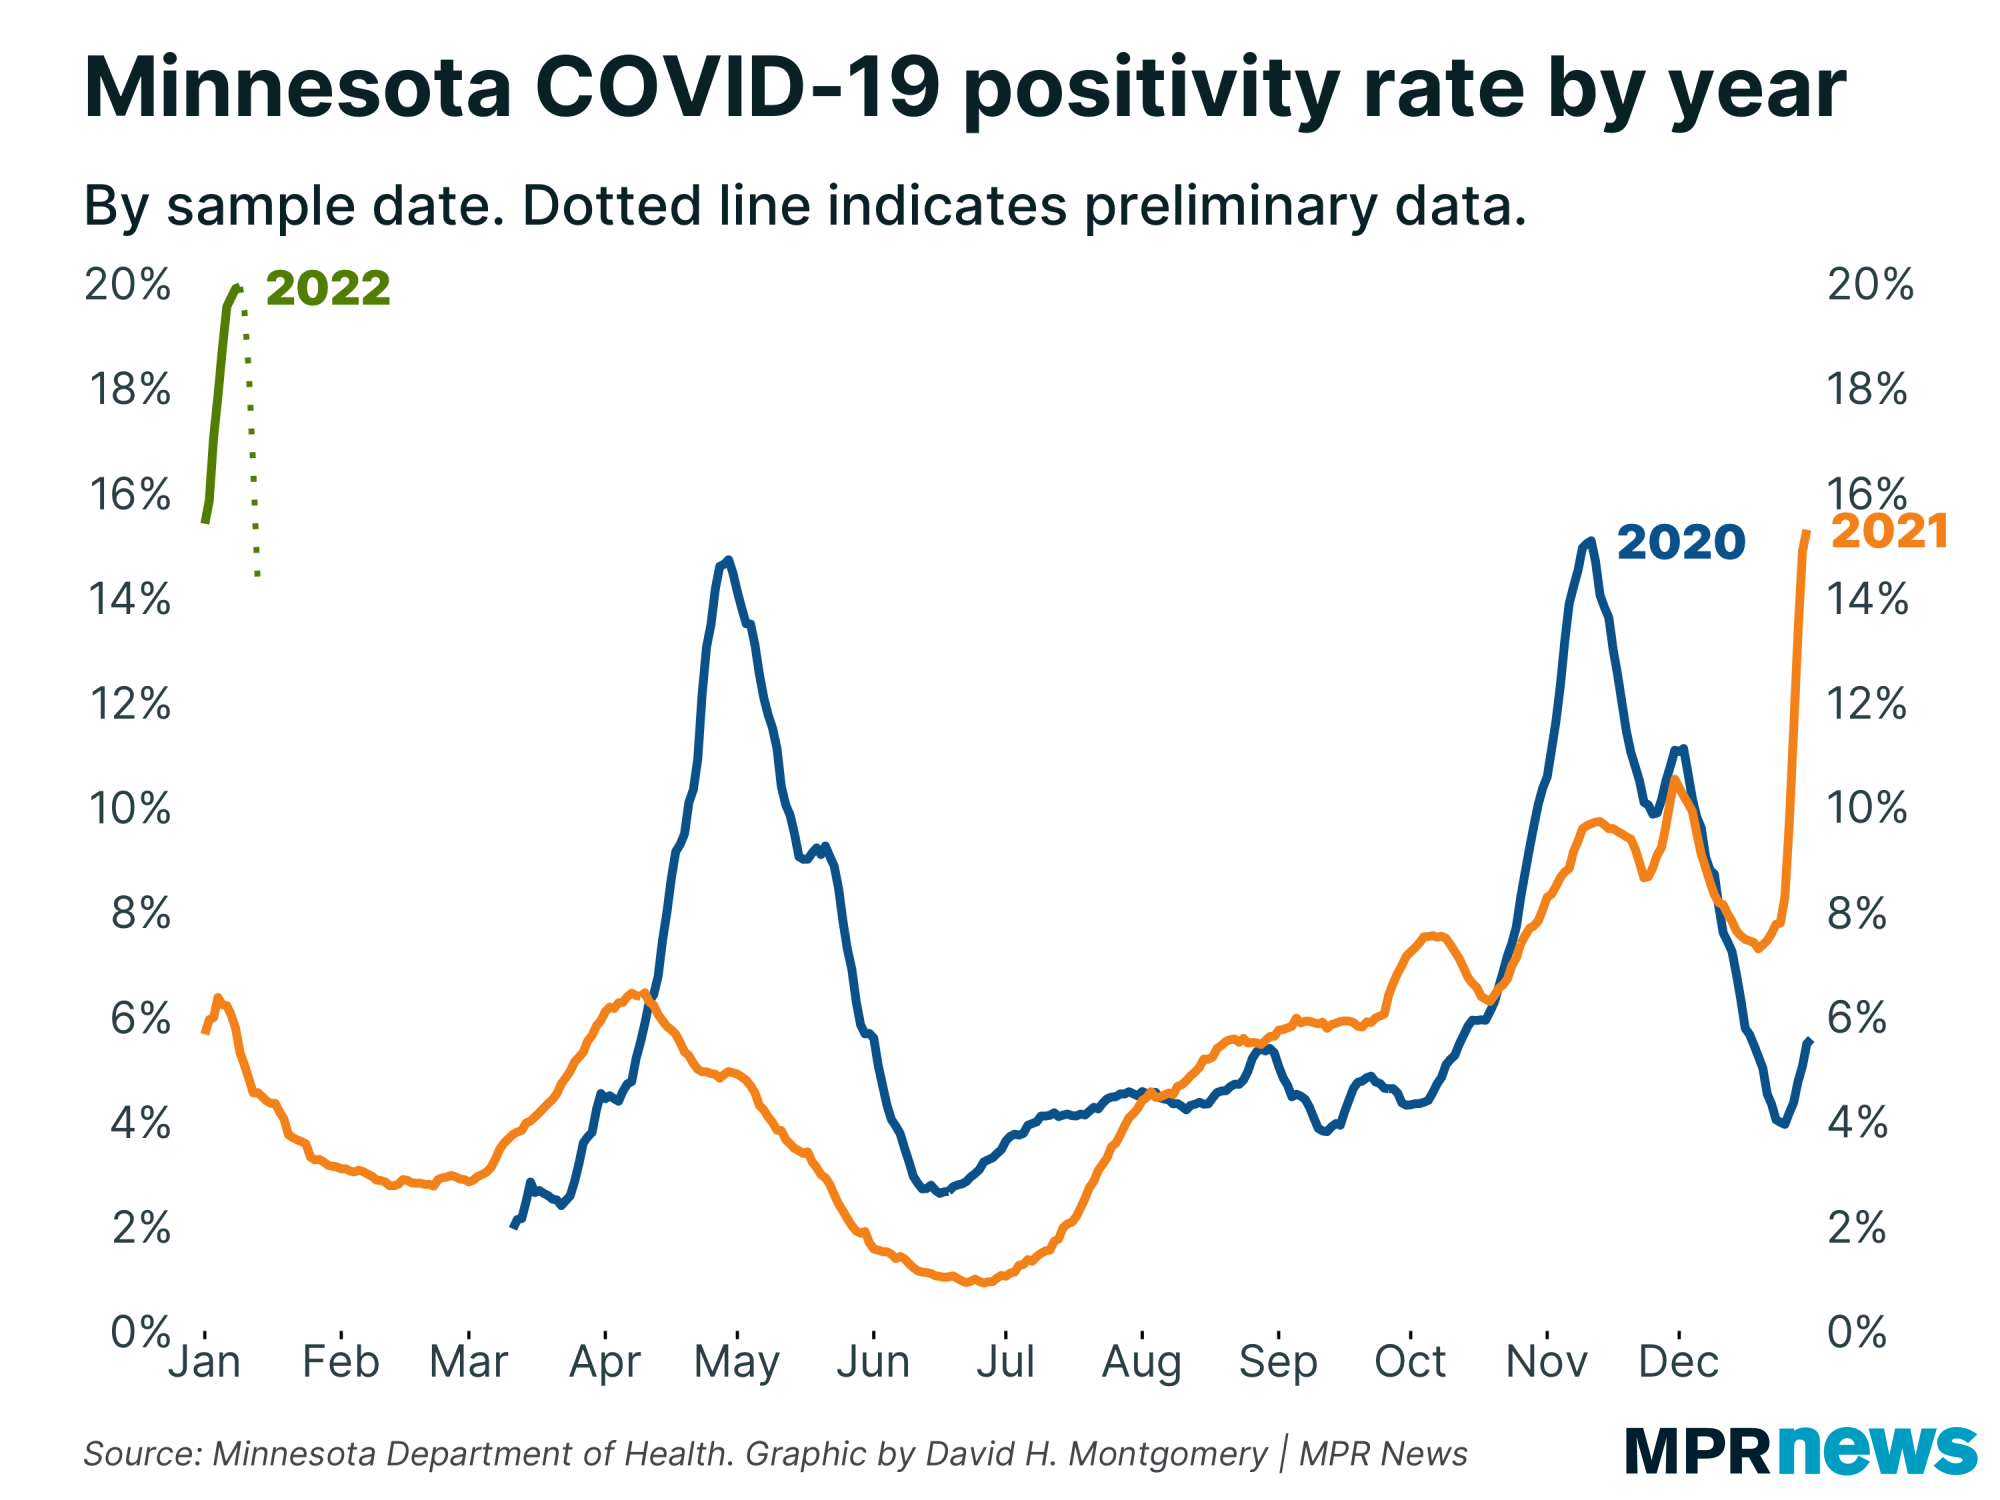
Fortunately, this makes Minnesota's case data only mostly useless. We can speak with decent accuracy about how things were looking two weeks ago or so, as in this chart of positivity rate. |
| |
|
|
As noted before, you can mostly disregard that dotted green line in the upper left. That's an artifact of these case delays.
It's entirely possible that it will turn out that Minnesota's positivity rate was falling in this period, though it will certainly be by less than this indicates. Or this apparent drop could turn out to be an increase once all these lagging cases finally get reported.
We can say for sure that in early January, Minnesota set a positivity rate record, with nearly 20 percent of all tests positive.
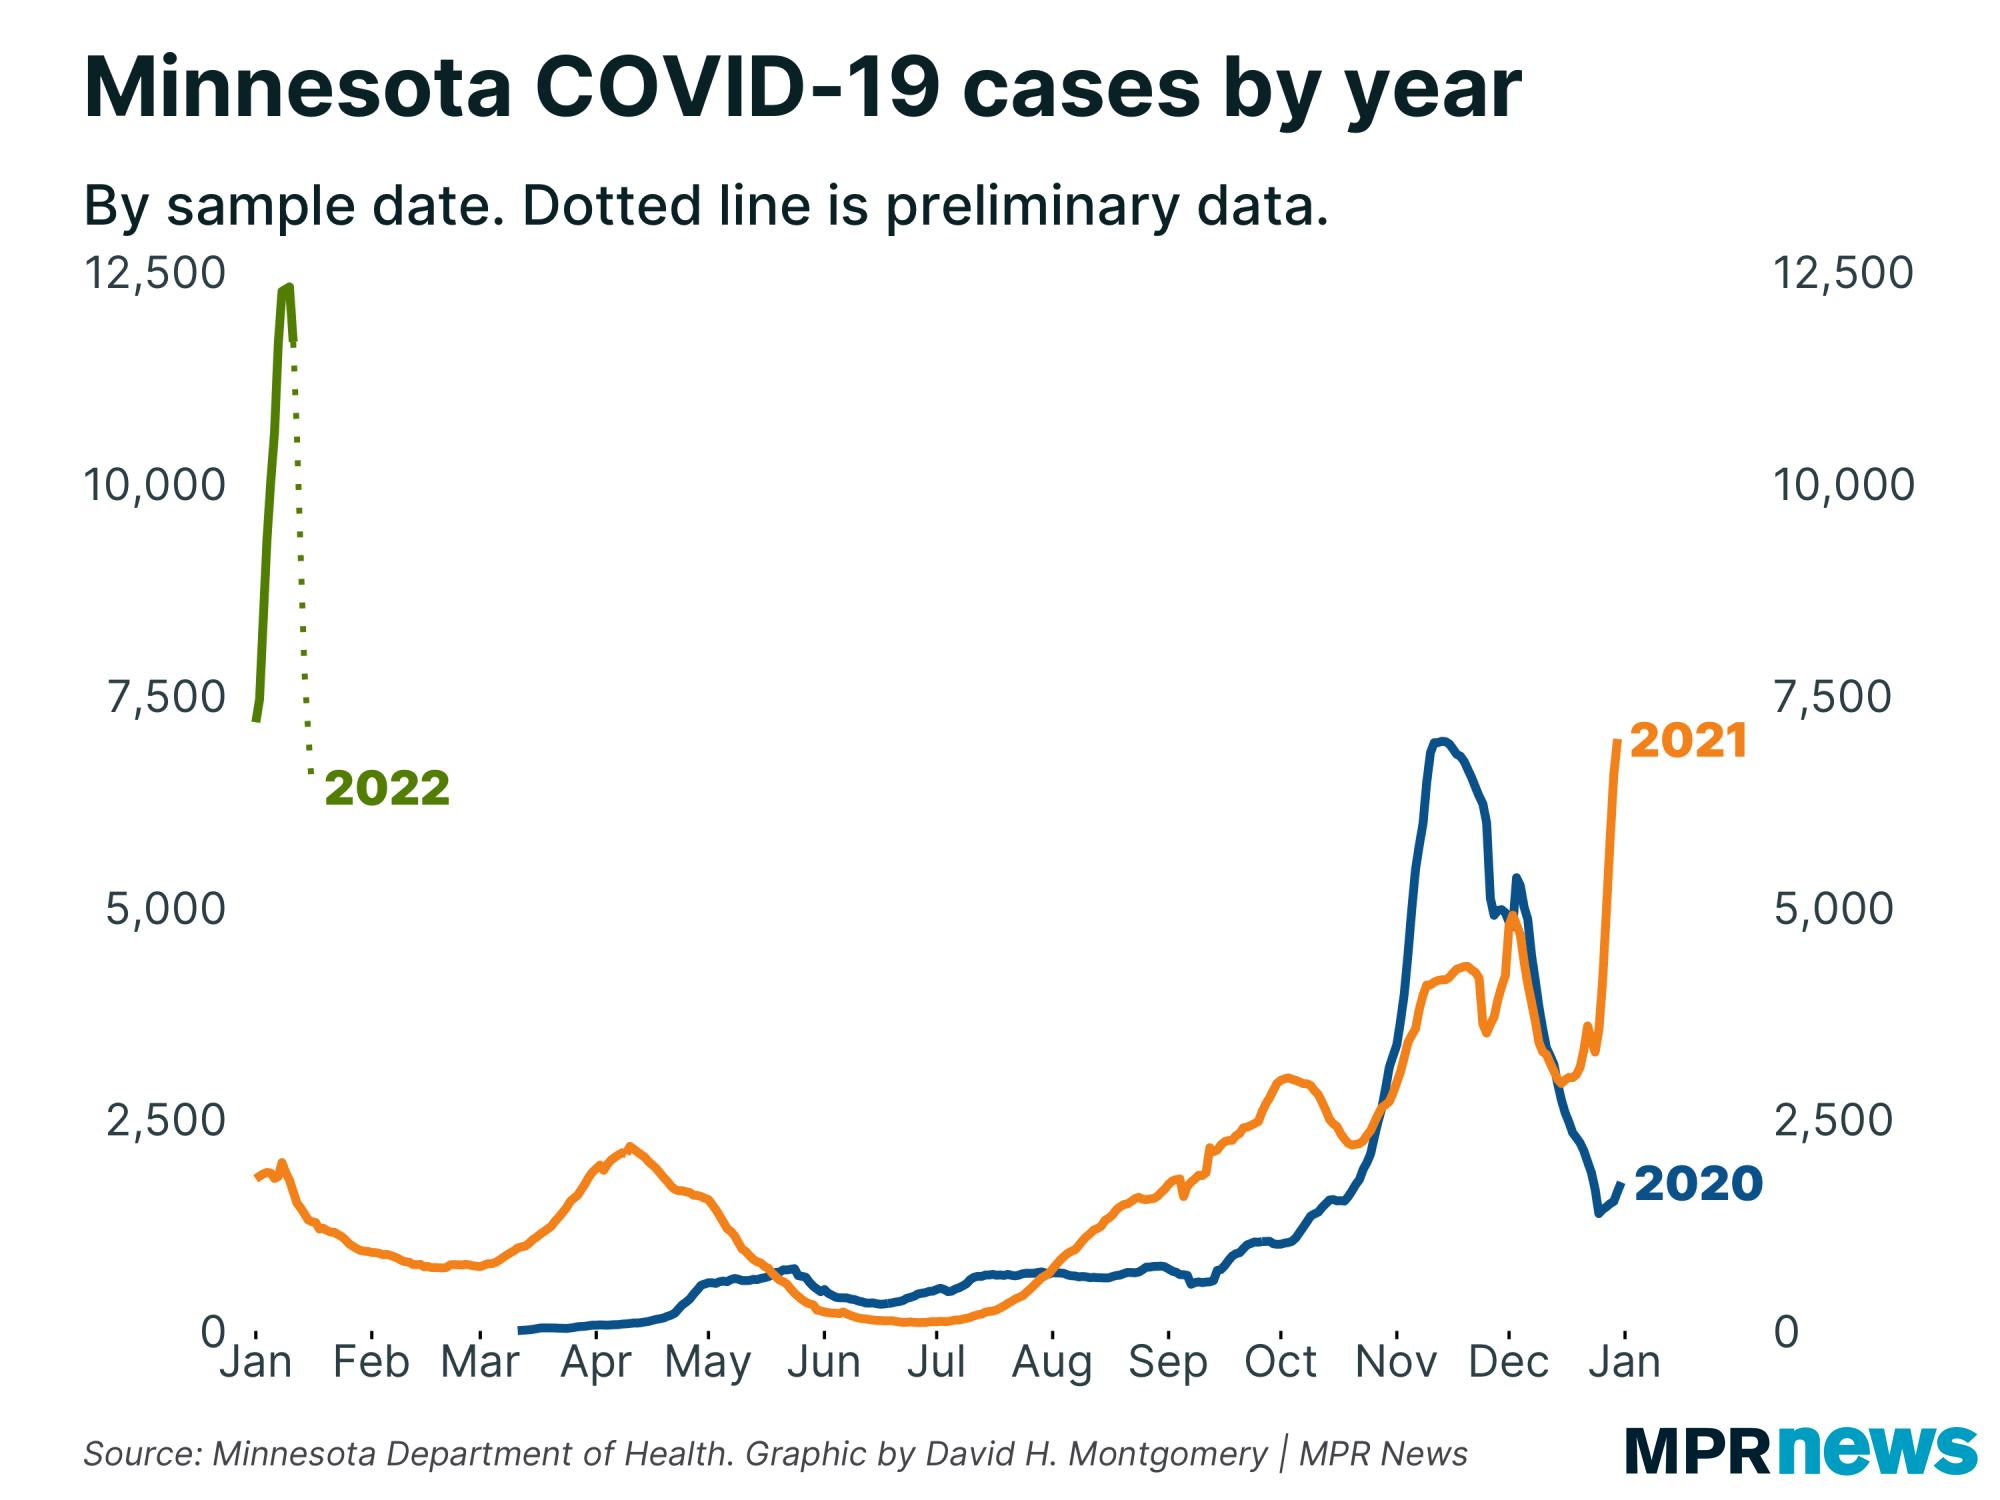
Similarly, we smashed through records for reported cases in early January (and similarly, you should disregard the apparent declines here). |
| |
|
|
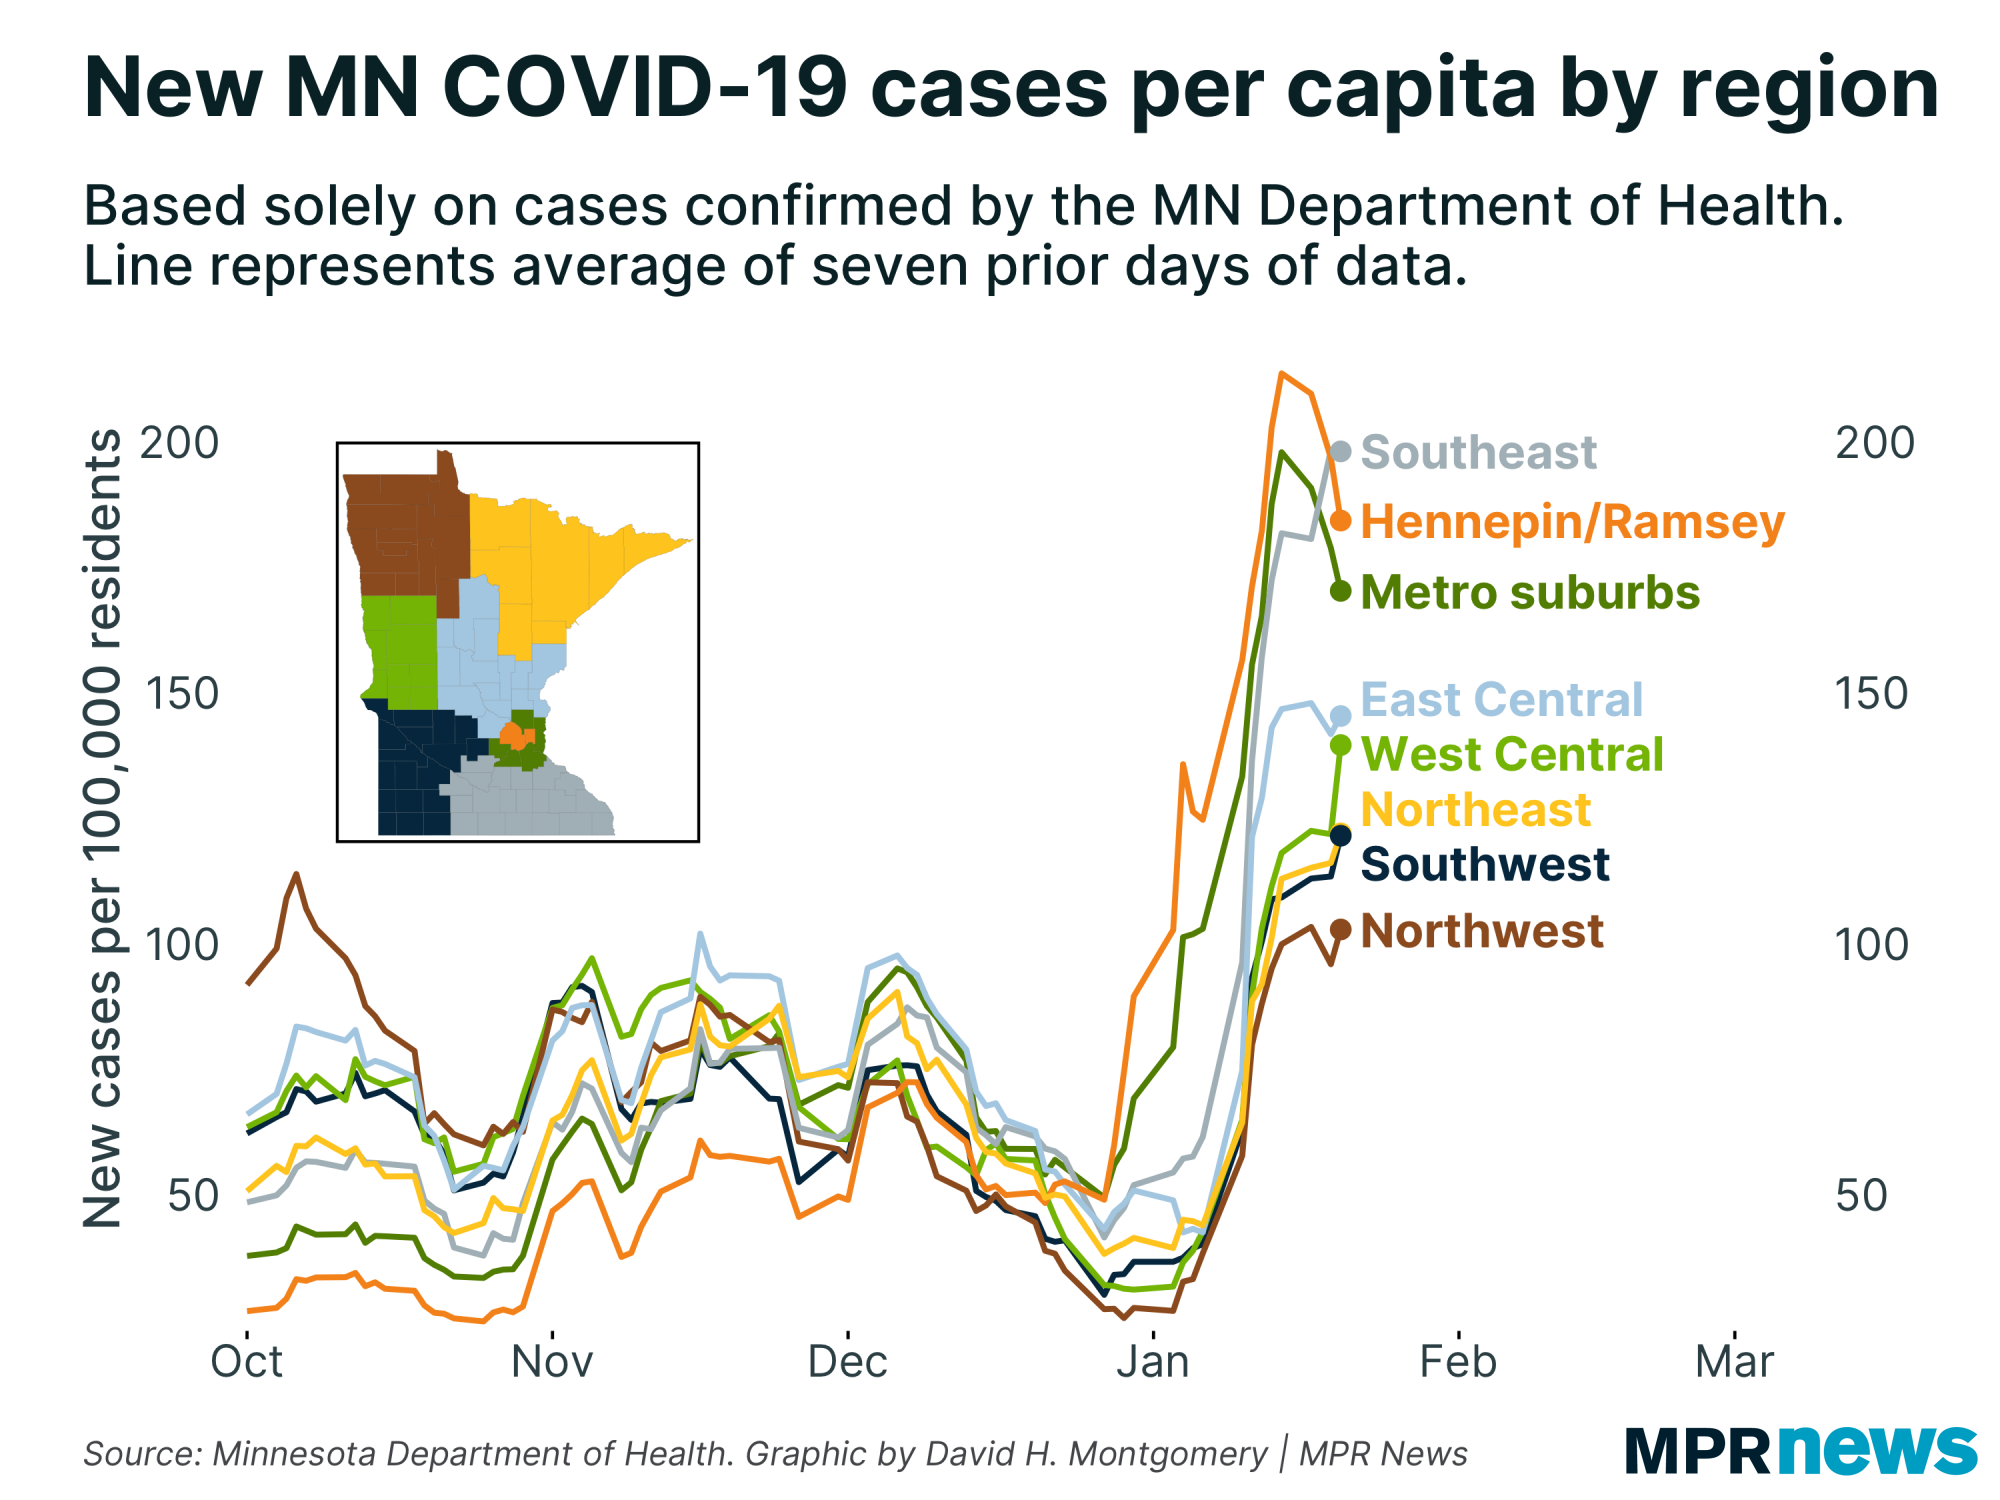
Let's circle back to that wastewater data, the one showing COVID levels peaked around Jan. 10. Remember, this is just data for the core part of the Twin Cities metro area, and that the Twin Cities got hit by omicron about two weeks before the rest of Minnesota did. Still, it's now been 10 days since our wastewater peak, so we should start watching to see if we see cases start to trend downward in the metro.
And guess what we're seeing this week? |
| |
|
|
Don't over-interpret this. This is data by report date, not sample date, so all these lags could turn out to be illusory. But this is also about what we would hope to see right now. I'll keep watching to see if these reported case counts keep falling (and keep trying to shake sample-date data by county out of the Health Department).
Another key data point here is hospital admissions. This is subject to reporting lags, too — not as dramatic as the lags for cases, but the delays are up — close to a week behind on average. (Though this has been a much more gradual accumulation of delays, and dates to this summer's delta surge, not this month's omicron surge.) |
| |
|
|
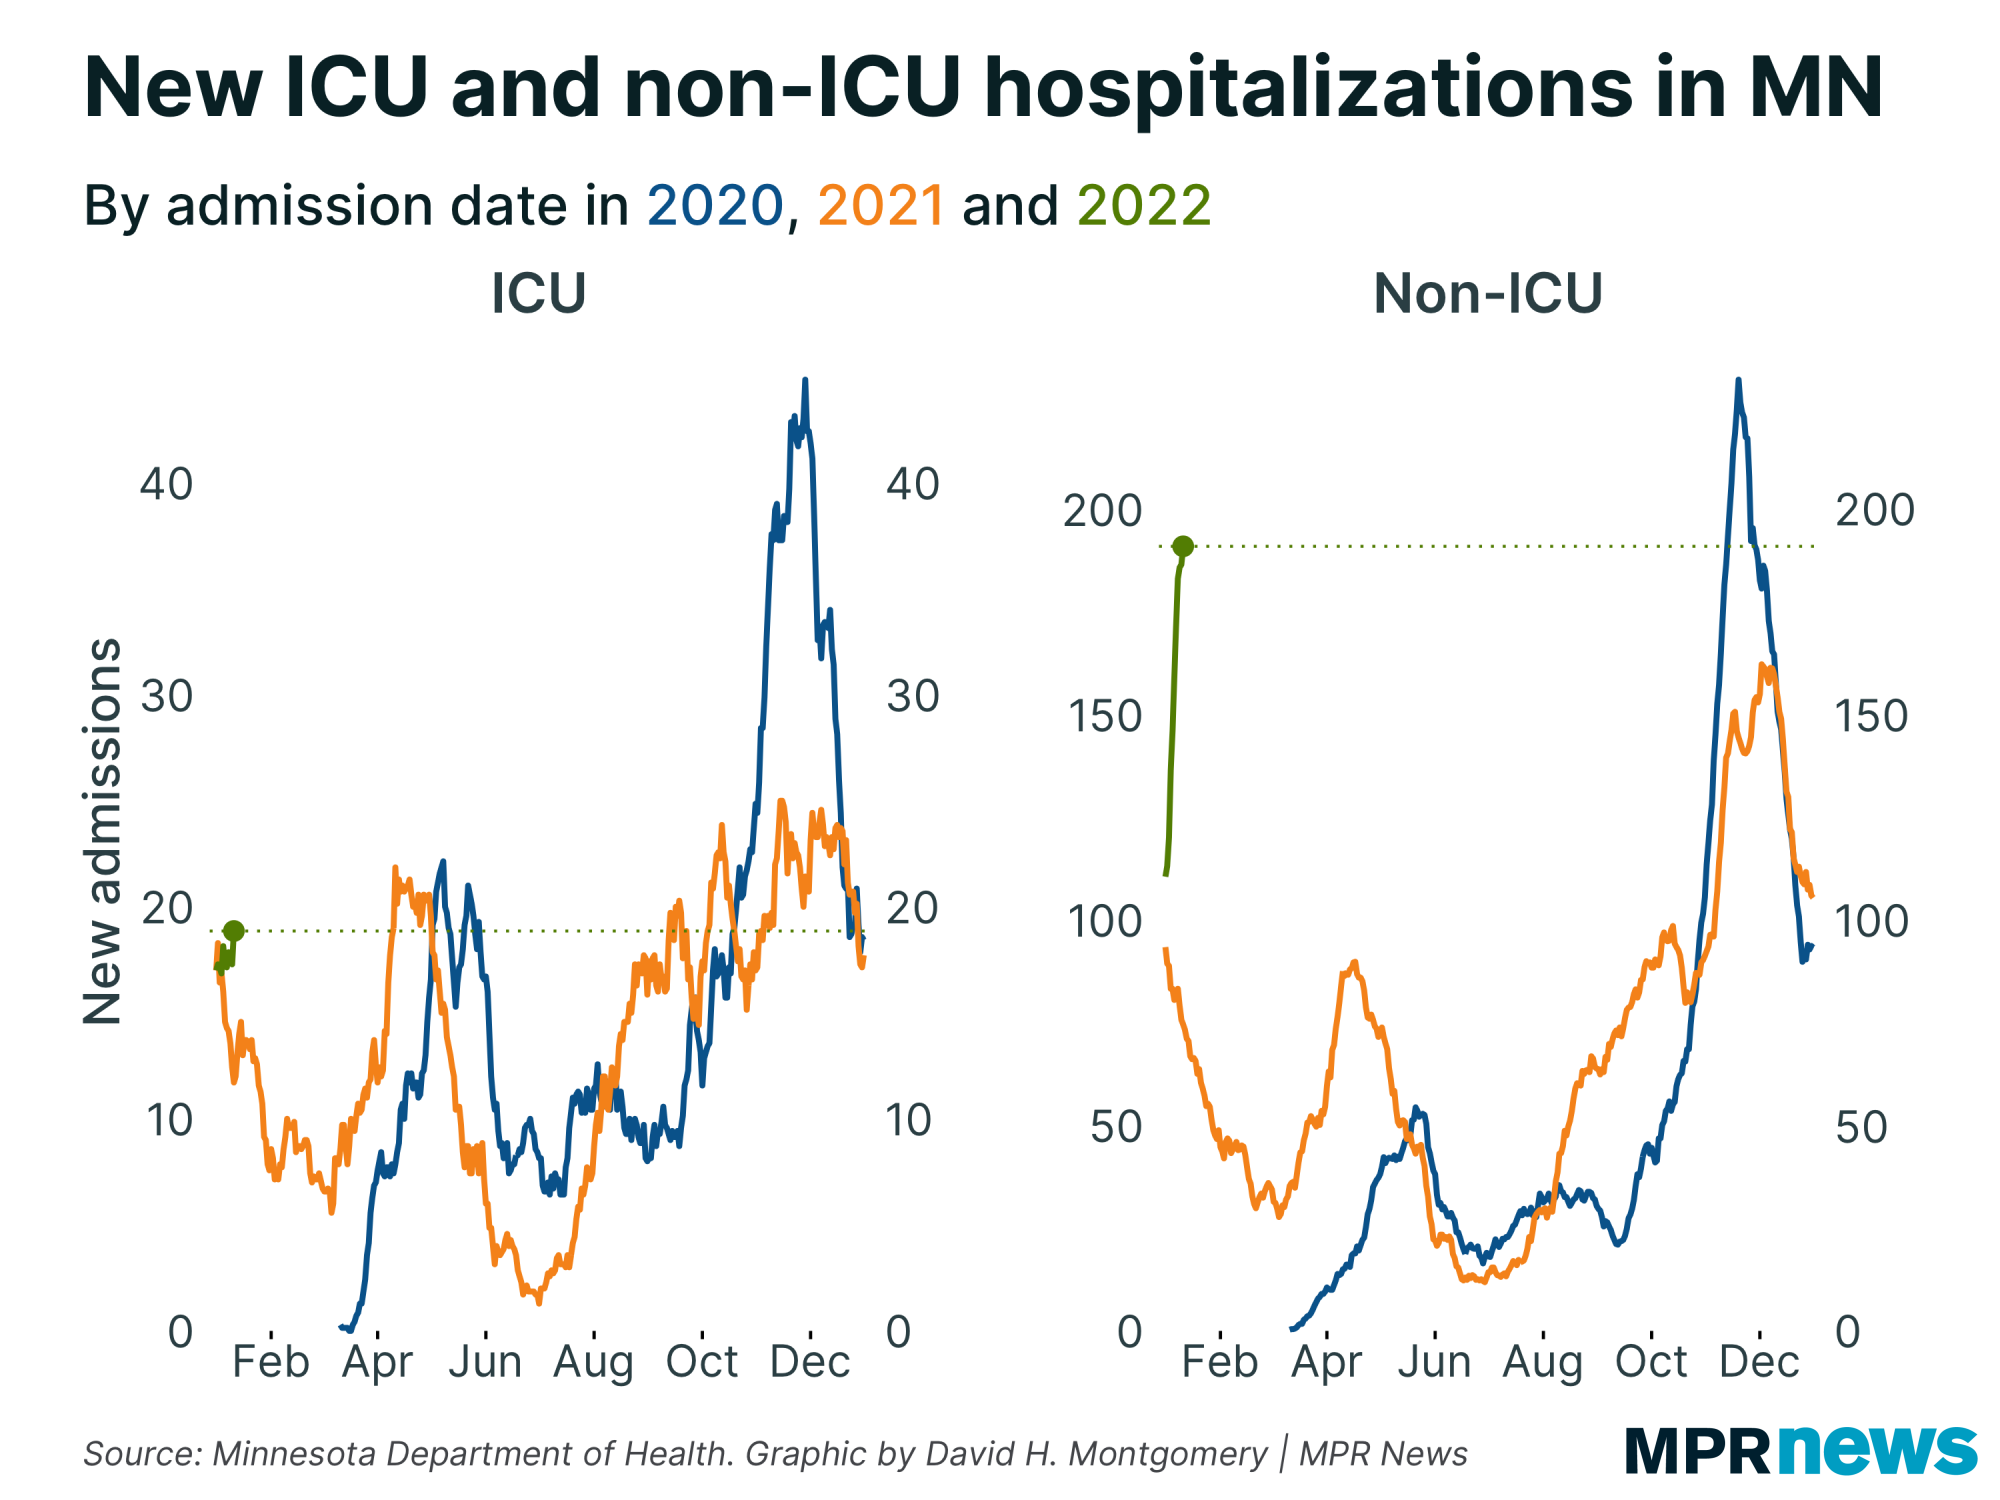
As a result of this, we have to be careful interpreting hospitalization data, too. Last week I shared the good news that ICU admissions continued to drop in early 2022. But I was only filtering out the most recent day or two of data there (a decision I had made over a year ago, when hospitalization reporting delays were much less severe).
If I filter out the most recent six days of data instead, what had looked like a drop in ICU admissions suddenly looks a little like the beginning of an upswing, while the non-ICU admissions continue to rise. (If you don't filter out the past six days, it looks like non-ICU admissions have peaked — but that's clearly a suspect result in light of the hospitalization lag.) |
| |
|
|
Below, I'll explore a few more stats about Minnesota's COVID-19 outbreak. If you want to learn more, I also recommend these other articles:
| | |
|
|
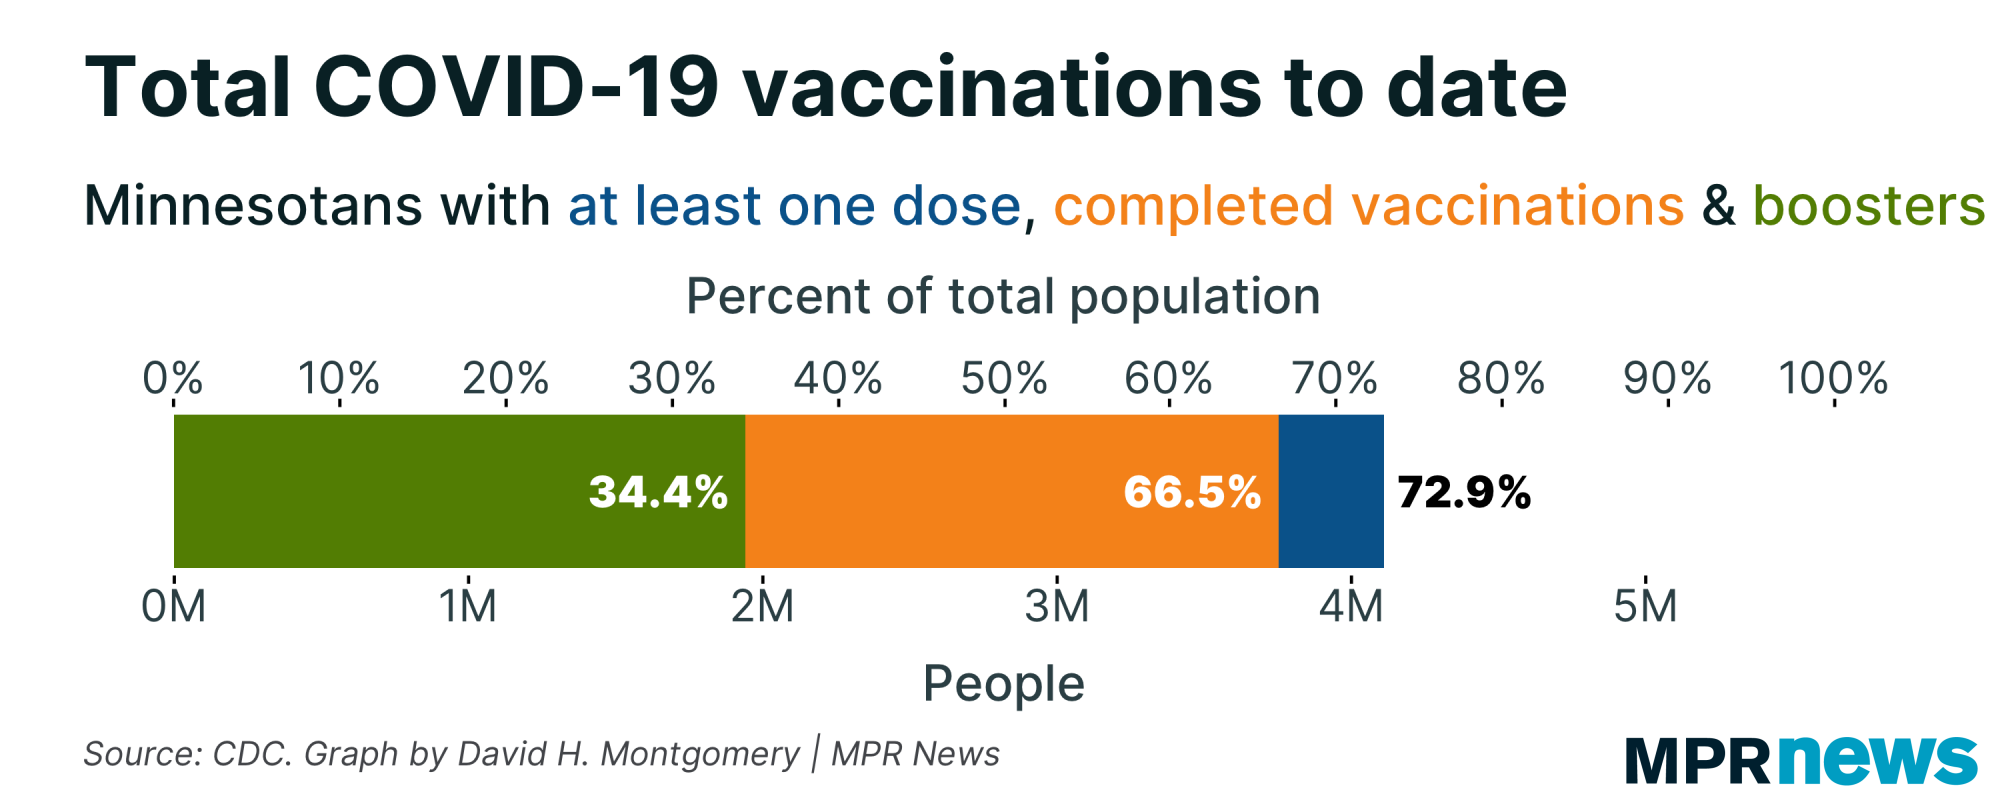
| Where vaccination rates stand | | Overall, 73 percent of Minnesotans have at least one dose of COVID-19 vaccine, 66.5 percent are fully vaccinated, and 34.5 percent are boosted. |
| |
|
|
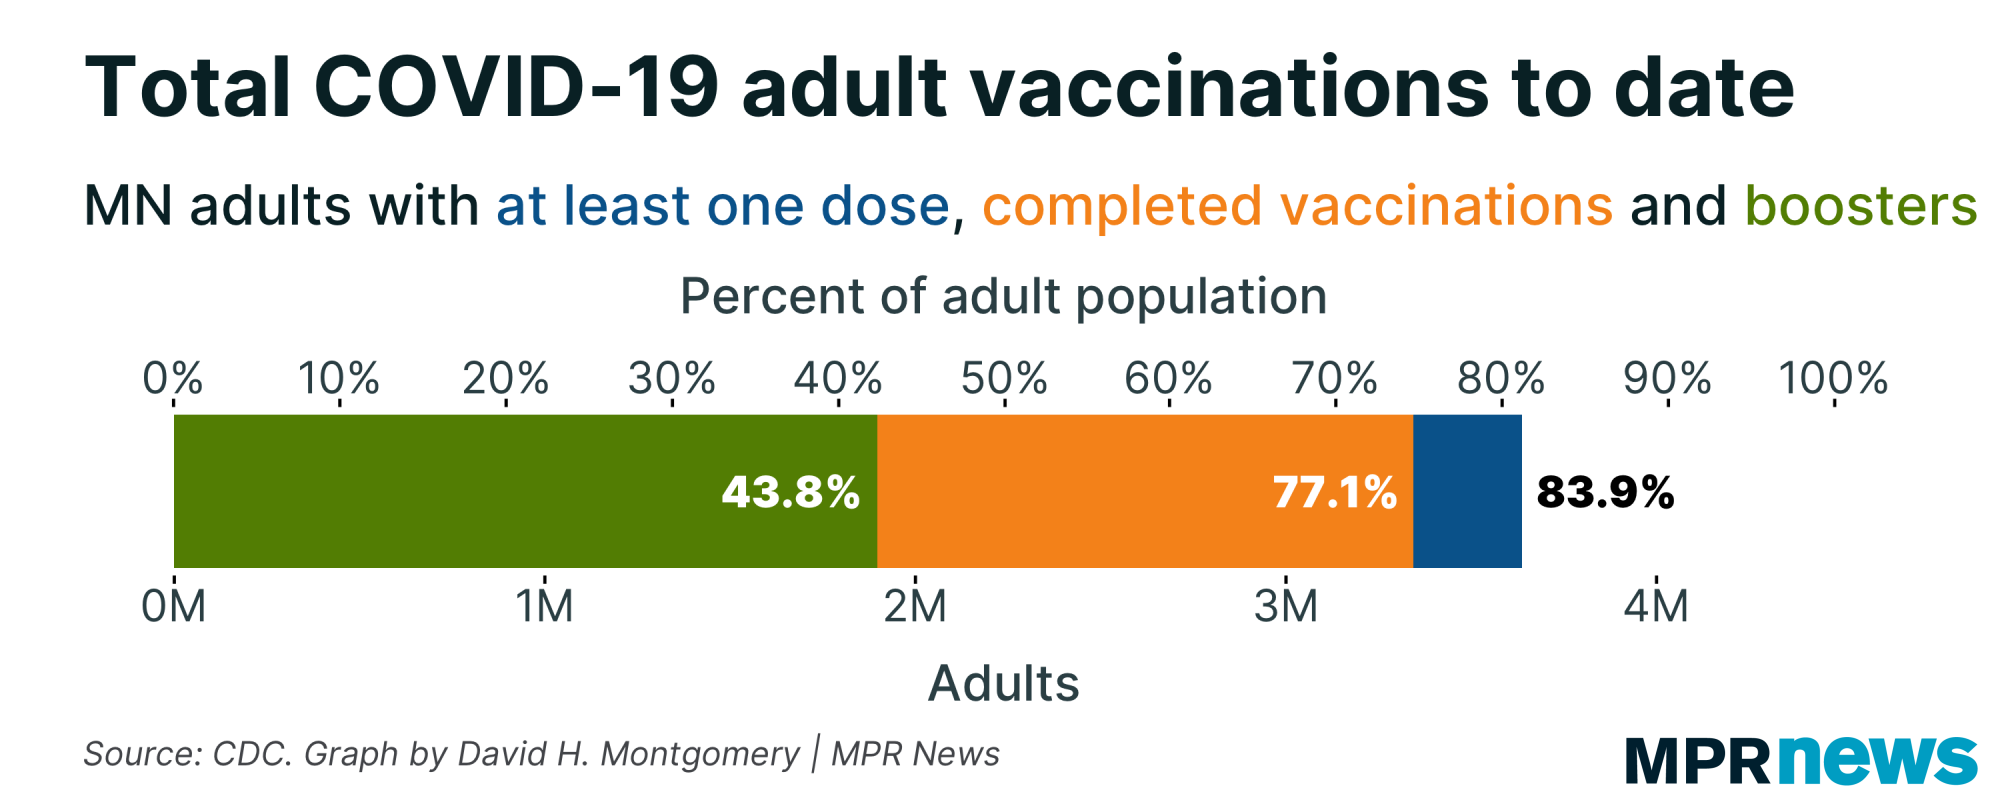
| These figures are somewhat higher for adults 18 and older, who have all been eligible for vaccines since last spring. Here, 84 percent have at least one dose, 77 percent are fully vaccinated, and 44 percent are boosted. | | |
|
|
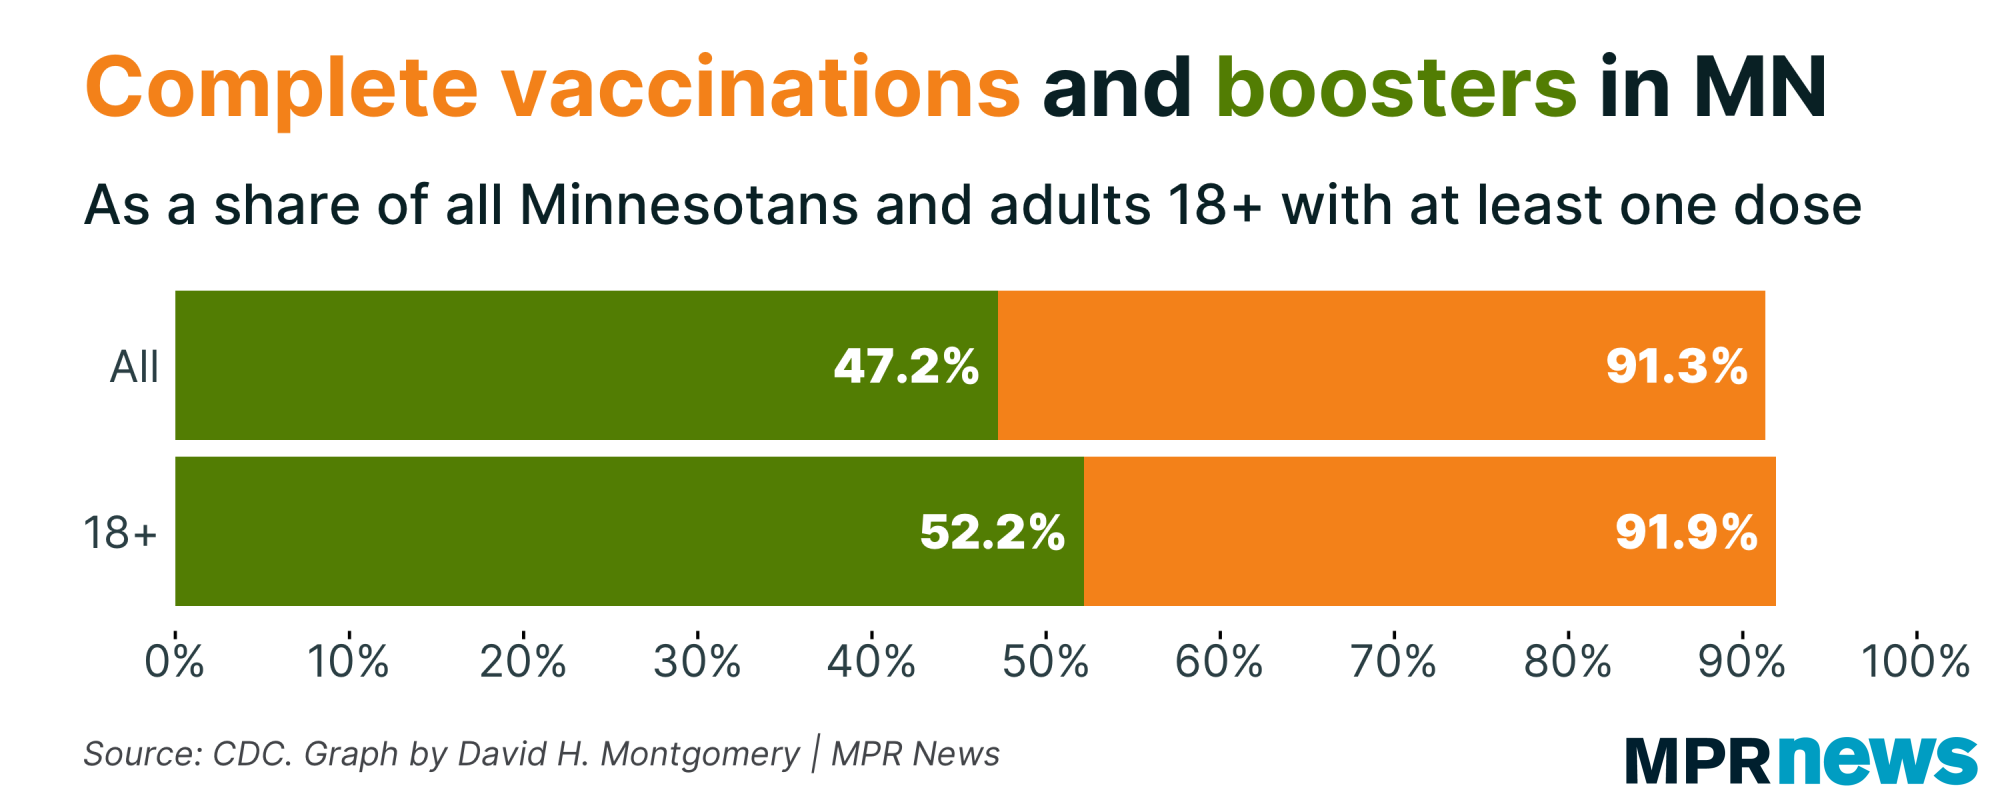
| Overall, around 90 percent of Minnesotans with one dose are fully vaccinated, and around half with at least one dose are boosted. (Note there are some potential data issues here — some vaccinations recorded as a "first dose" could be a second or third dose that's not correctly linked to the original person. Nonetheless, it's the best we have.) | |
|
|
|
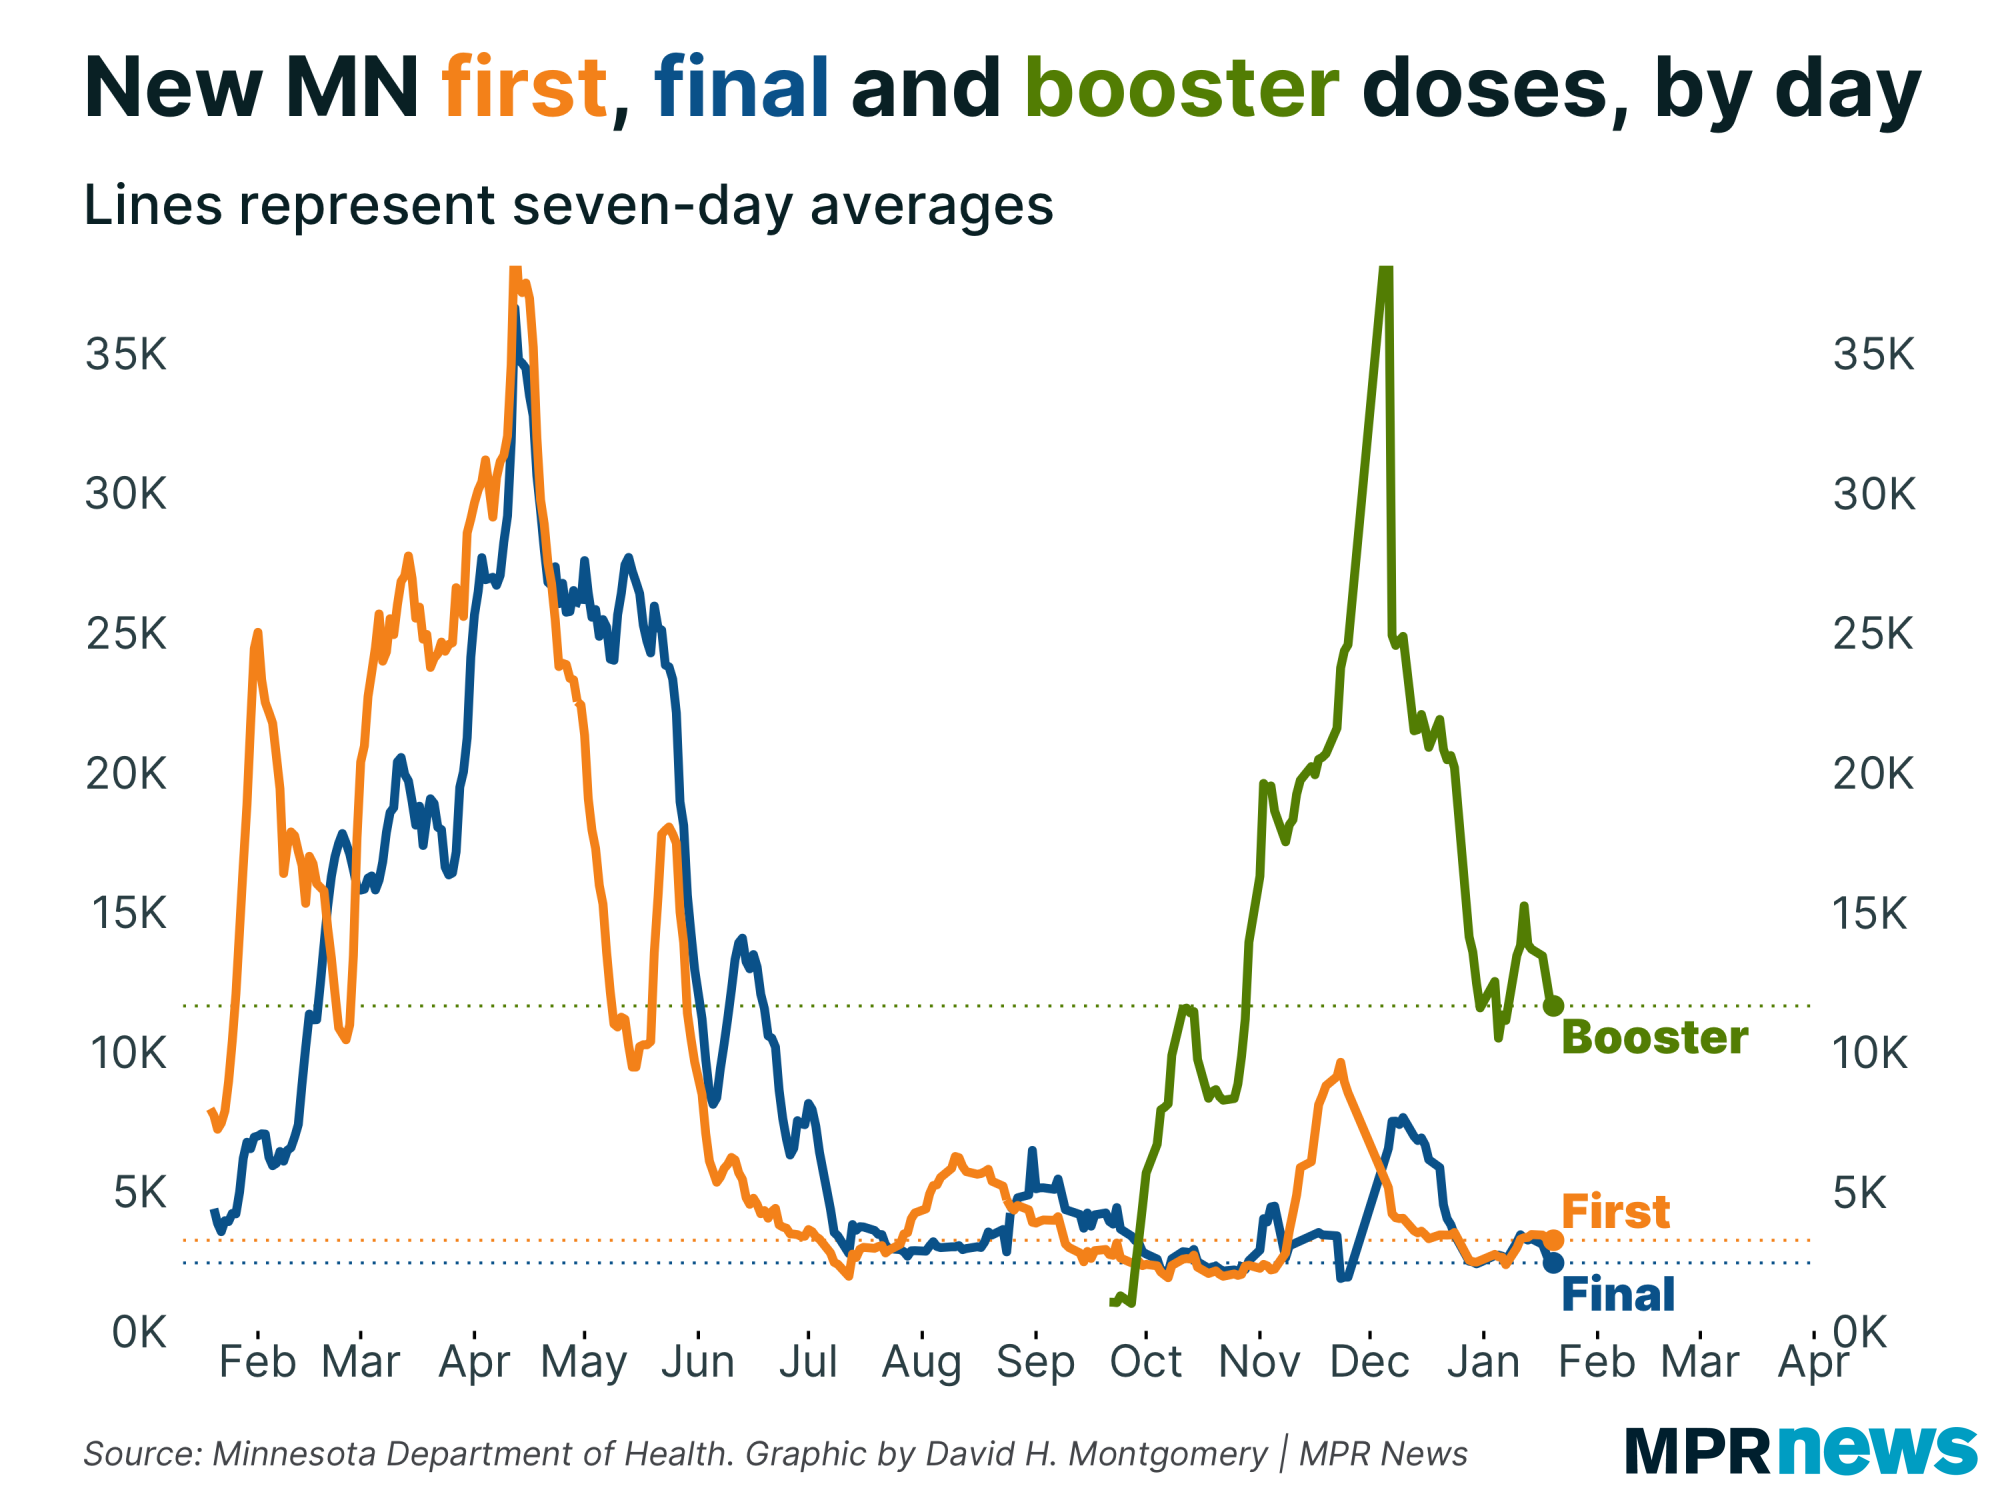
| While thousands of Minnesotans continue to get vaccinated for the first time every day, overall first-dose figures are increasing very slowly. The initial rush in November from newly eligible 5- to 11-year-olds has faded. Boosters continue to go into arms at a decent clip, but this pace has receded, too. | |
|
|
|
| How I calculate COVID lag times |
My COVID analyses today and in recent weeks have leaned heavily on charts showing how much the Health Department's data lags. But if you went to their website looking for this information, you'd come up empty. So how am I getting this data?
I don't have any secret source here. I'm constructing this data myself based on what the department is releasing.
Here's how it works. Each workday, the department releases a table showing the number of cases by sample date, from each day's tests. That's on their Situation Update.
Every day since the Health Department started releasing this data, I download a copy of it onto my computer — a giant spreadsheet with one column for "sample_date" and a separate column for "report_date" and other columns reporting the number of new cases from that day.
Using that dataset, I then calculate for each day the number of newly reported cases from that day.
Here's an example:
As of Thursday's report, tests conducted on Jan. 10 have resulted in 15,371 total cases. As of Wednesday's report, Jan. 10 tests had resulted in 12,941 cases. As a result, the Jan. 20 report had 2,430 newly reported cases.
With that calculation done, I can then look at which days a given report date's cases came from. Or calculate the average age for that report's cases.
I do the same thing for the other metrics for which the Minnesota Department of Health reports data by event date. That includes tests (by sample date), hospital admissions (by admission date) and deaths (by death date).
In all cases, I'm limited by when the department began sharing event-date data. For example, they began sharing case data by sample date all the way back on May 15, 2020, giving me a year and a half of daily reports to compare and analyze. But tests by sample date only appeared for the first time on Dec. 1, 2021.
All this event-date data the state provides is retroactive, so I know the number of tests conducted on April 25, 2020 (2,275). But I don't know what dates those April 25, 2020 tests were originally reported, because I only got this data starting in December 2021.
Still, the data we do have can provide invaluable insights as long as someone (me) goes to the effort of compiling each day's report. |
| |
|
|
What's happening next?
|
I'll be watching data closely for a sign of a peak in the Twin Cities (as we should expect given the wastewater data). Then we start watching for when greater Minnesota (for which we don't have wastewater data) will start showing a peak — probably a week or two after the metro area does.
I'll also be tracking hospitalization figures, subject to their reporting delays, to see the degree to which omicron leads to more people hospitalized with serious COVID infections.
Thanks for subscribing to this newsletter and for all of you who've sent me your feedback. As always, if you like this newsletter, please share it and the sign-up link with others who you think might enjoy it.
— David |
| |
|
|
%%[ if _MessageContext != "VAWP" then ]%%
Preference Center ❘ Unsubscribe You received this email because you subscribed or it was sent to you by a friend. This email was sent by: %%Member_Busname%%
%%Member_Addr%% %%Member_City%%, %%Member_State%%, %%Member_PostalCode%%
  |
%%[ endif ]%% |
|
| | |