| Welcome back to COVID in Minnesota TODAY, an email newsletter from MPR News about understanding the latest developments in Minnesota's COVID-19 outbreak. | | |
|
|
I wish I were here telling you that last week's bump in cases was just a blip, and we've resumed the decline that we thought we were starting in mid-October.
Alas, I must continue to be the bearer of bad news. For now at least, cases, positivity rate, hospitalizations and deaths all continue to rise across Minnesota.
What does it mean for the next month? That's anyone's guess. |
| |
|
|
Three things to know
| - Cases, hospitalizations and deaths continue to rise as Minnesota's fourth wave surges back into growth
- Reinfections, from people who catch COVID-19 for the second (or more) time, are accounting for around 2 percent of all confirmed cases
- Booster shot demand remains high as kids start to get vaccinated
|
| |
|
|
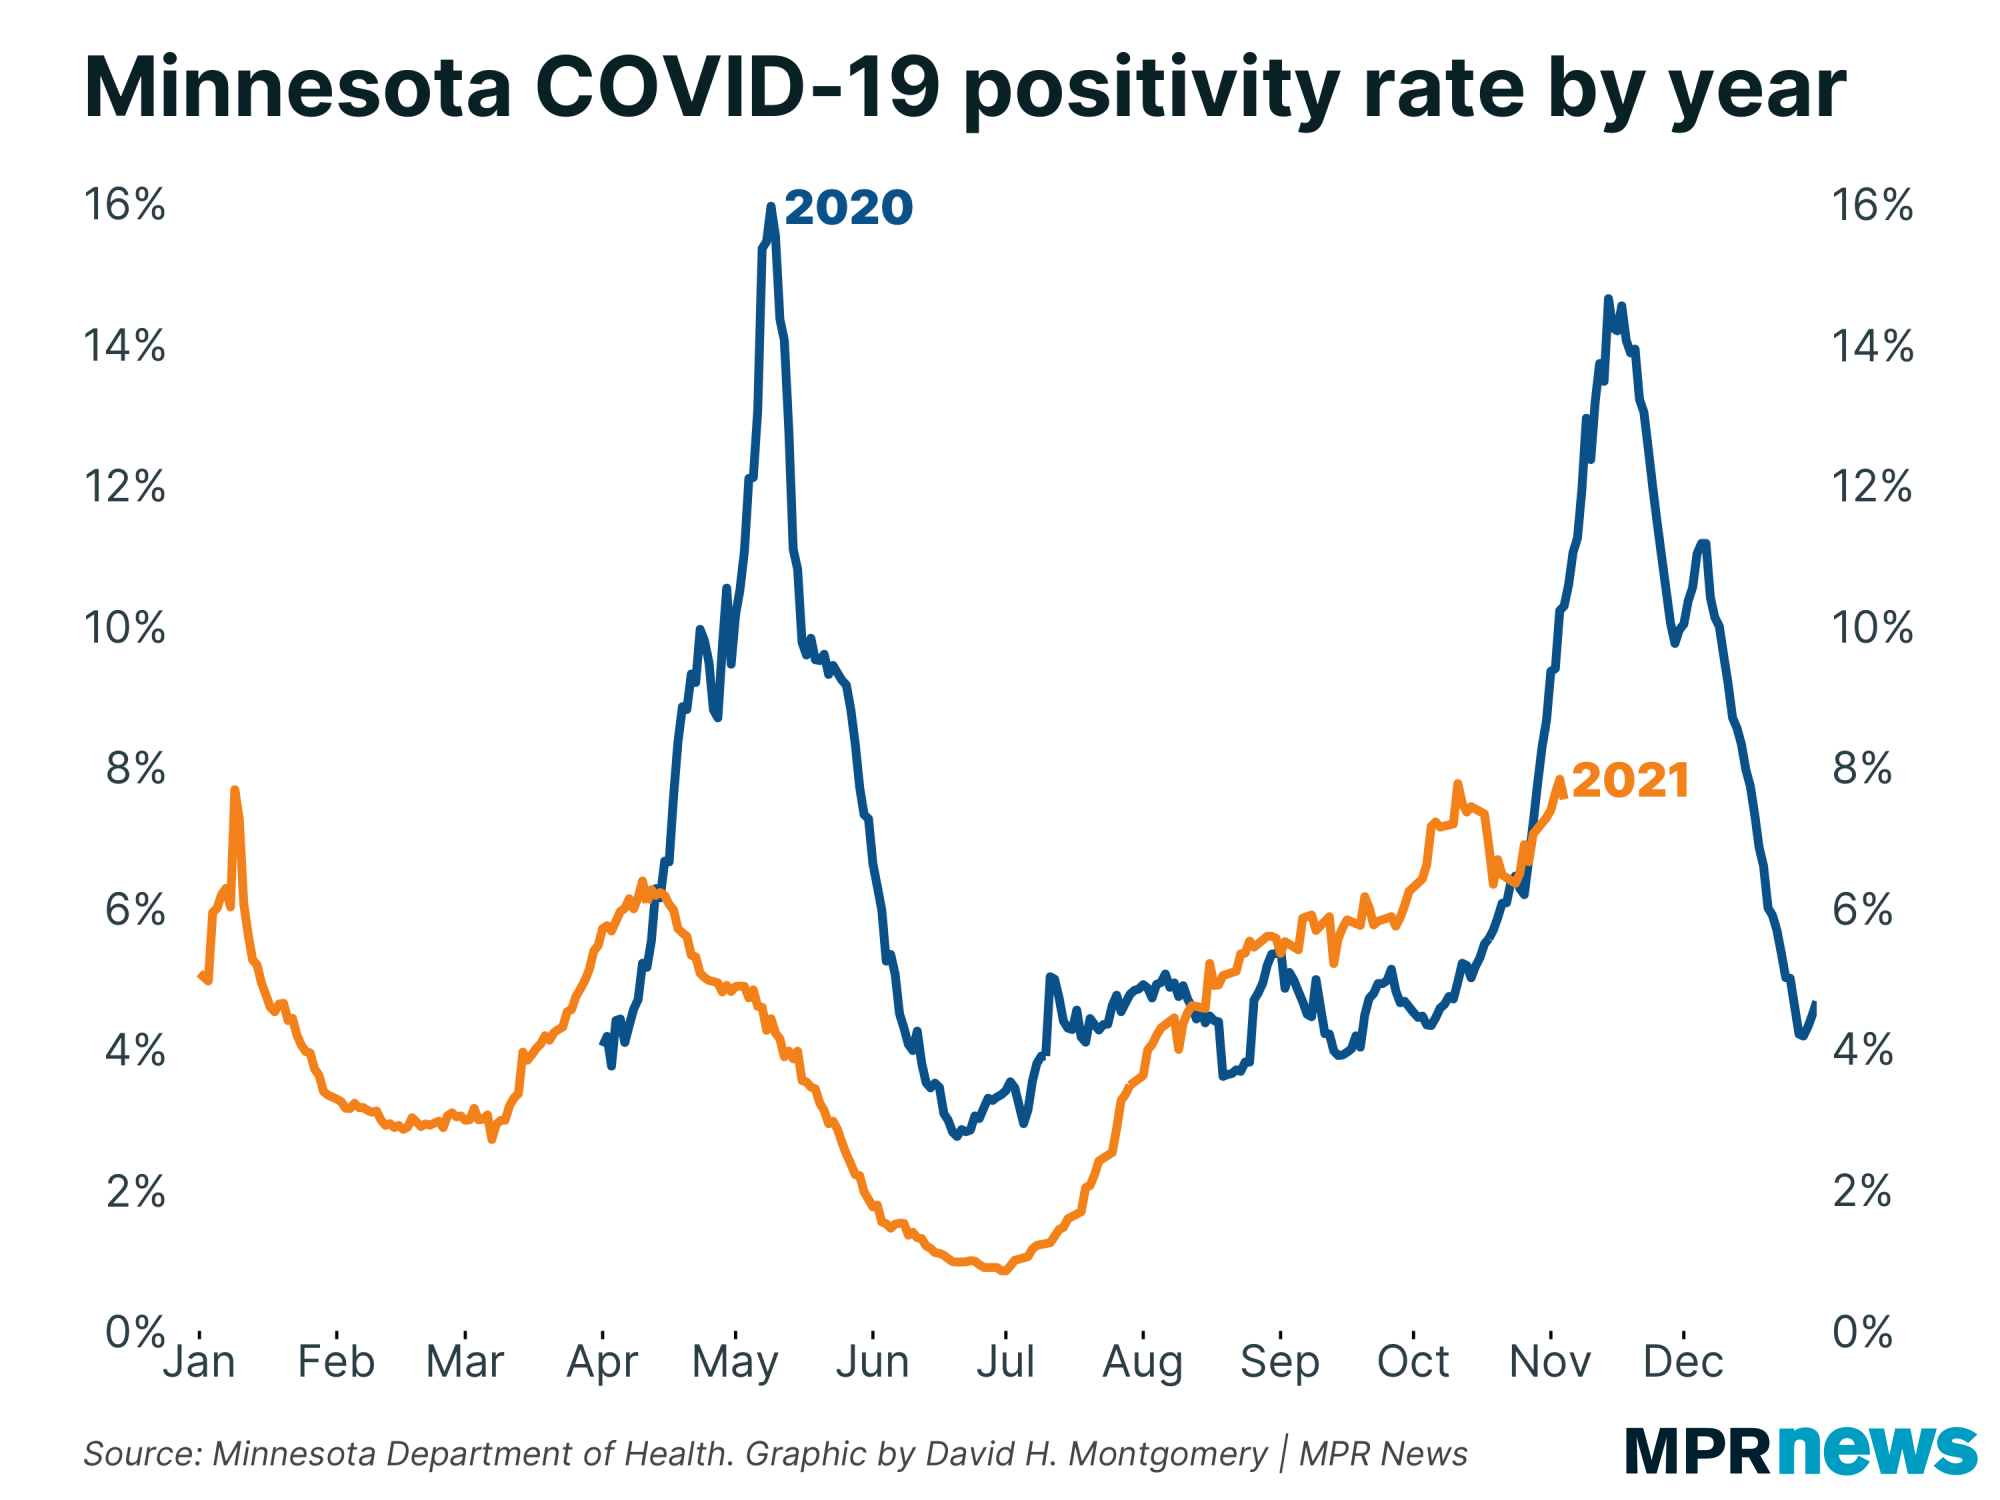
| I'm going to start out with a chart that will scare you if you're a "seasonal determinist" — someone who believes the ebbs and flows of COVID-19 are driven largely by weather rather than things under human control. This is Minnesota's positivity rate in 2020 and 2021, overlaid on top of each other. | |
|
|
|
Now, it's entirely possible that we're due for a repeat of last fall's surge, maybe a little less intense, but of comparable magnitude, as the weather cools and people start spending more time indoors where COVID spreads more easily. But I'm skeptical.
For one, while we had spring surges in 2020 and 2021, note how the 2021 surge was a month earlier. So even if seasonality plays a role, there's no reason to expect surges to line up date-for-date. "Cases rising in the fall again" is concerning; "Cases rising on Nov. 1" more likely to be coincidental.
Plus you've got the massively expanded levels of COVID-19 immunity in Minnesota's population right now. Last November, per covidestim.org, perhaps 10 to 15 percent of Minnesotans had ever been infected with COVID-19, and 0 percent had been vaccinated. Right now, it's closer to 50 percent ever infected and 65 percent vaccinated. How those two interact we don't know exactly, but some estimates are that more than 80 percent of Minnesotans have either a vaccination or prior infection or both. Breakthroughs and reinfections do happen, and the delta variant is much more infectious than past versions of the disease.
So this may be wishful thinking on my part, but I'm convinced that we're not going to see a big fall spike in 2021 — that we're already in the middle of our big spike, and that the next month or two holds more drops than surges. After all, all diseases eventually it burn through the susceptible population and fade, just as all our past waves did. No matter how much it might feel like it sometimes, this fourth wave won't last forever.
But I don't trust myself on this at all. I've been wrong about its impending end at least twice now. And — not an exact comparison, because COVID isn't random — just because you've flipped heads 10 times in a row doesn't mean your odds of getting tails on the next flip are any greater than 50-50.
At this point I'm just in wait-and-see mood. Is the surge of the last few weeks going to continue to accelerate into the holidays? Will it turn around next week? I know what I'm hoping will happen, but hope doesn't make things happen.
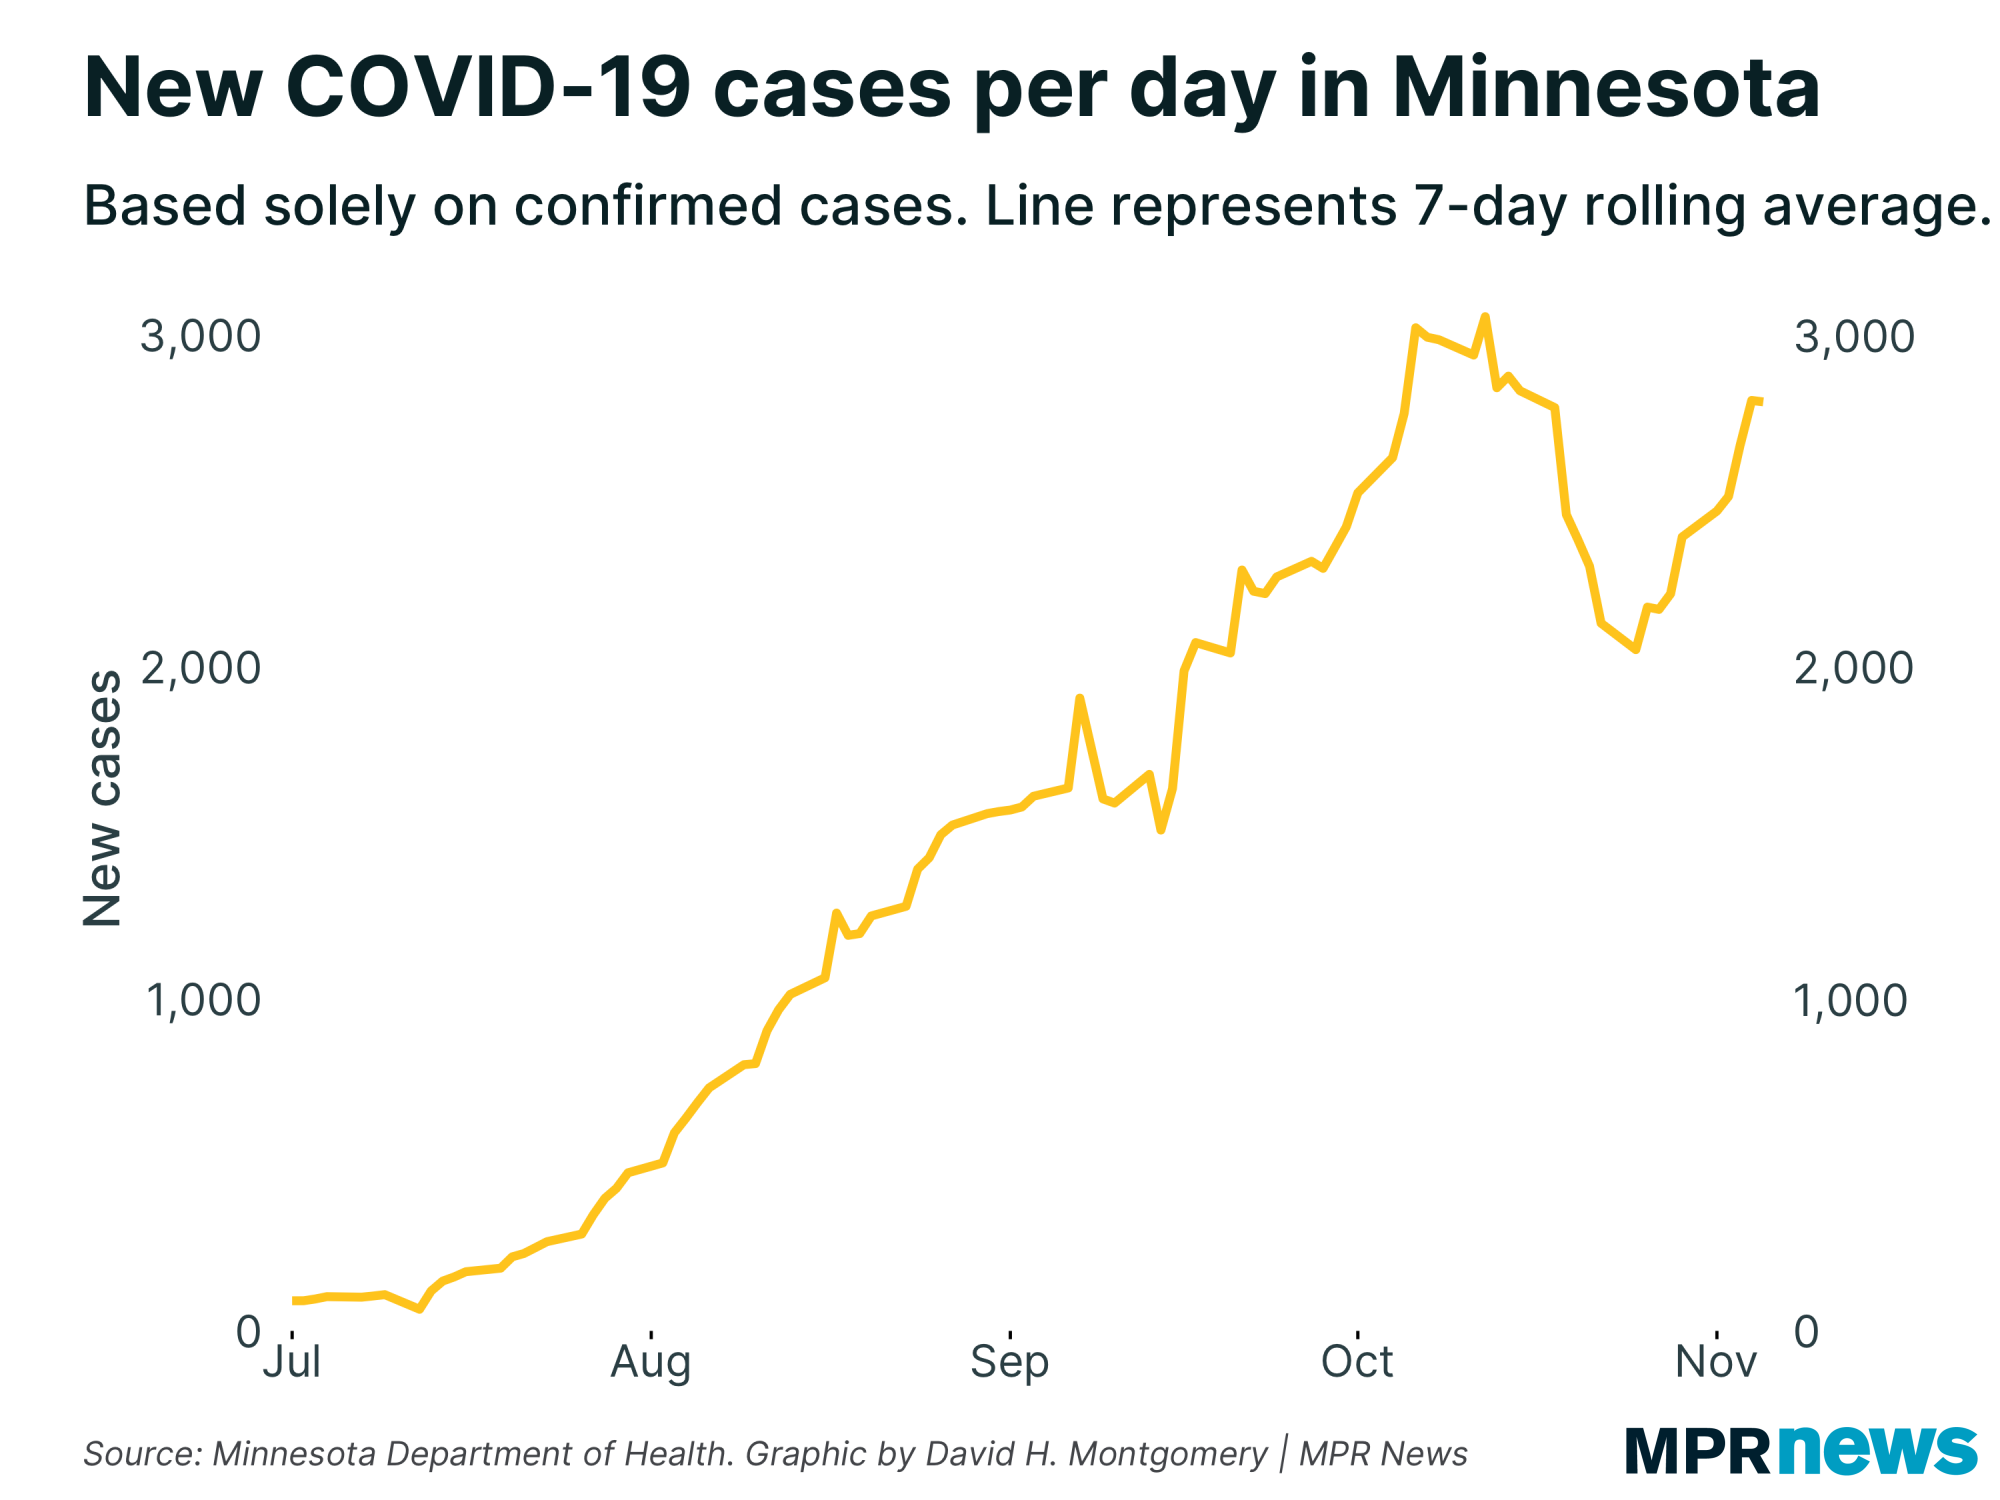
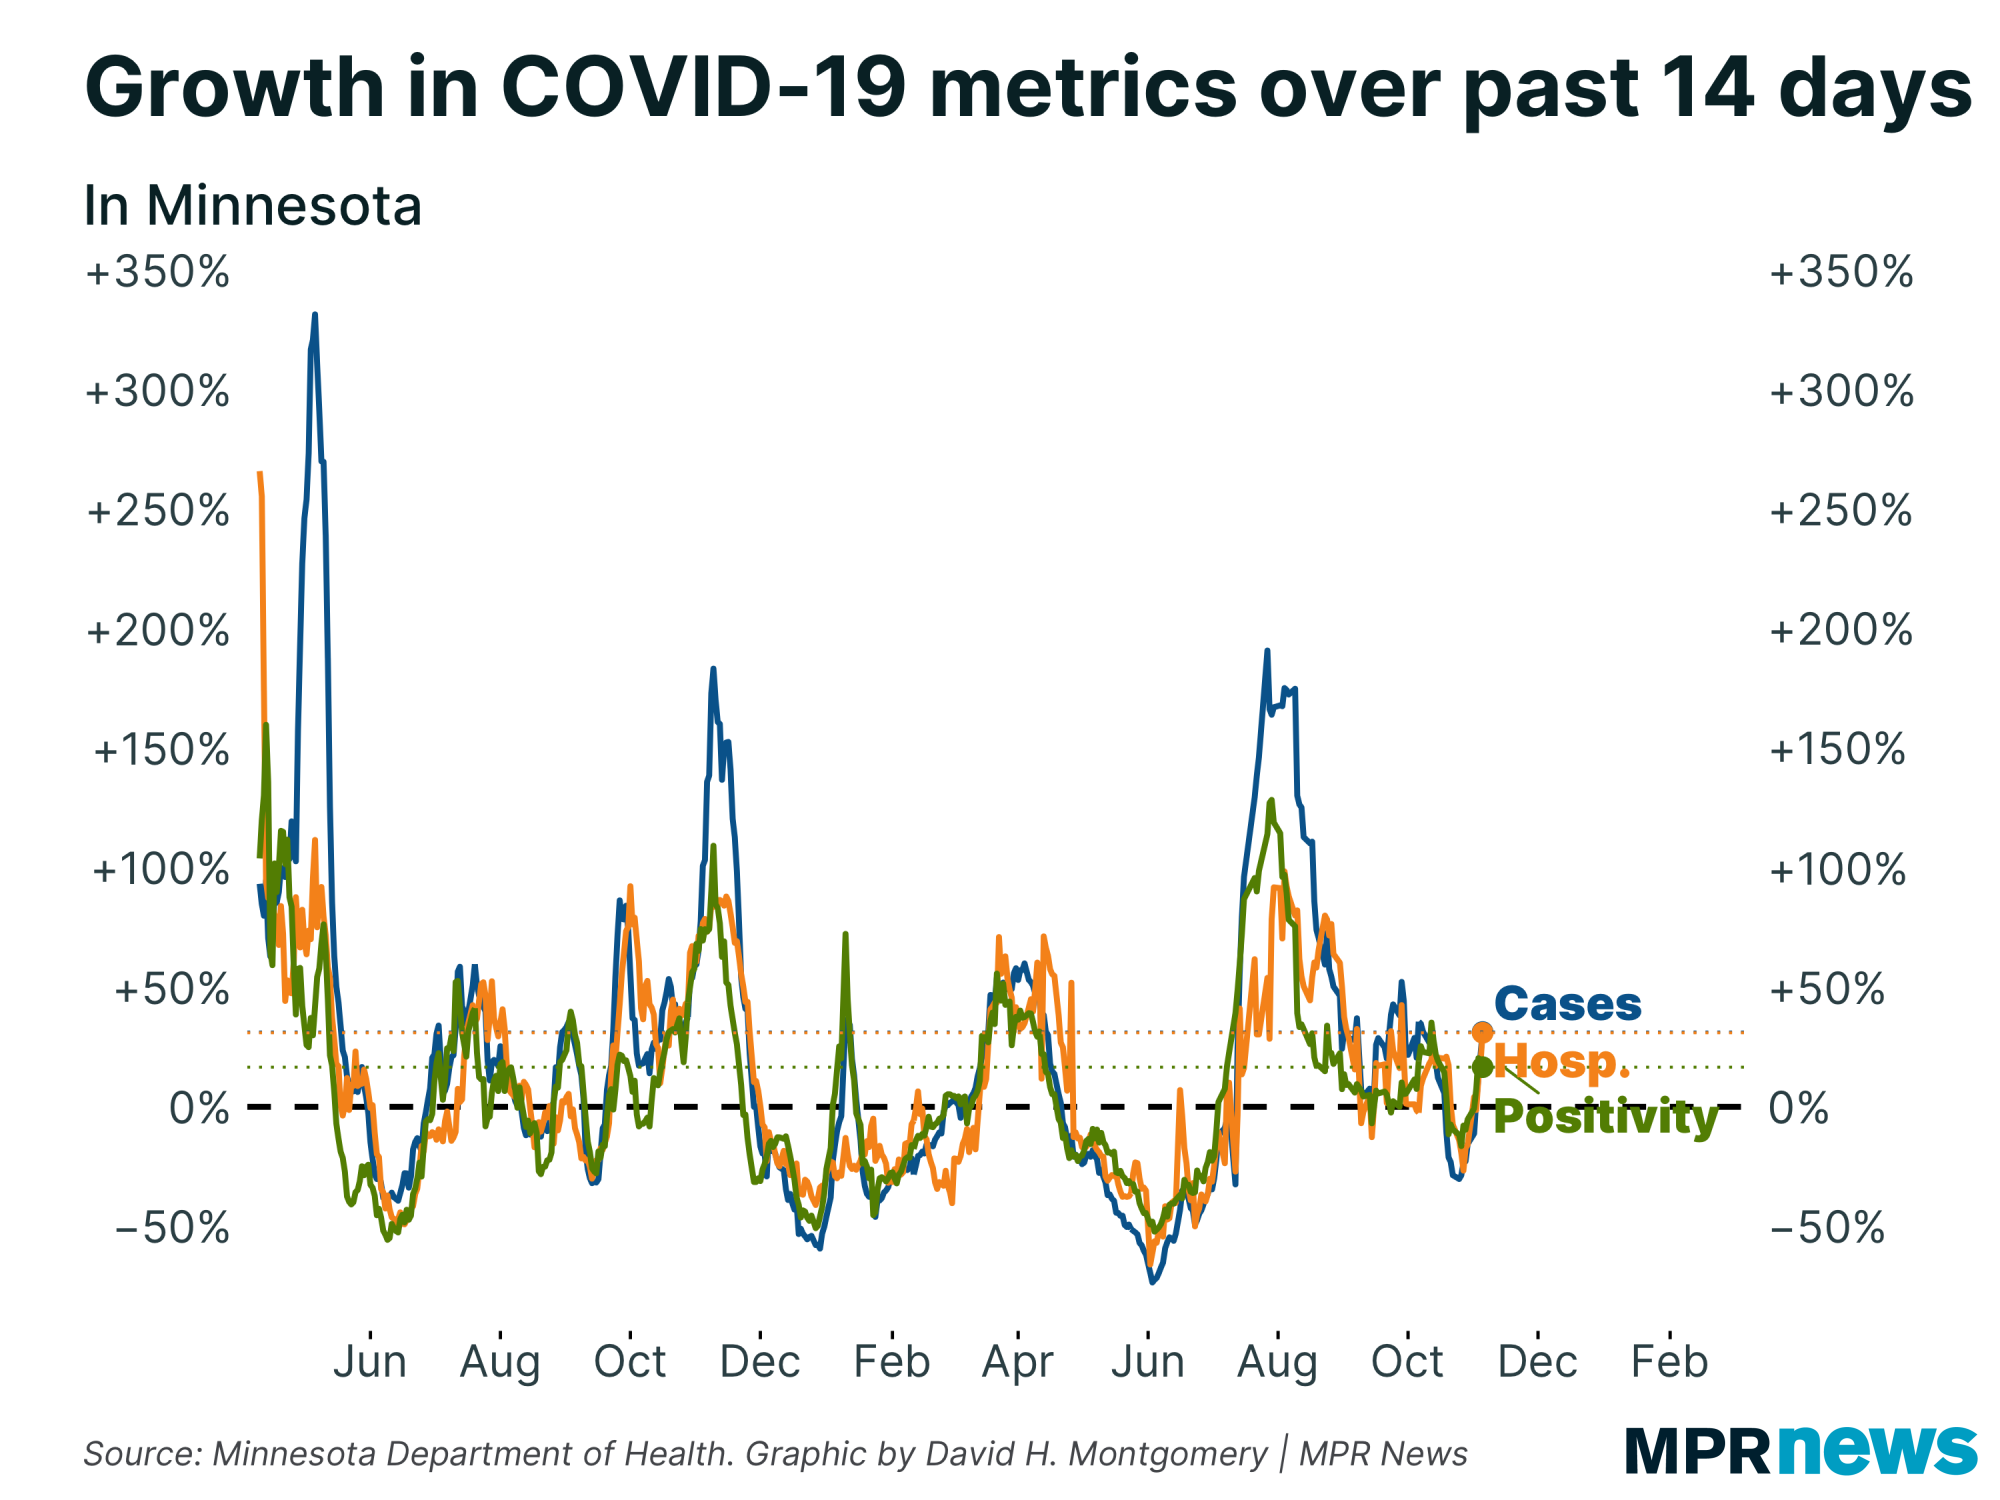
In any case, the week since my last newsletter was pretty much all bad news for Minnesota. Average daily case counts went up by just under 20 percent. |
| |
|
|
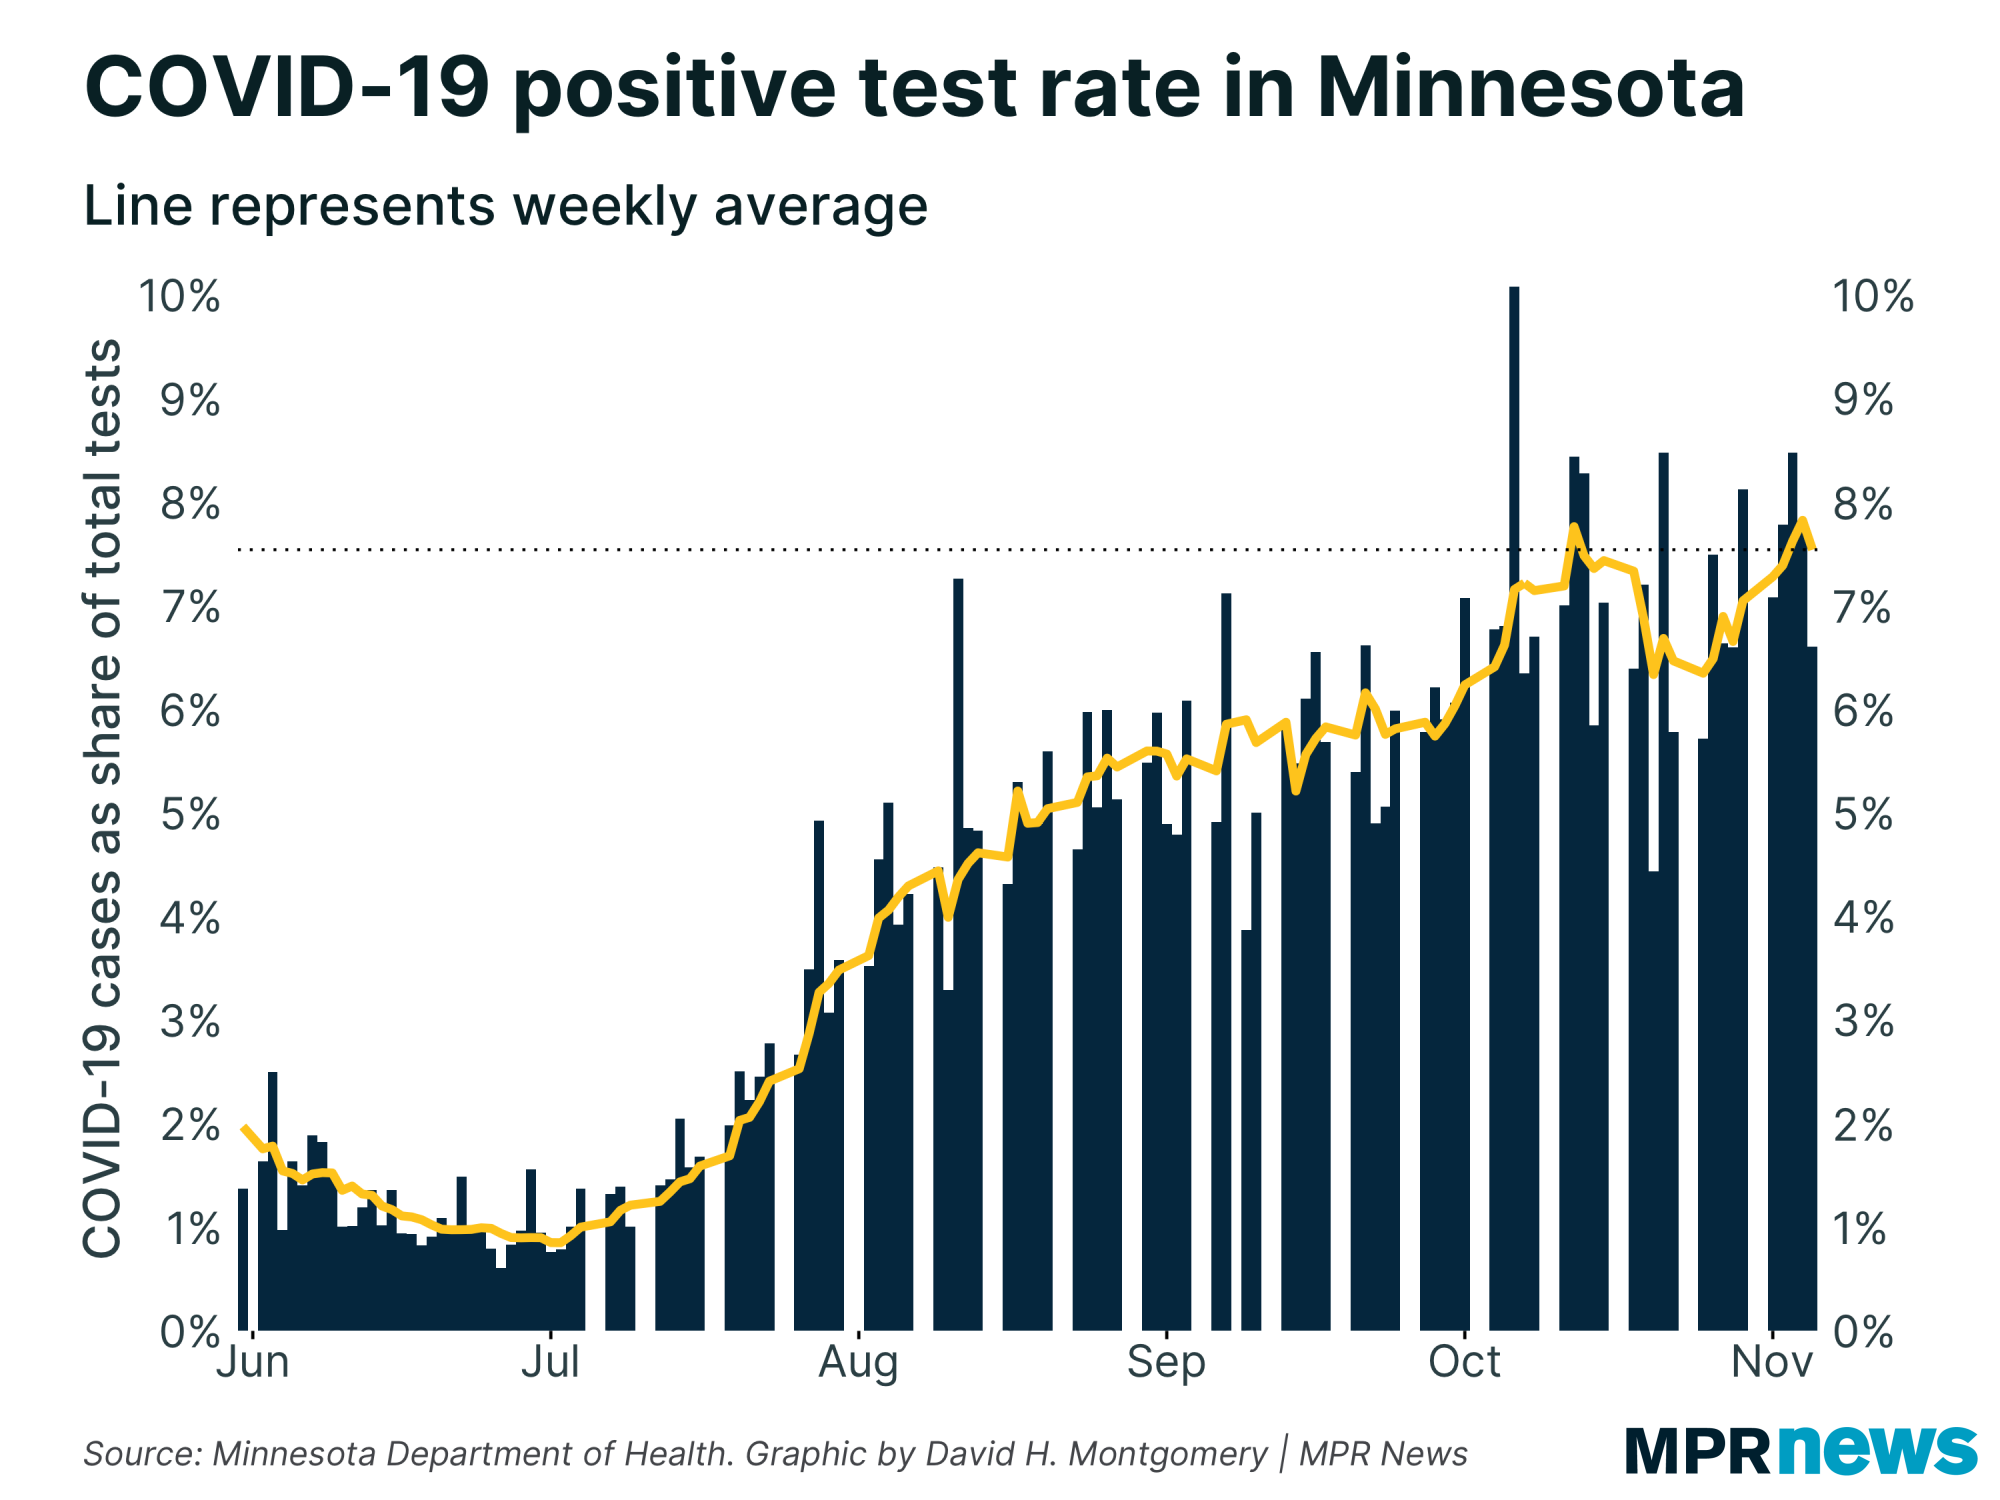
| And while cases remain a little below the October peak, positivity rate has already exceeded it (driven by slightly lower testing volumes), despite a very minor downtick in today's report. | | |
|
|
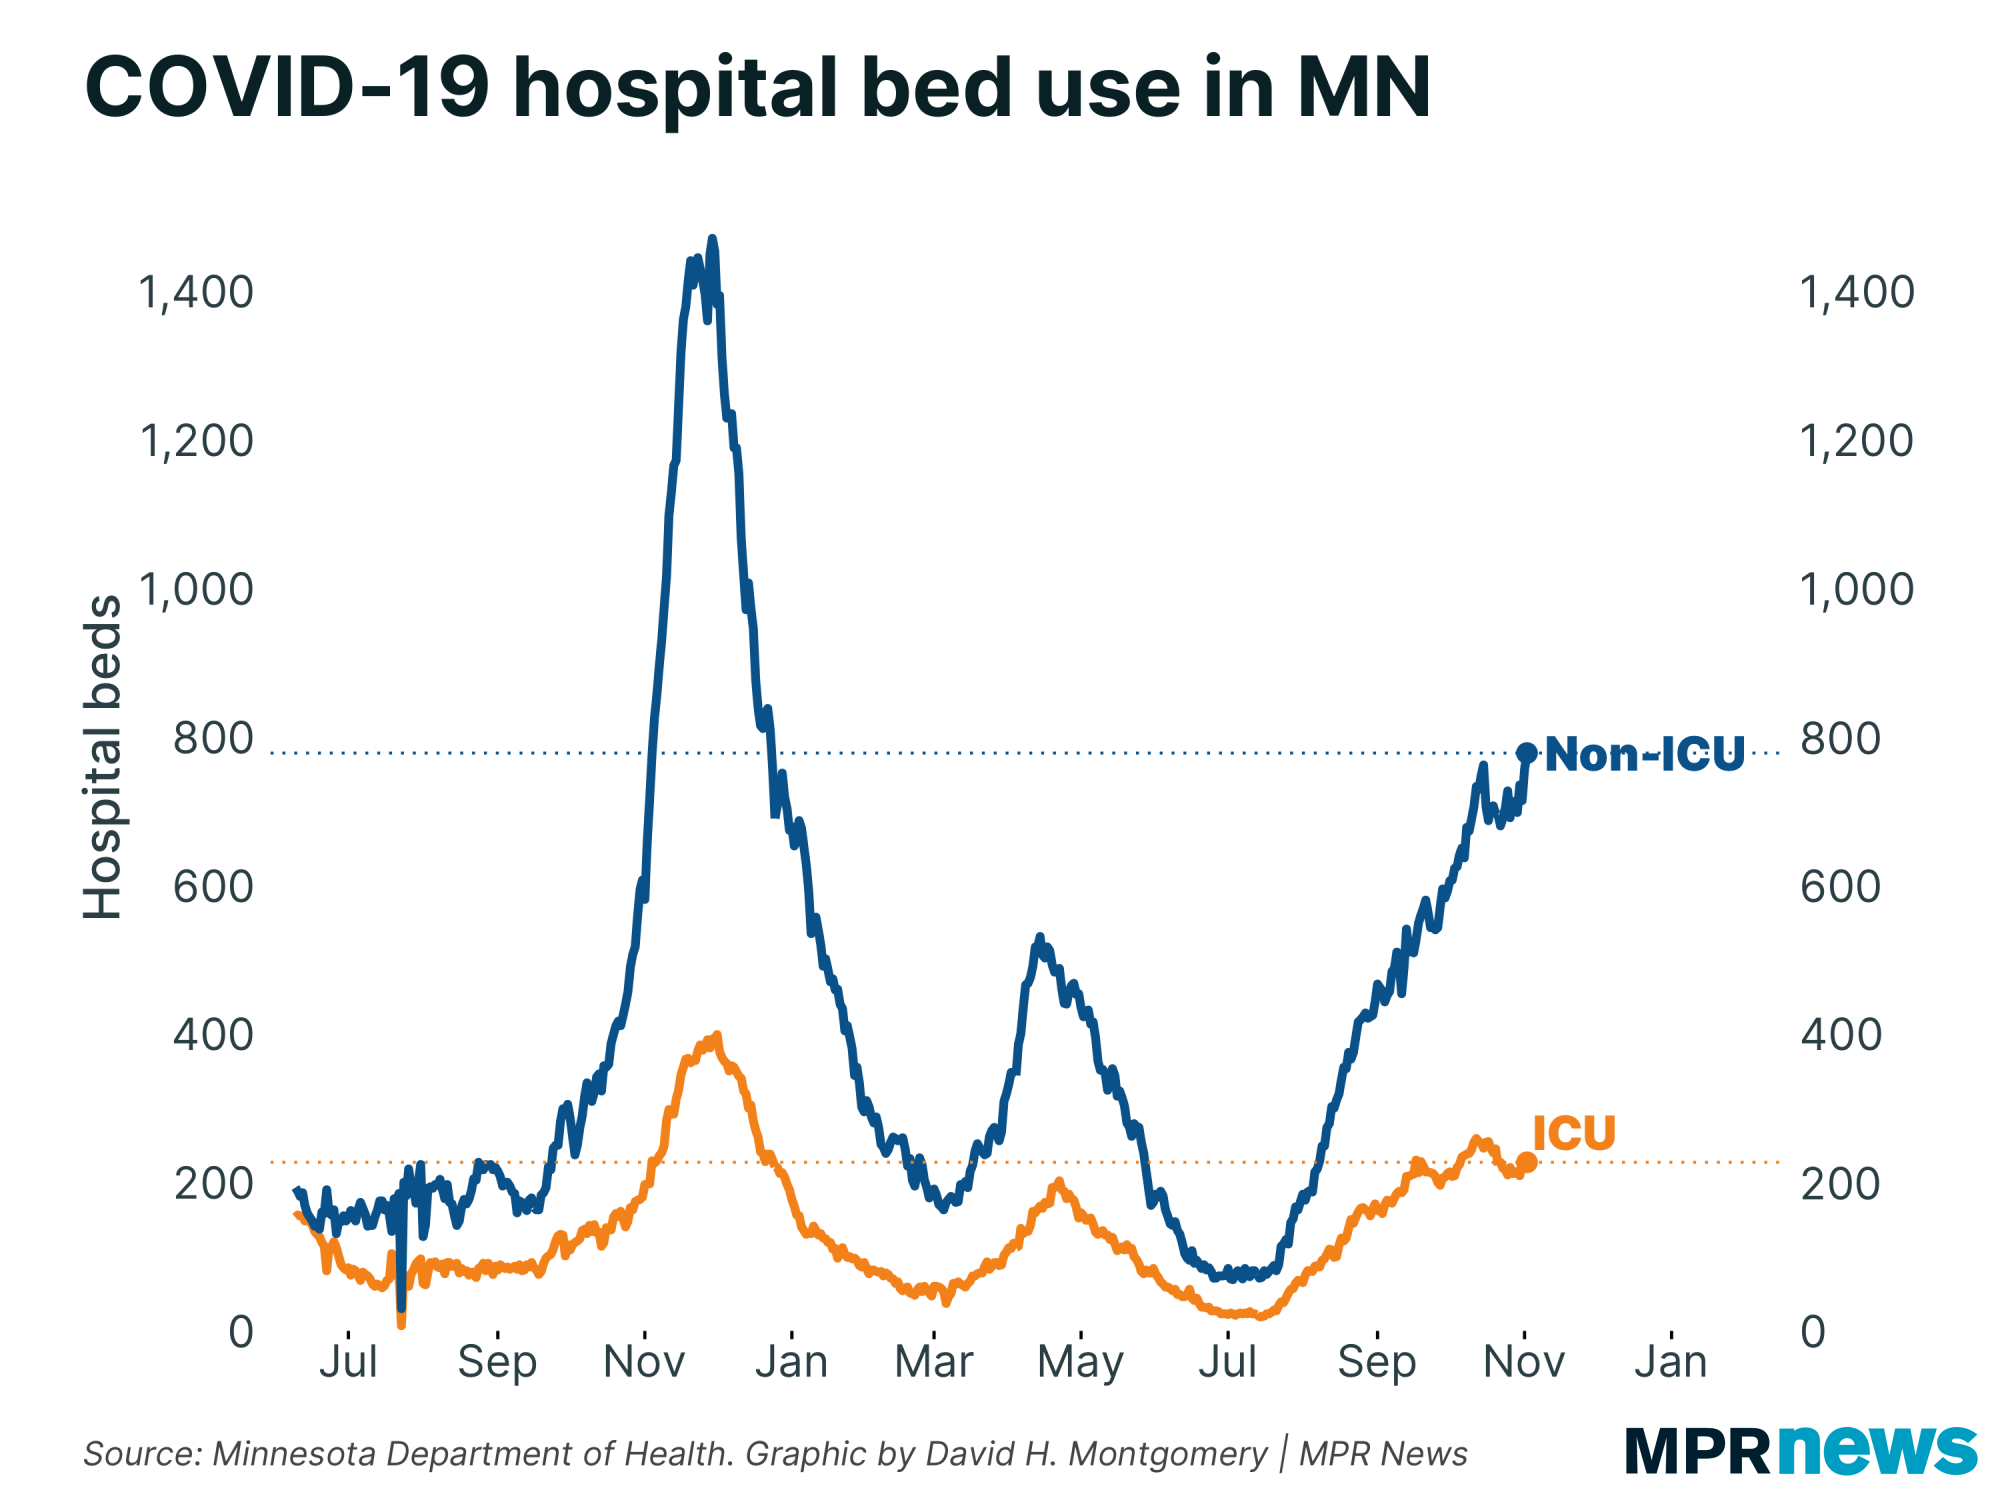
| Nor is it just all minor cases of sniffles among kids and the vaccinated. COVID-19 hospitalizations are up, too. | | |
|
|
| Most worrisome, these metrics are not just growing, but accelerating. We can't console ourselves that "cases are rising, but at least they're rising more slowly." COVID has its foot on the gas. | | |
|
|
Unfortunately, the health department on Monday updated its stats to include backlogged incidents of reinfections — COVID cases among people who already had COVID. That's good that we're now getting this, but it has completely skewed a lot of our "under-the-hood" measures for tracking COVID-19. I can adjust my topline figures to exclude the roughly 8,000 backlogged reinfections, but there's no way to do this for cases by county, age group or race. We'll just have to wait until next week to get a sense of how new COVID-19 infections are distributed throughout the state.
(A sign of why it's good to just wait and let this kind of stuff pass through the system? That same covidestim.org model I referenced earlier is currently hyperventilating, estimating current infections in Minnesota to be higher than ever. But that's almost certainly because it doesn't know that the 8,000 extra cases dumped on Monday weren't new, and is instead reading it as an exploding outbreak.)
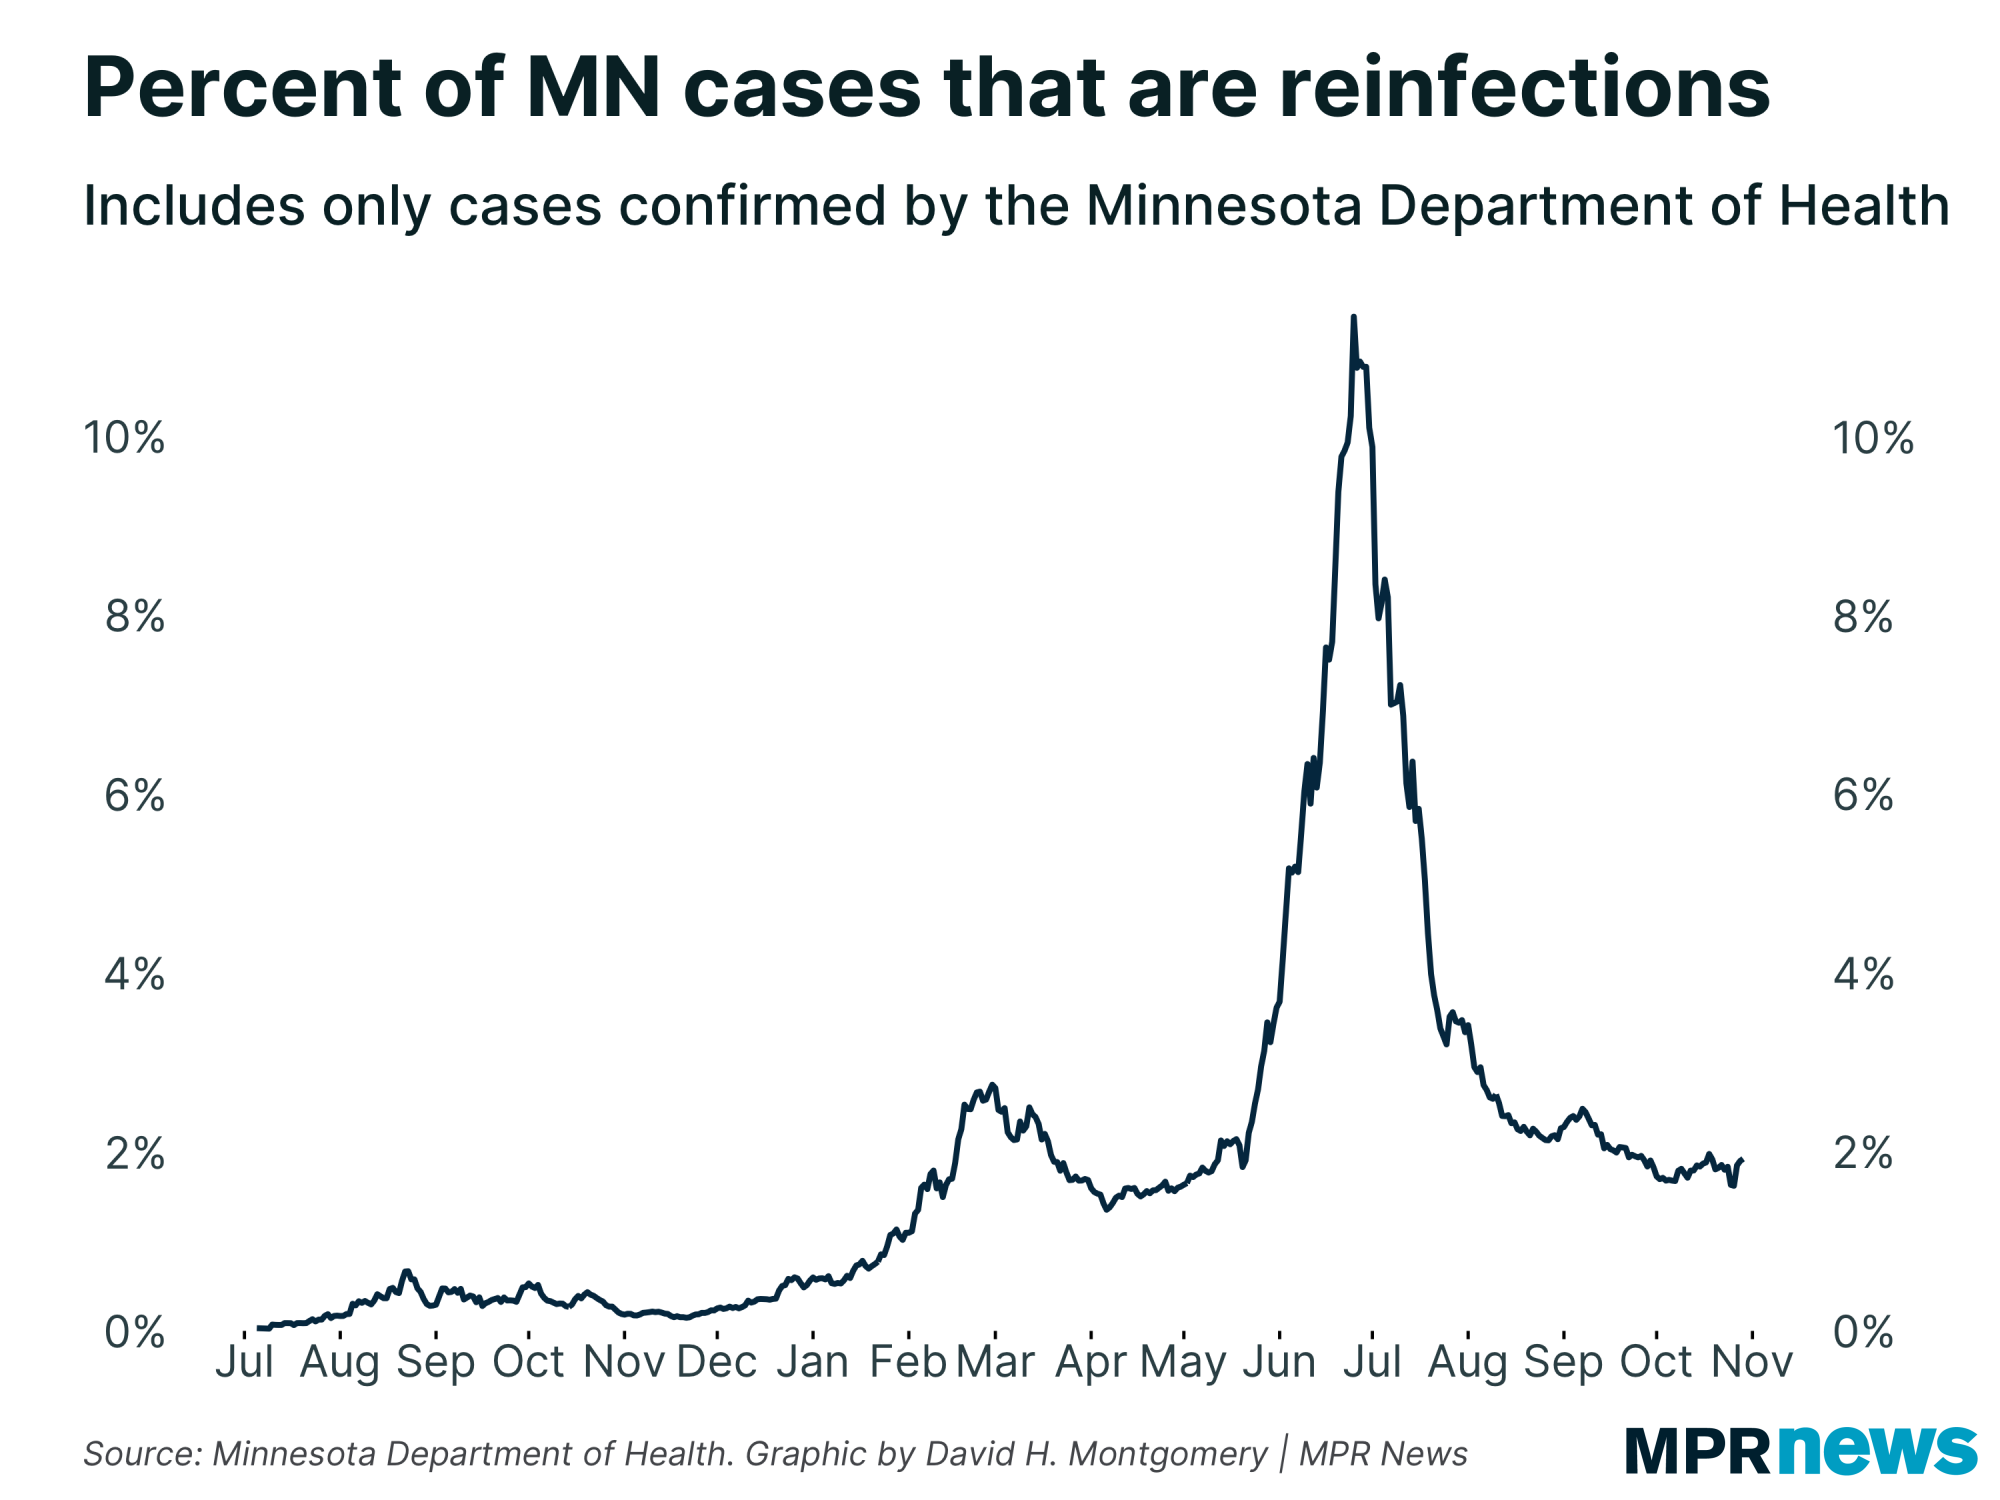
That reinfection data is interesting, though. Here's the percent of all confirmed Minnesota COVID-19 cases that were reinfections. As you can see, it's pretty low, somewhere around 2 percent of all confirmed cases. But there was an exception: back in June and July, when overall case prevalence was really low, but up to 10 percent of cases we did catch we reinfections. |
| |
|
|
Below, I'll explore a few more stats about Minnesota's COVID-19 outbreak. If you want to learn more, I also recommend these other articles:
| |
|
|
|
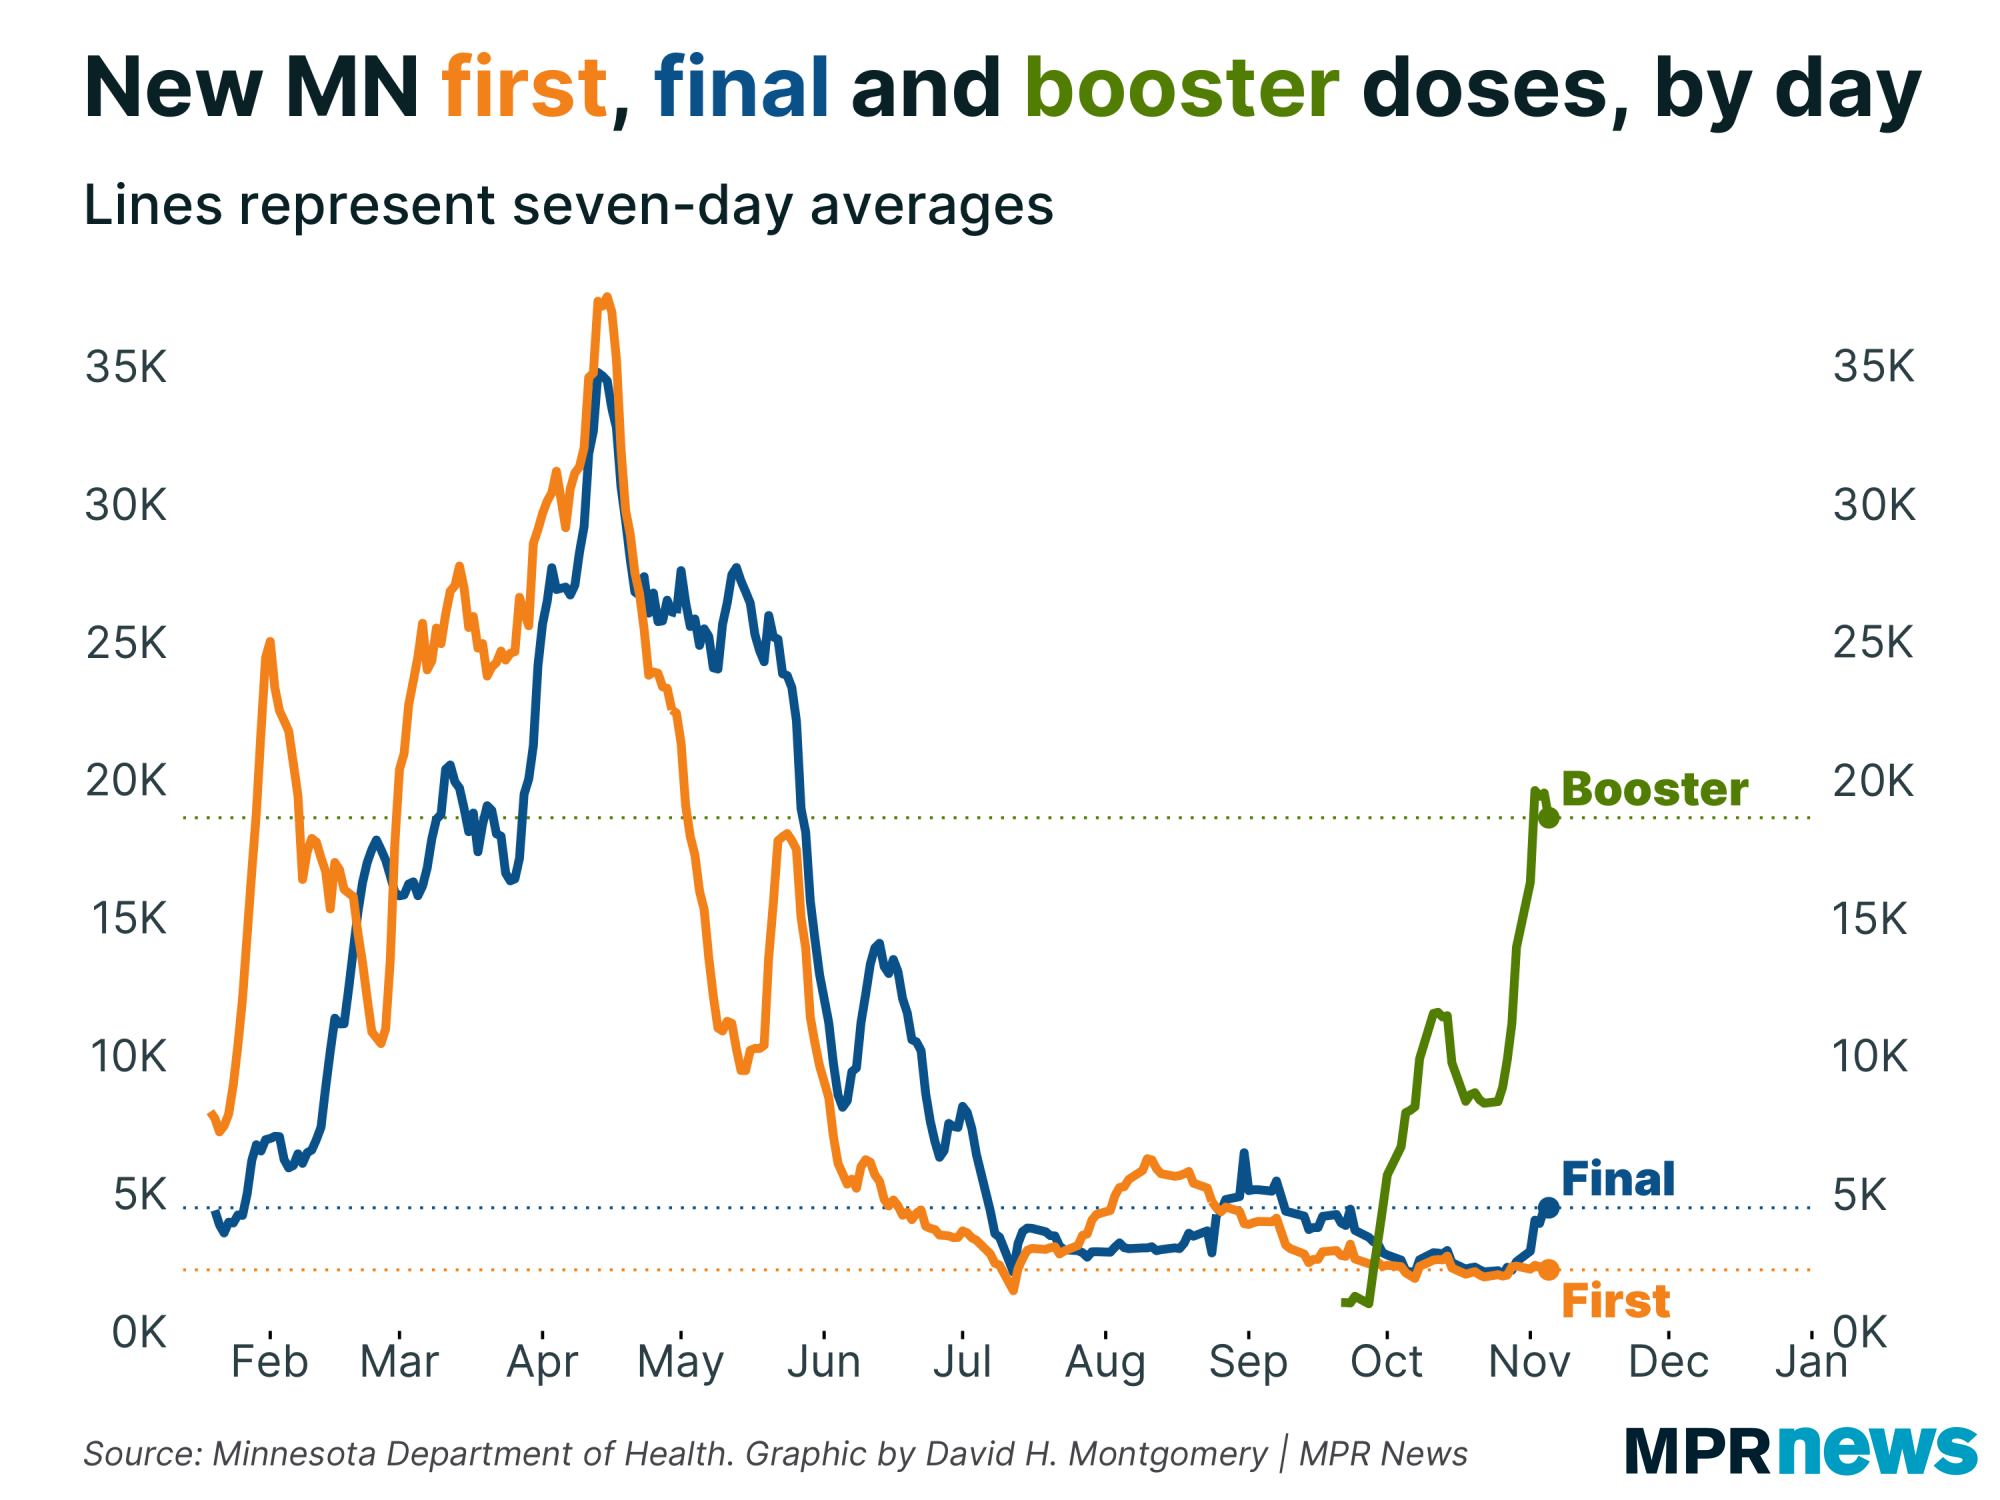
| Boosters soar as kids start to get shots | | Last week I reported on rising rates of COVID-19 booster shots. Those have continued to rise this week. | |
|
|
|
That new first dose line is still flat, but expect it to erupt upward next week. Today's report saw the first tiny trickle of data on vaccinated 5- to 11-year-olds. Next week will see a flood of this newly eligible group, perhaps as many as 100,000 people total, or an average of up to 15,000 per day.
The pace will likely slow after that, once the highest-demand parents get their kids vaccinated, but we'll stay above our current basement of around 2,000 doses per day for some time.
What remains to be seen is how these new vaccinations will impact the spread of the disease. As I documented last week, 5- to 11-year-olds are about a quarter of unvaccinated Minnesotans, and if one-third of them get vaccinated that would be about 3 percent of the population. That's not much. But it'd be a significant percentage of one of the major low-immunity reservoirs in Minnesota — schools. So the degree to which school infections are driving our current wave, this could — but is certainly not guaranteed to — have an outsized impact. |
| |
|
|
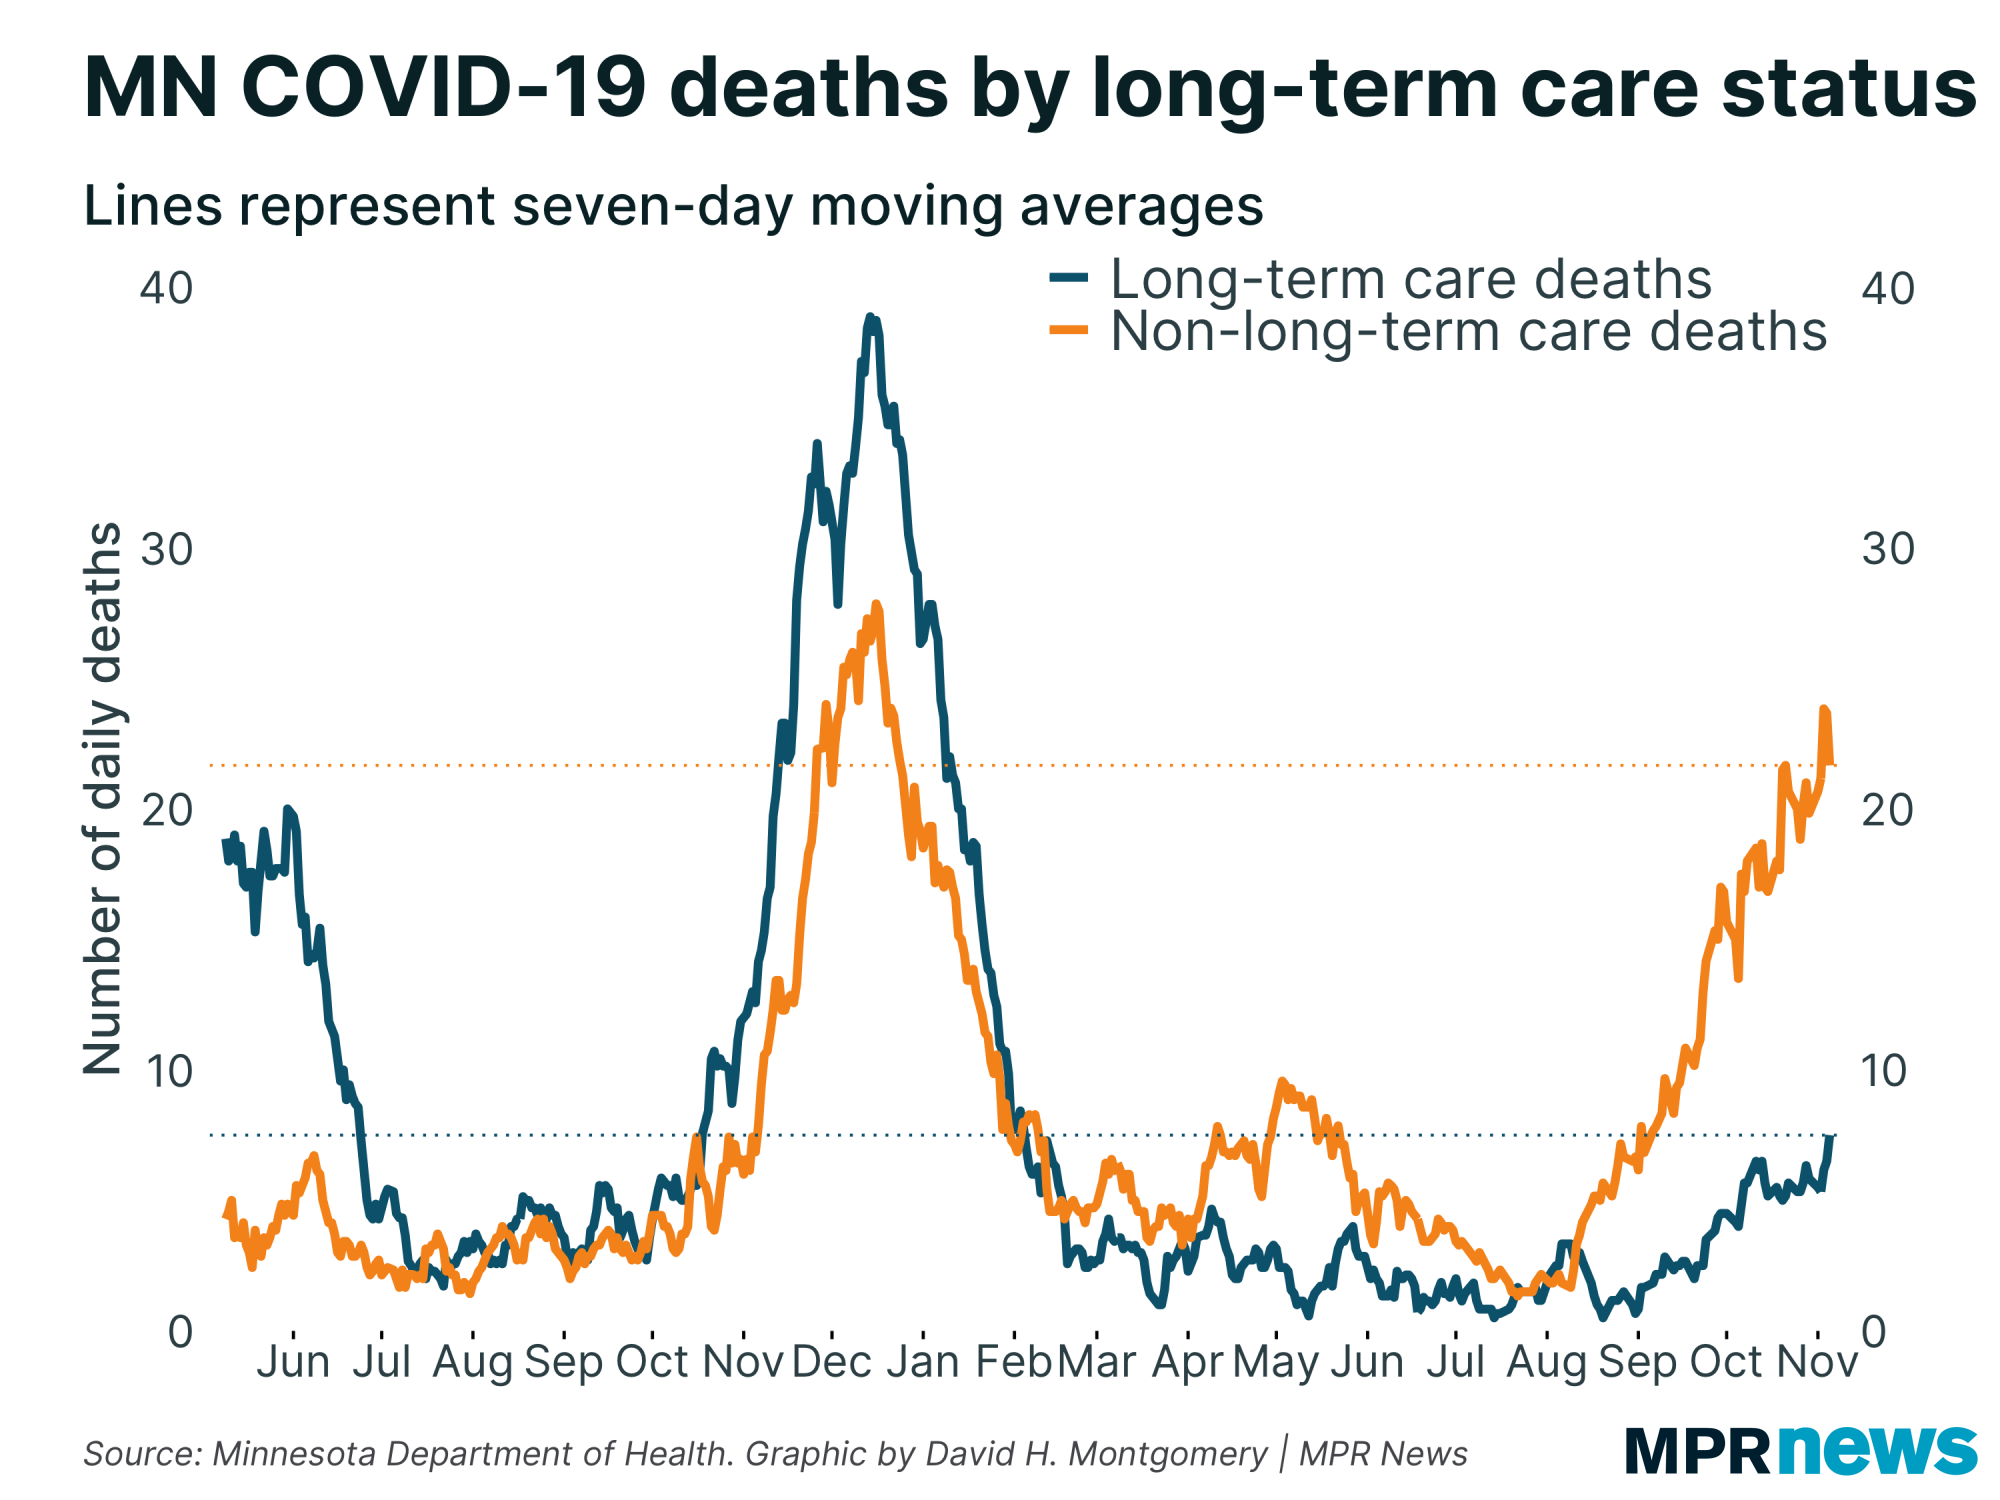
Deaths continue to rise
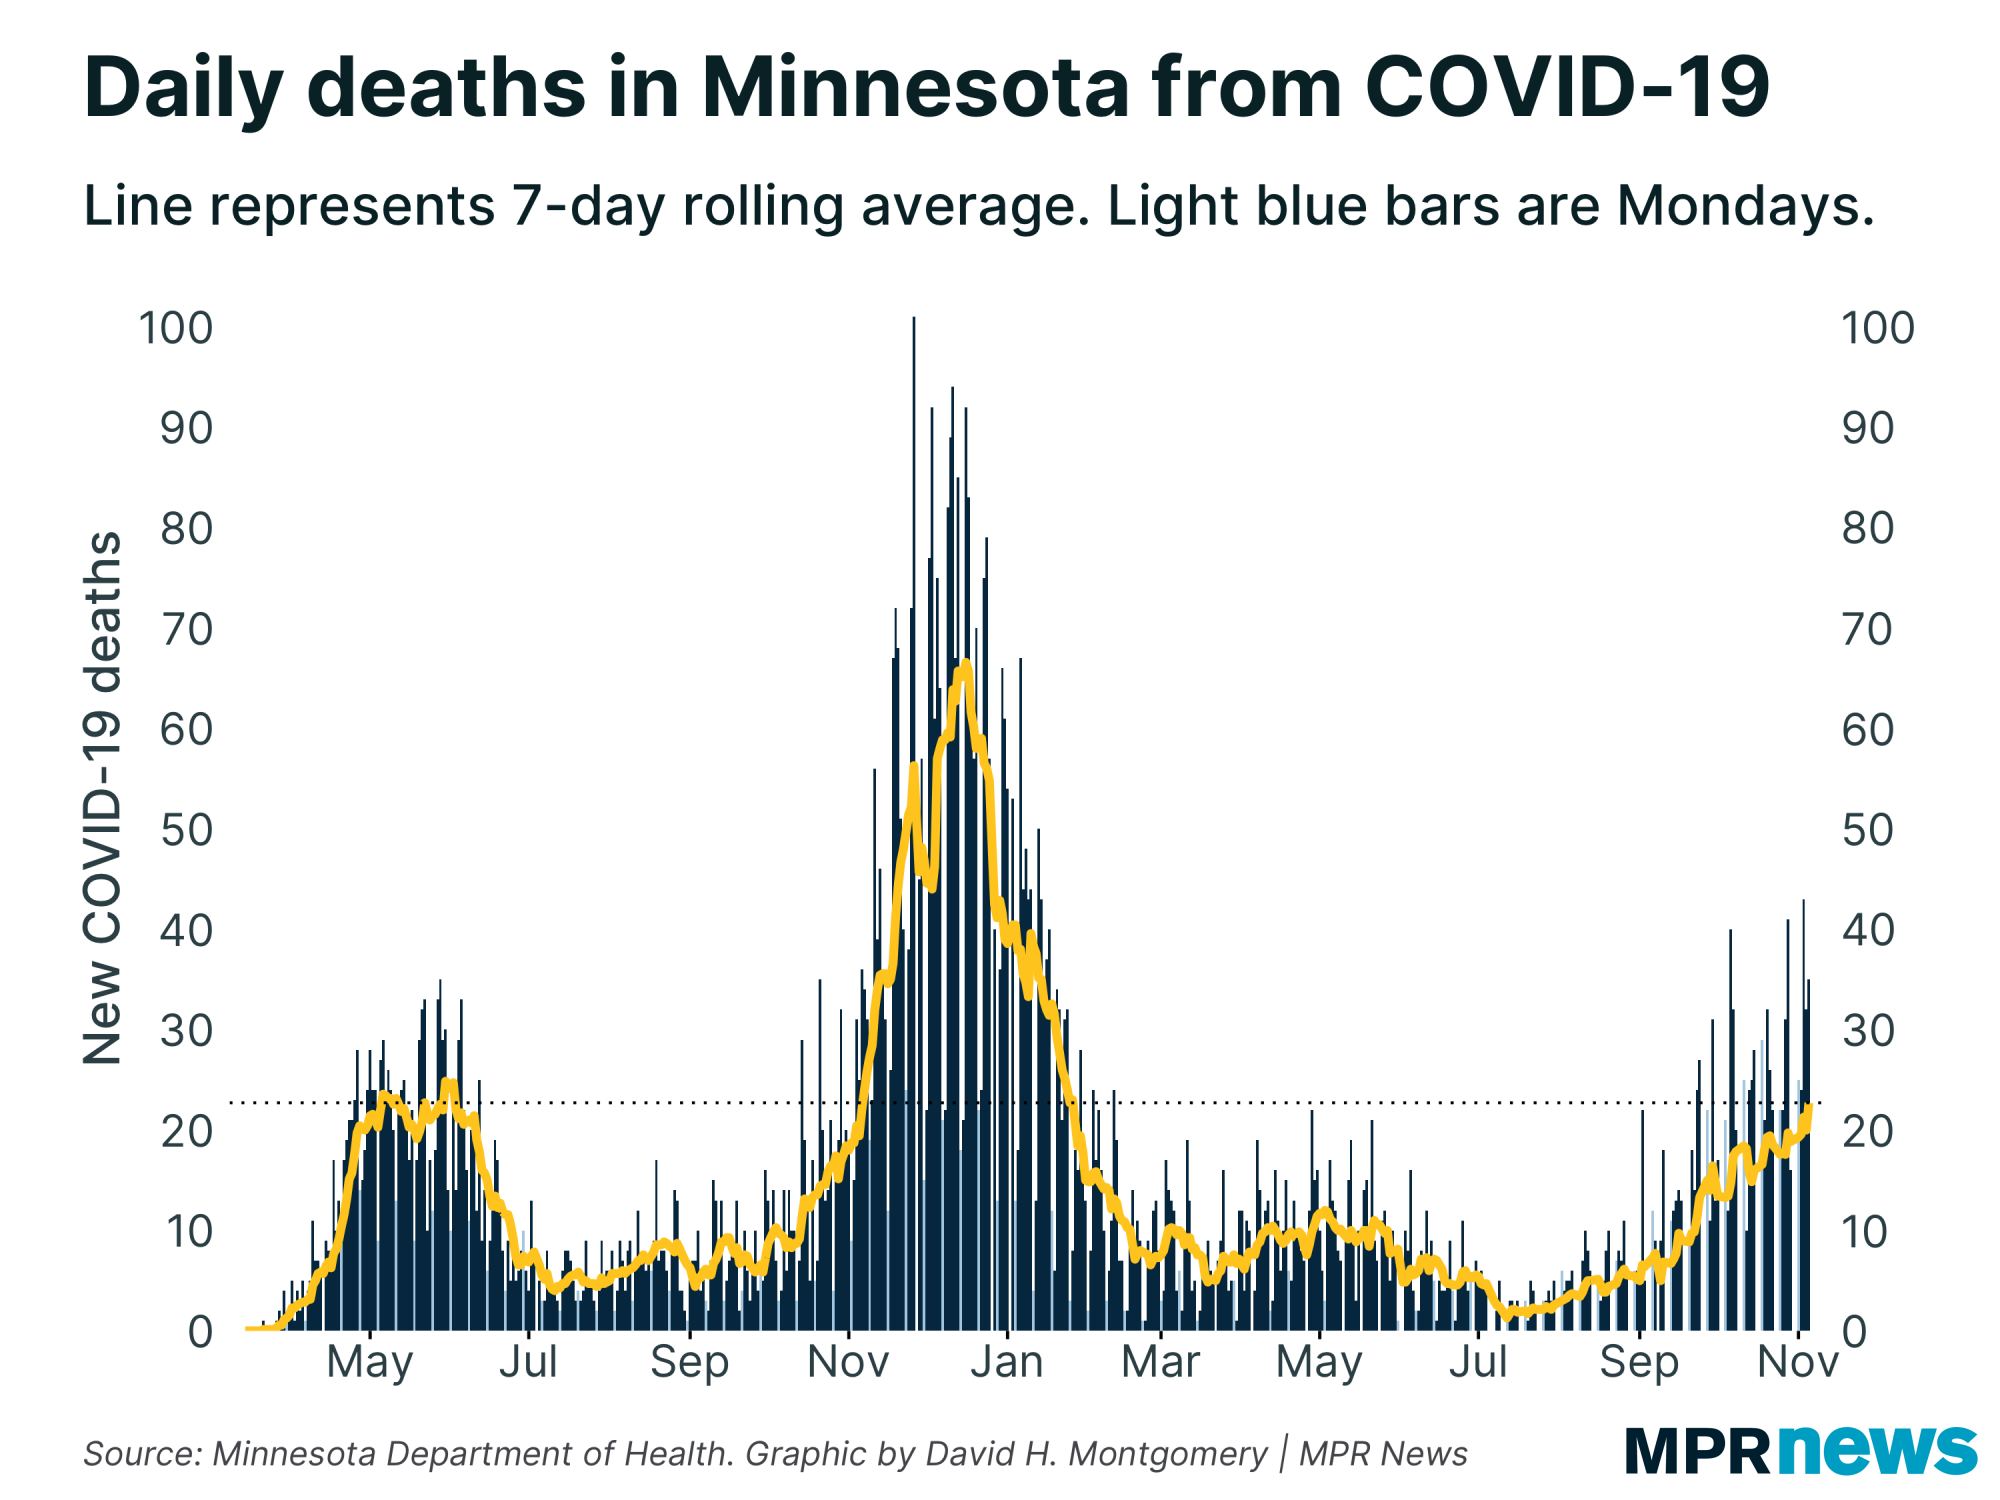
| | As expected, COVID-19 death rates continue to rise in Minnesota. That's expected because death rates tend to lag cases by at least several weeks, and cases remain extremely elevated. Deaths are at their highest level since January, and likely will keep trending upward for at least another month. (And if we see a dip, we need to wait and make sure it's not just an echo of the temporary case dip we saw.) |
| |
|
|
| You'll note that our current COVID-19 death rate comparable to what we saw in the Spring 2020 wave. That's when the virus rampaged through nursing homes. But deaths now are largely outside of nursing homes. In fact, deaths outside of long-term care facilities are not too far off from their Fall 2020 peak, while nursing home deaths are a fraction of their 2020 peaks. |
| |
|
|
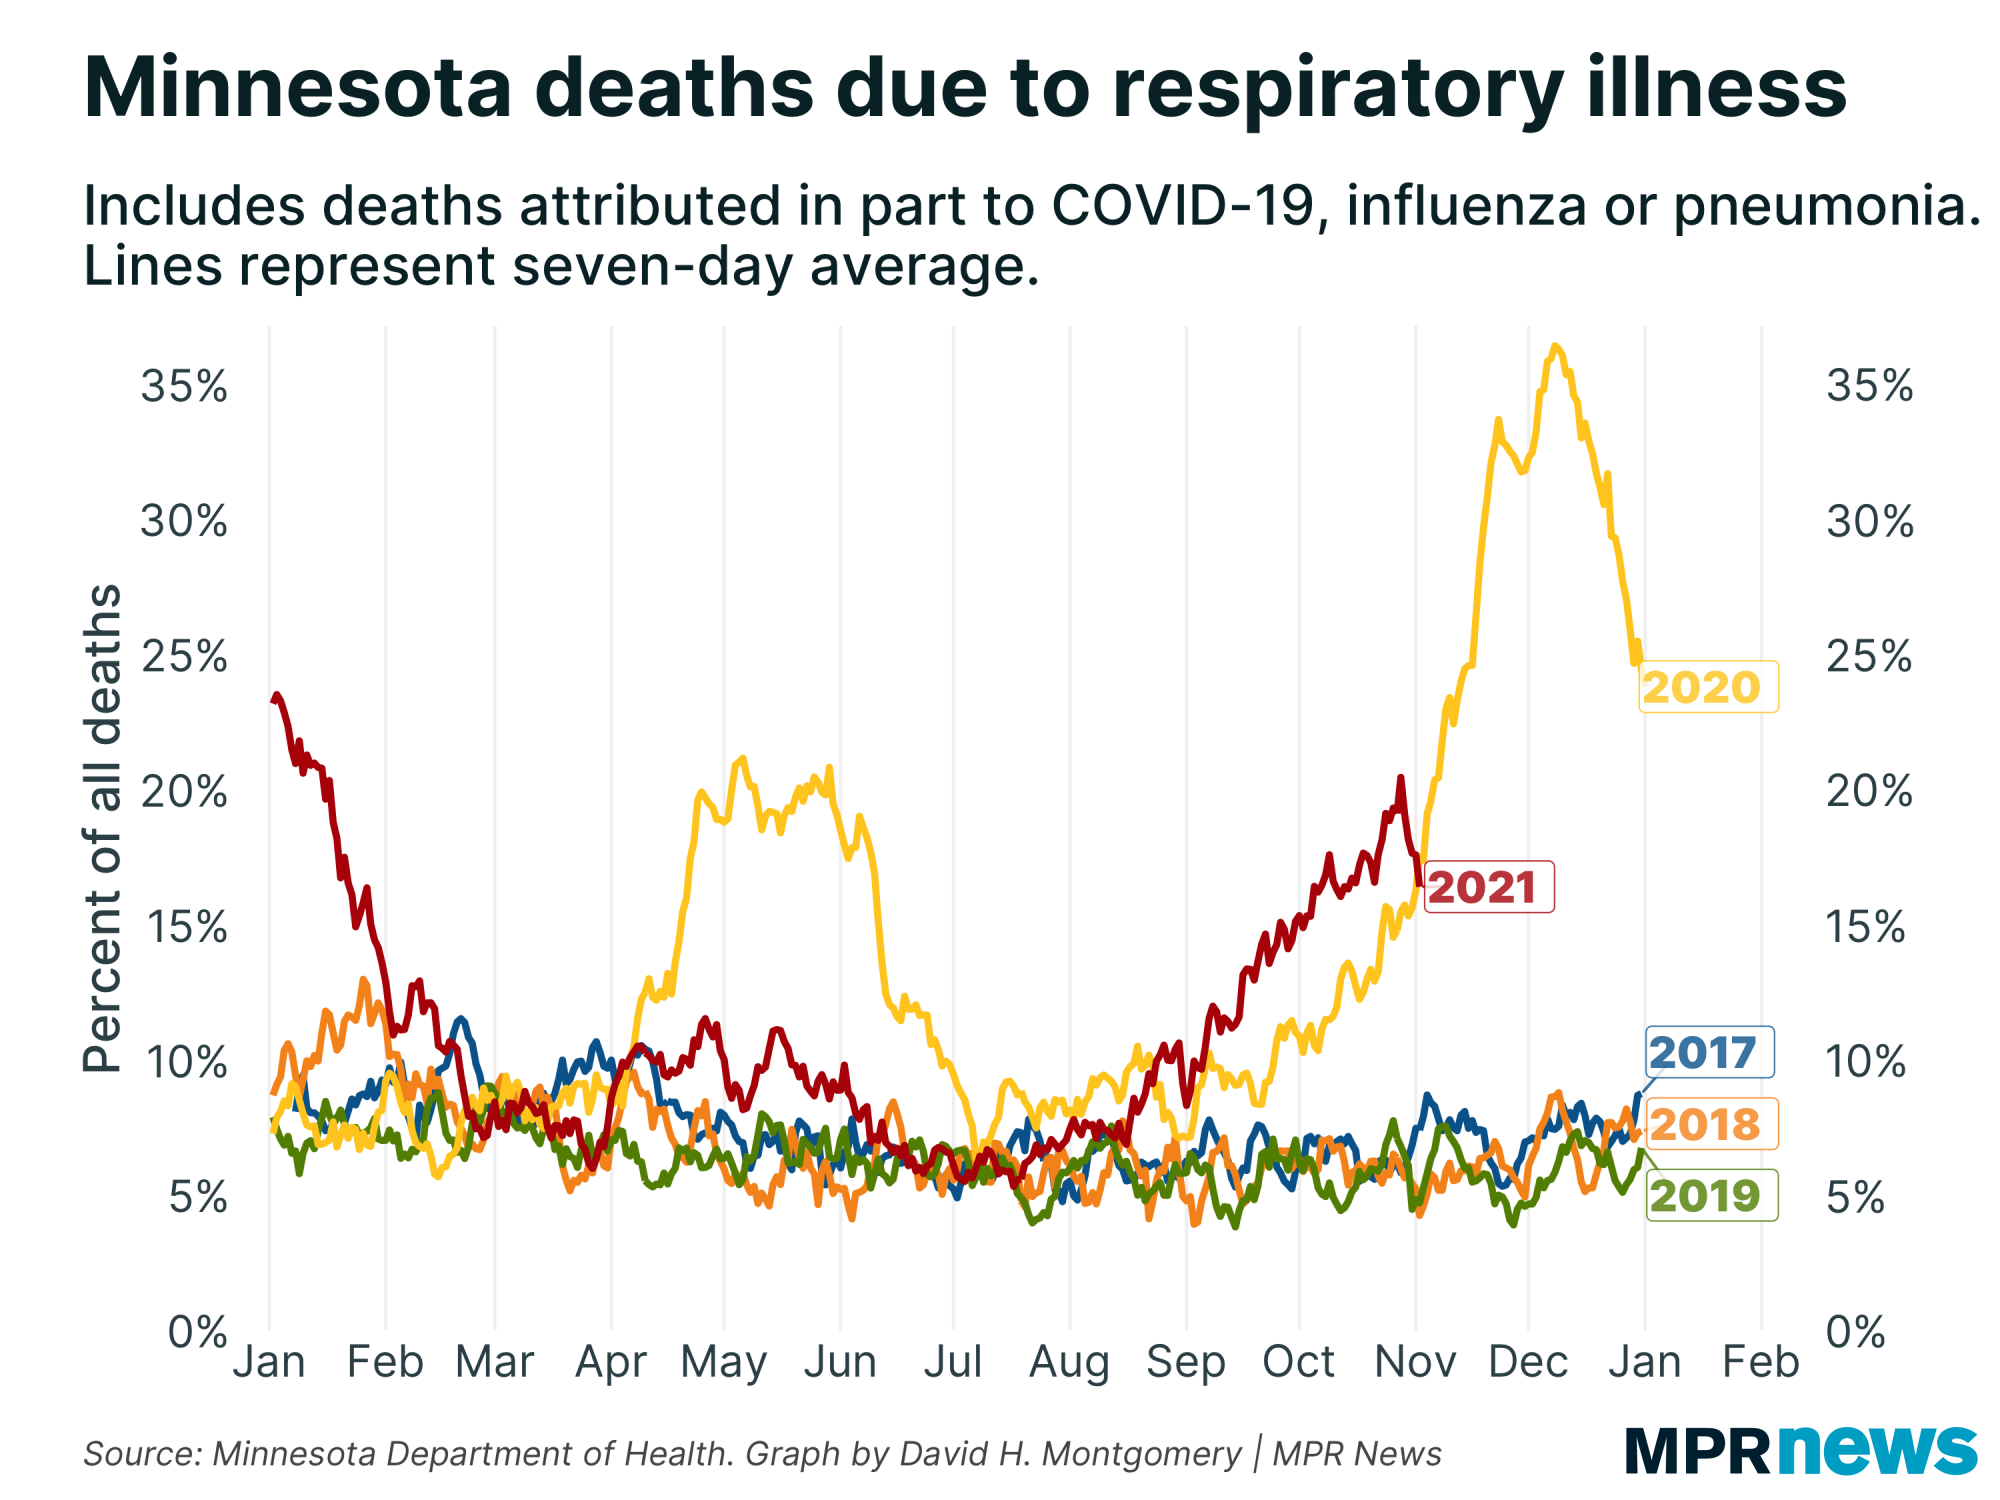
| Zooming out a bit, about 15 to 20 percent of Minnesota's total deaths right now are related to respiratory infections such as flu, pneumonia and COVID-19. (COVID itself is a bit over 10 percent of all deaths.) That's well above average for this time of year, and comparable again to Spring 2020. | |
|
|
|
What's happening next?
| All we can do is sit and wait for a peak...
Thanks for subscribing to this newsletter and for all of you who've sent me your feedback. As always, if you like this newsletter, please share it and the sign-up link with others who you think might enjoy it.
— David |
| |
|
|
Preference Center ❘ Unsubscribe You received this email because you subscribed or it was sent to you by a friend. This email was sent by: %%Member_Busname%%
%%Member_Addr%% %%Member_City%%, %%Member_State%%, %%Member_PostalCode%%
  |
|
|
| | |