| Welcome back to COVID in Minnesota TODAY, an email newsletter from MPR News about understanding the latest developments in Minnesota's COVID-19 outbreak. | | |
|
|
It's all bad.
I'm not going to speculate today about when this surge will end or how bad things will get. Suffice to say everything is headed in the wrong direction. I'll lay that out today, and then break down a crucial question: what kind of impact are we observing from COVID-19 vaccines? | |
|
|
|
Three things to know
| - Minnesota's COVID-19 outbreak is going from bad to worse with no slowdown in sight
- The outbreak is worse in rural Minnesota, where vaccination rates are lower
- Breakthrough case data shows vaccinated Minnesotans are many times less likely to catch COVID-19 or face hospitalization or death from it than the unvaccinated
|
| |
|
|
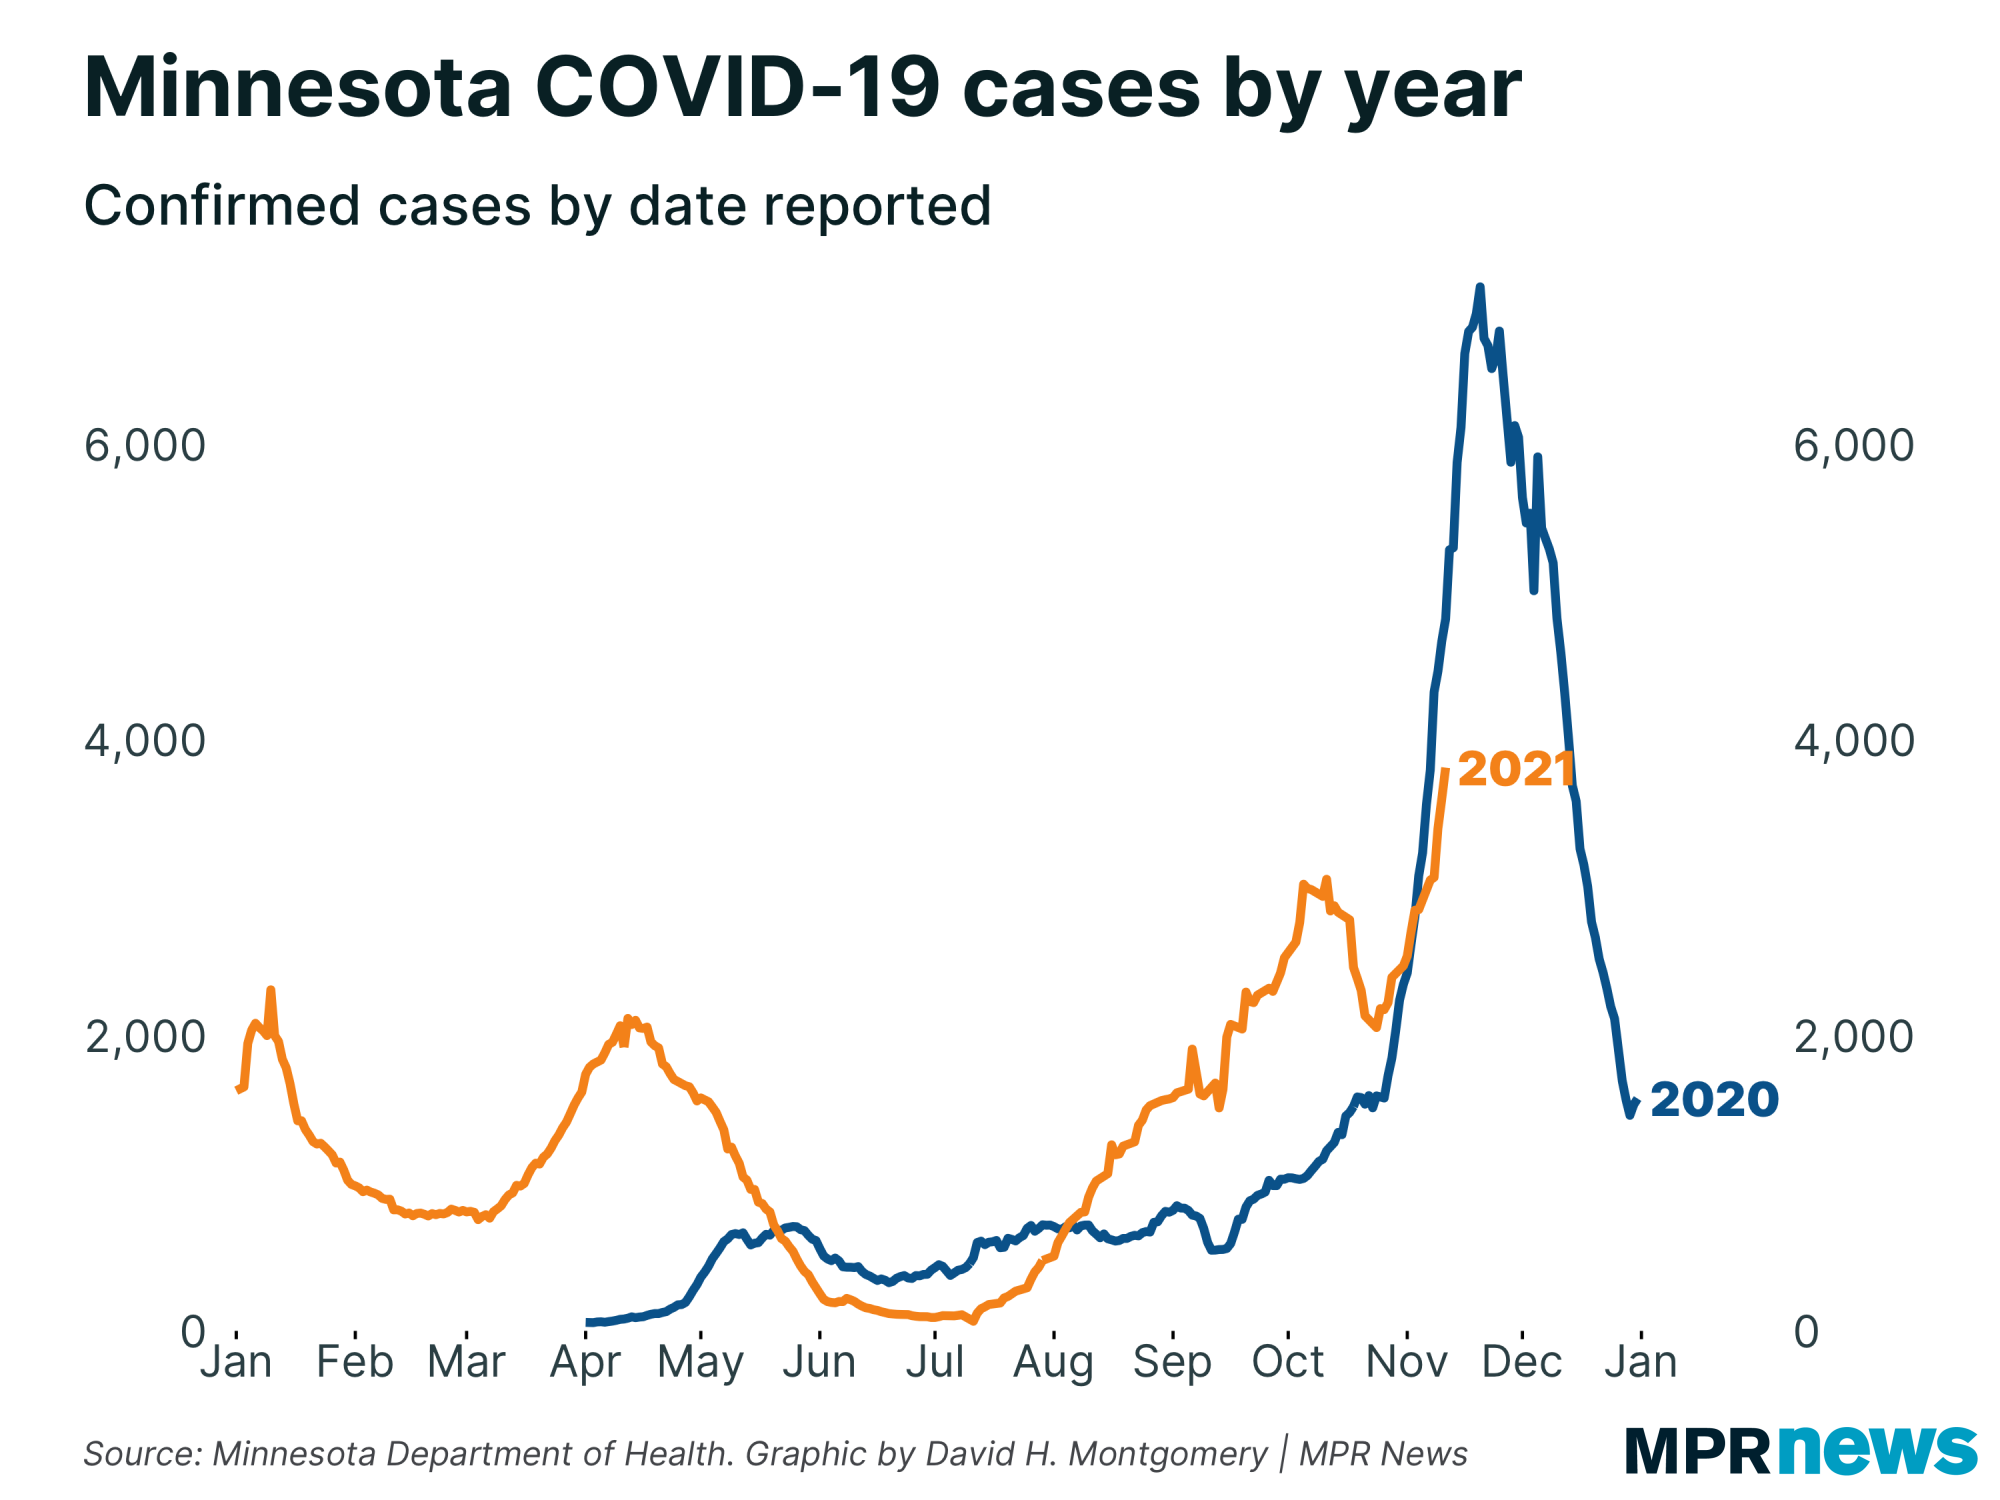
Last week I pointed out that while cases and positivity were rising, they were at least rising less dramatically than this time last fall.
Alas, that's no longer the case. | | |
|
|
This is no guarantee that cases will continue to rise at this pace for weeks to come. But there are no signs that the increase, whatever pace it takes, is about to end.
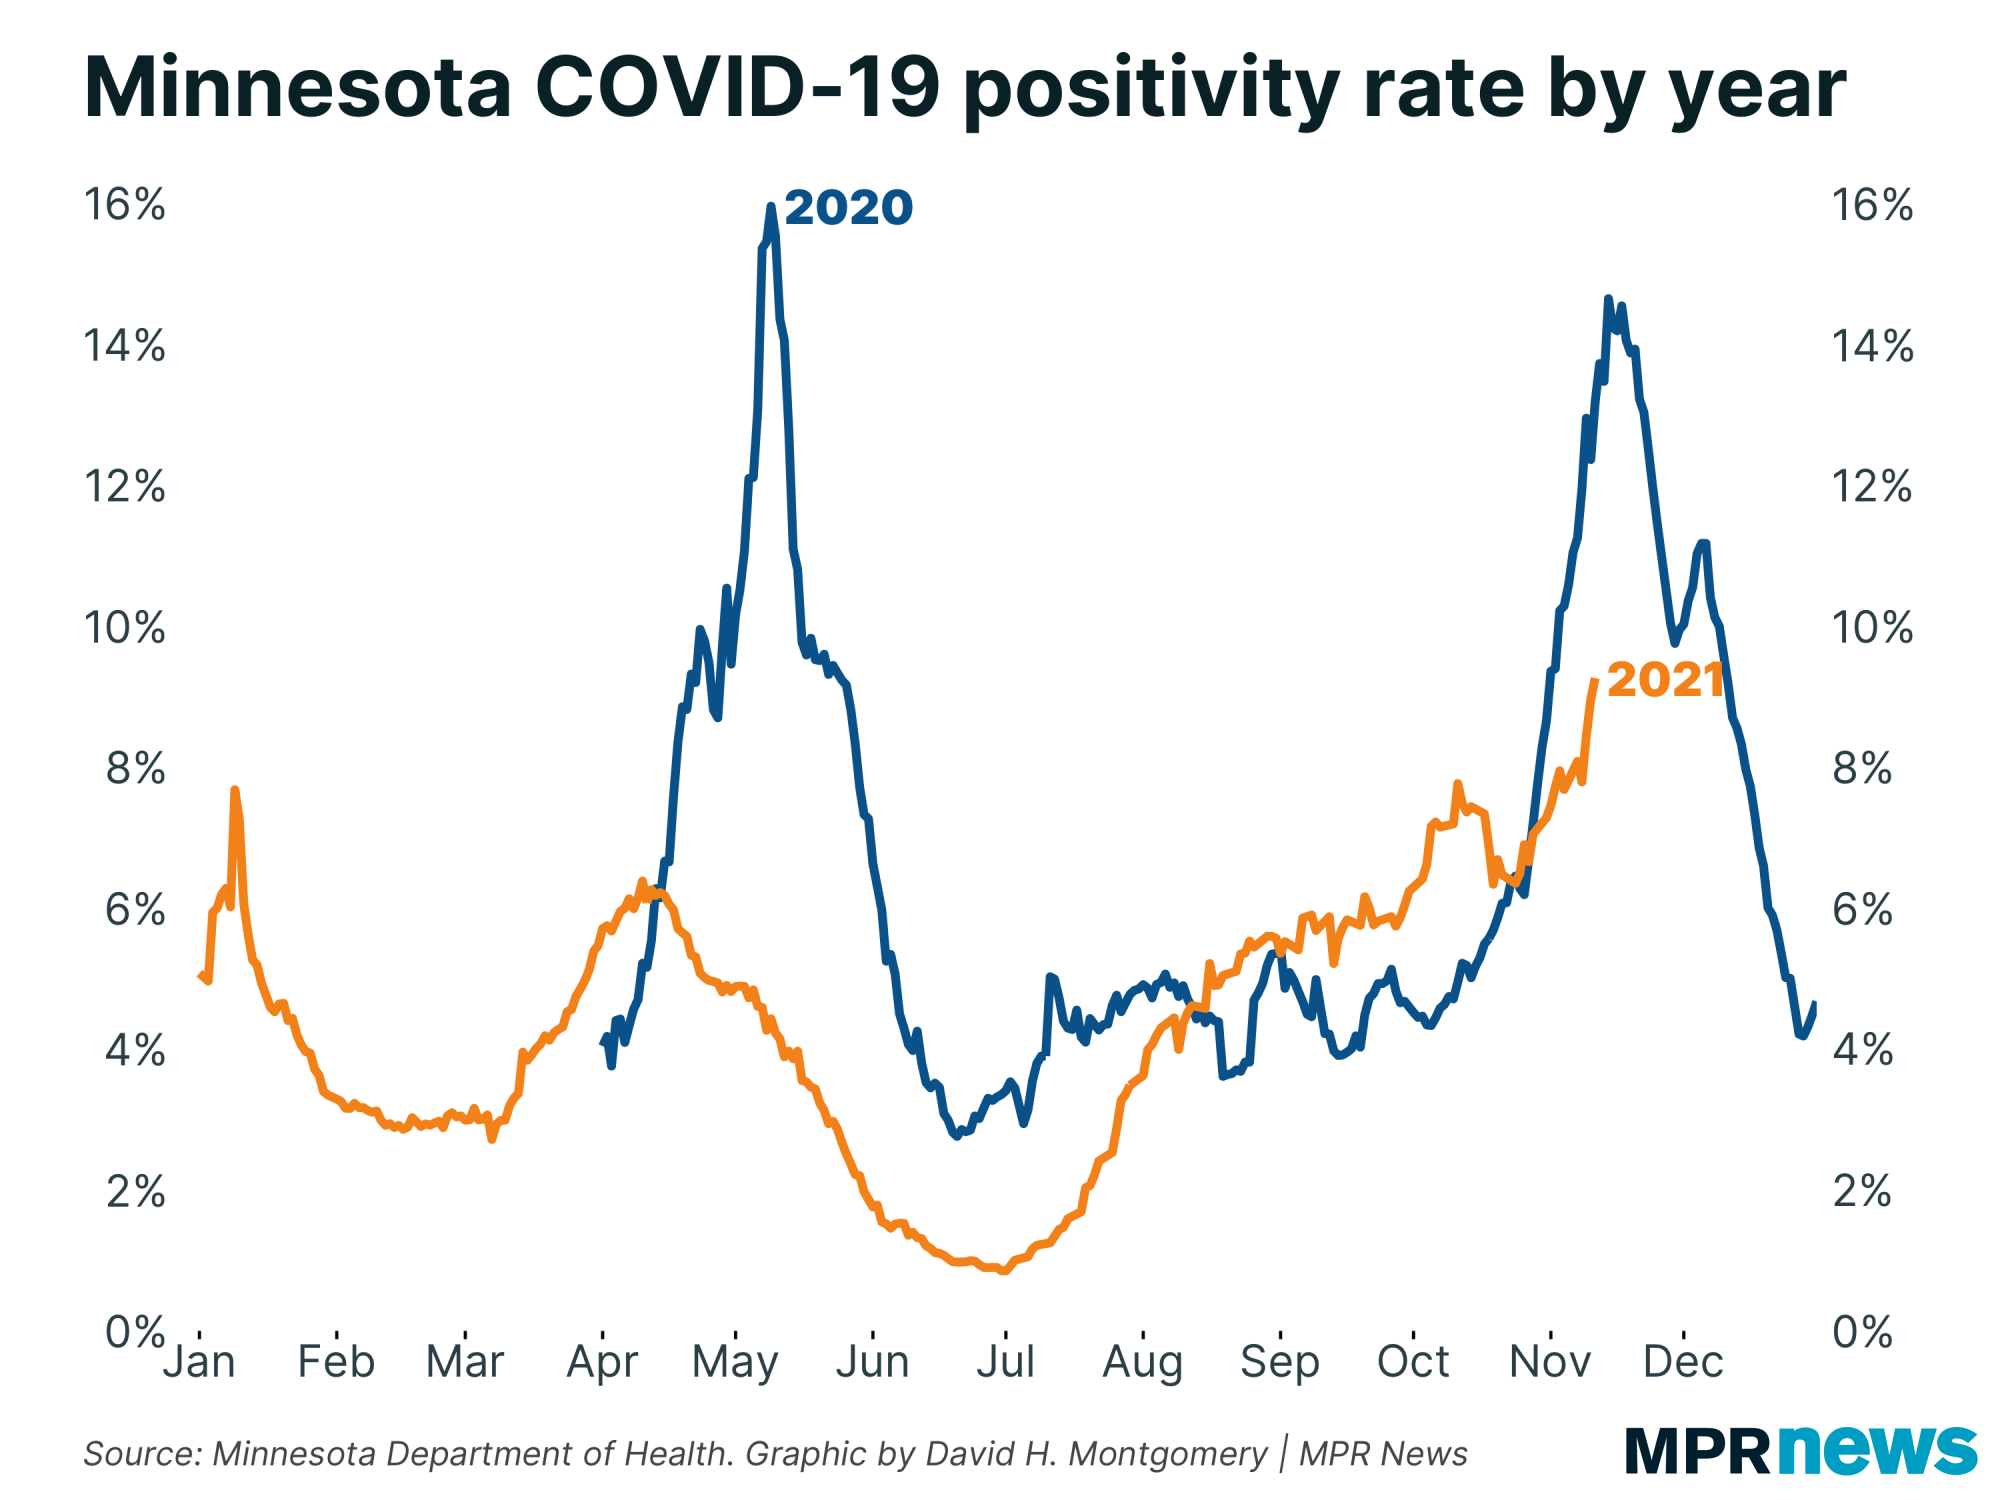
This spike shows up in positivity rate, too. Last week this was notably milder than the increase in cases, but positivity had its own surge this week. | |
|
|
|
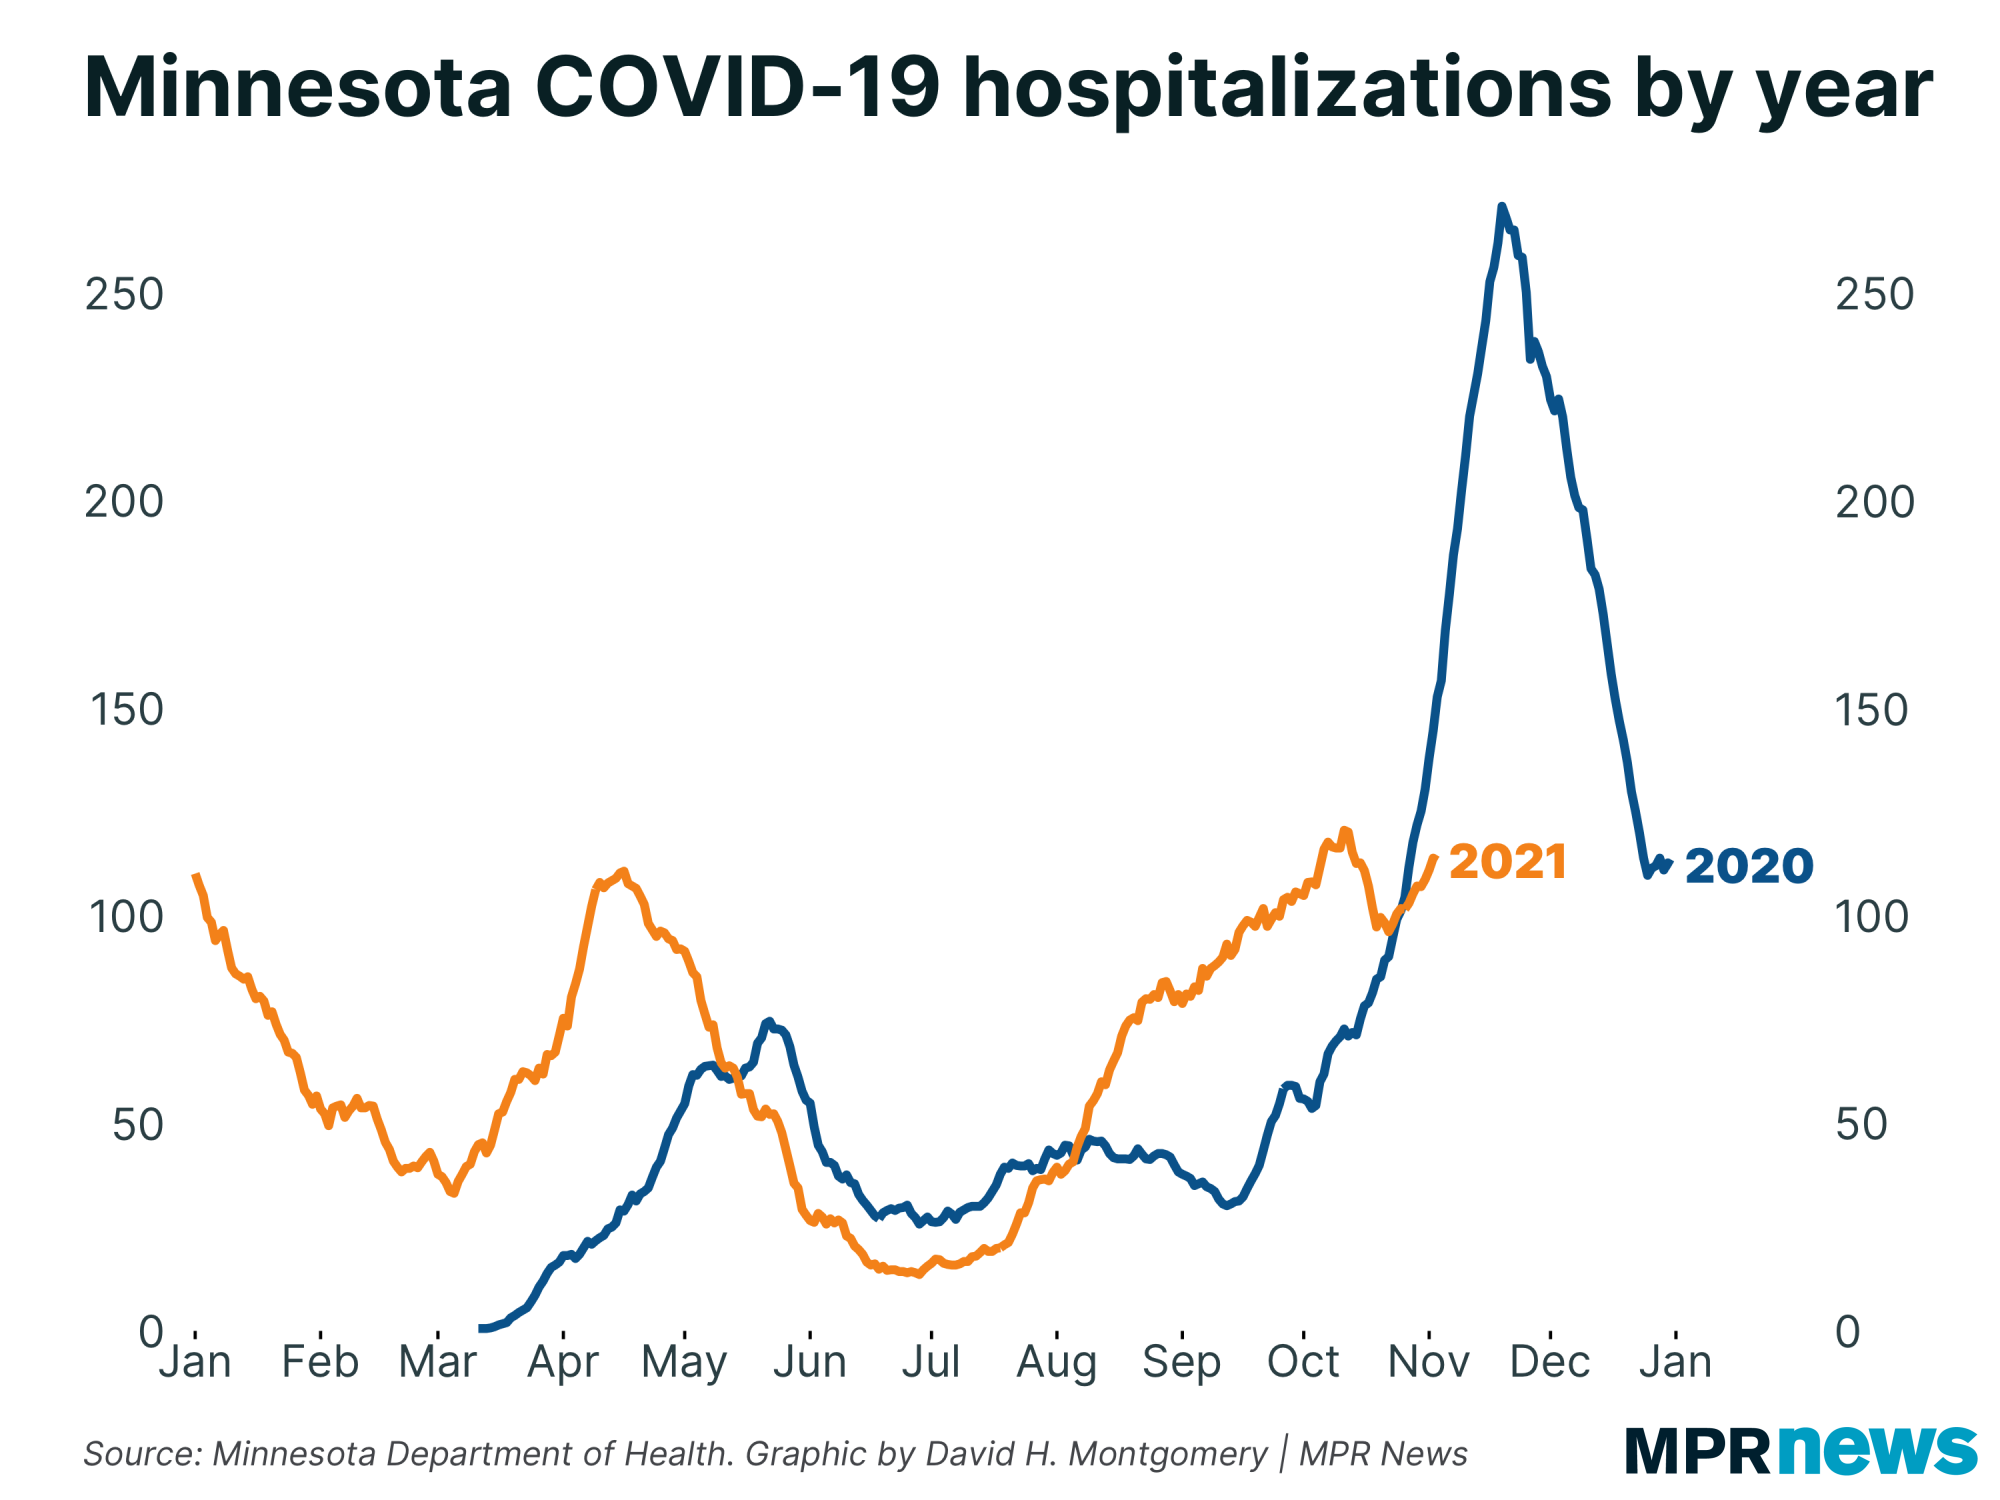
| Hospitalizations are up, sharply, too. This isn't a situation where people are getting sick, but not seriously. | | |
|
|
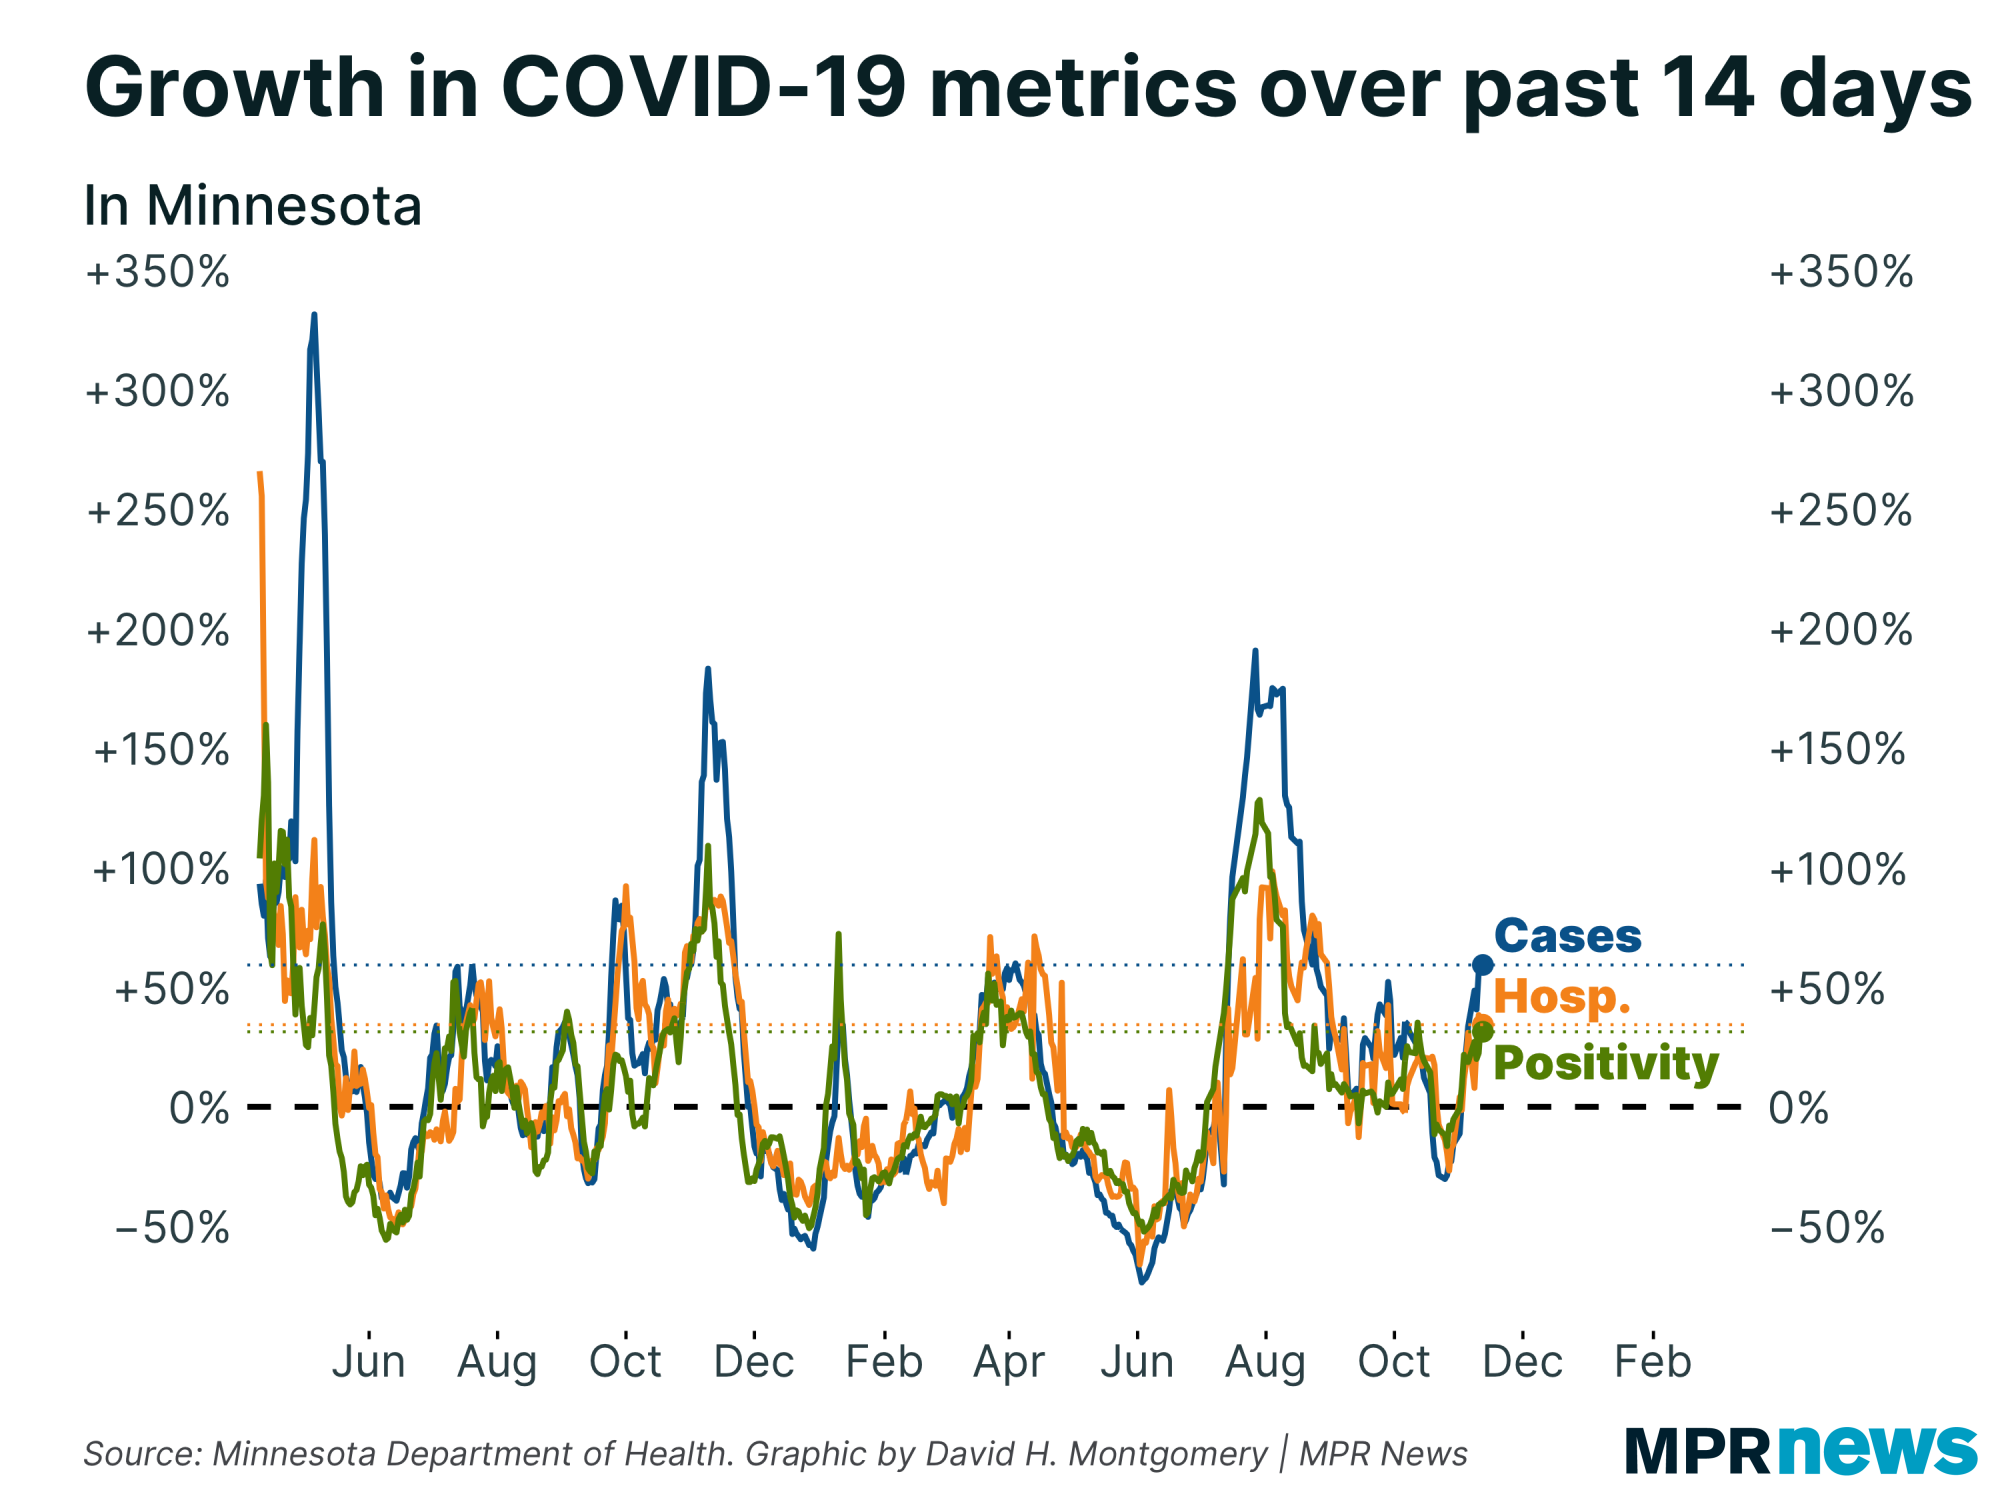
| Overall, all our key metrics are up a lot over the past two weeks, and are accelerating rather than slowing down. Cases are showing the most dramatic growth, which makes sense given that testing volume is also up over this time. | | |
|
|
What's happening with breakthrough cases?
|
I haven't reported very much on breakthroughs lately, partially because the data the Minnesota Department of Health reported on the topic was extremely limited. They only reported data once per week, and had a one-month lag time. (That compares to their new dataset on reinfections, which is updated daily and largely current after about a week.) They also intentionally didn't report raw numbers, only age-adjusted rates, out of a concern that that data could be confusing or misused.
But I'm proud to report that I and others successfully bullied the health department into releasing those raw numbers (though not until I spent yesterday afternoon trying to reverse-engineer the raw data!).
So let's take a look.
First, the new data we got is total case counts by vaccination status. Unfortunately, it's still weekly and a month out of date, so it doesn't tell us anything about what's happening now. But it does tell us some interesting things.
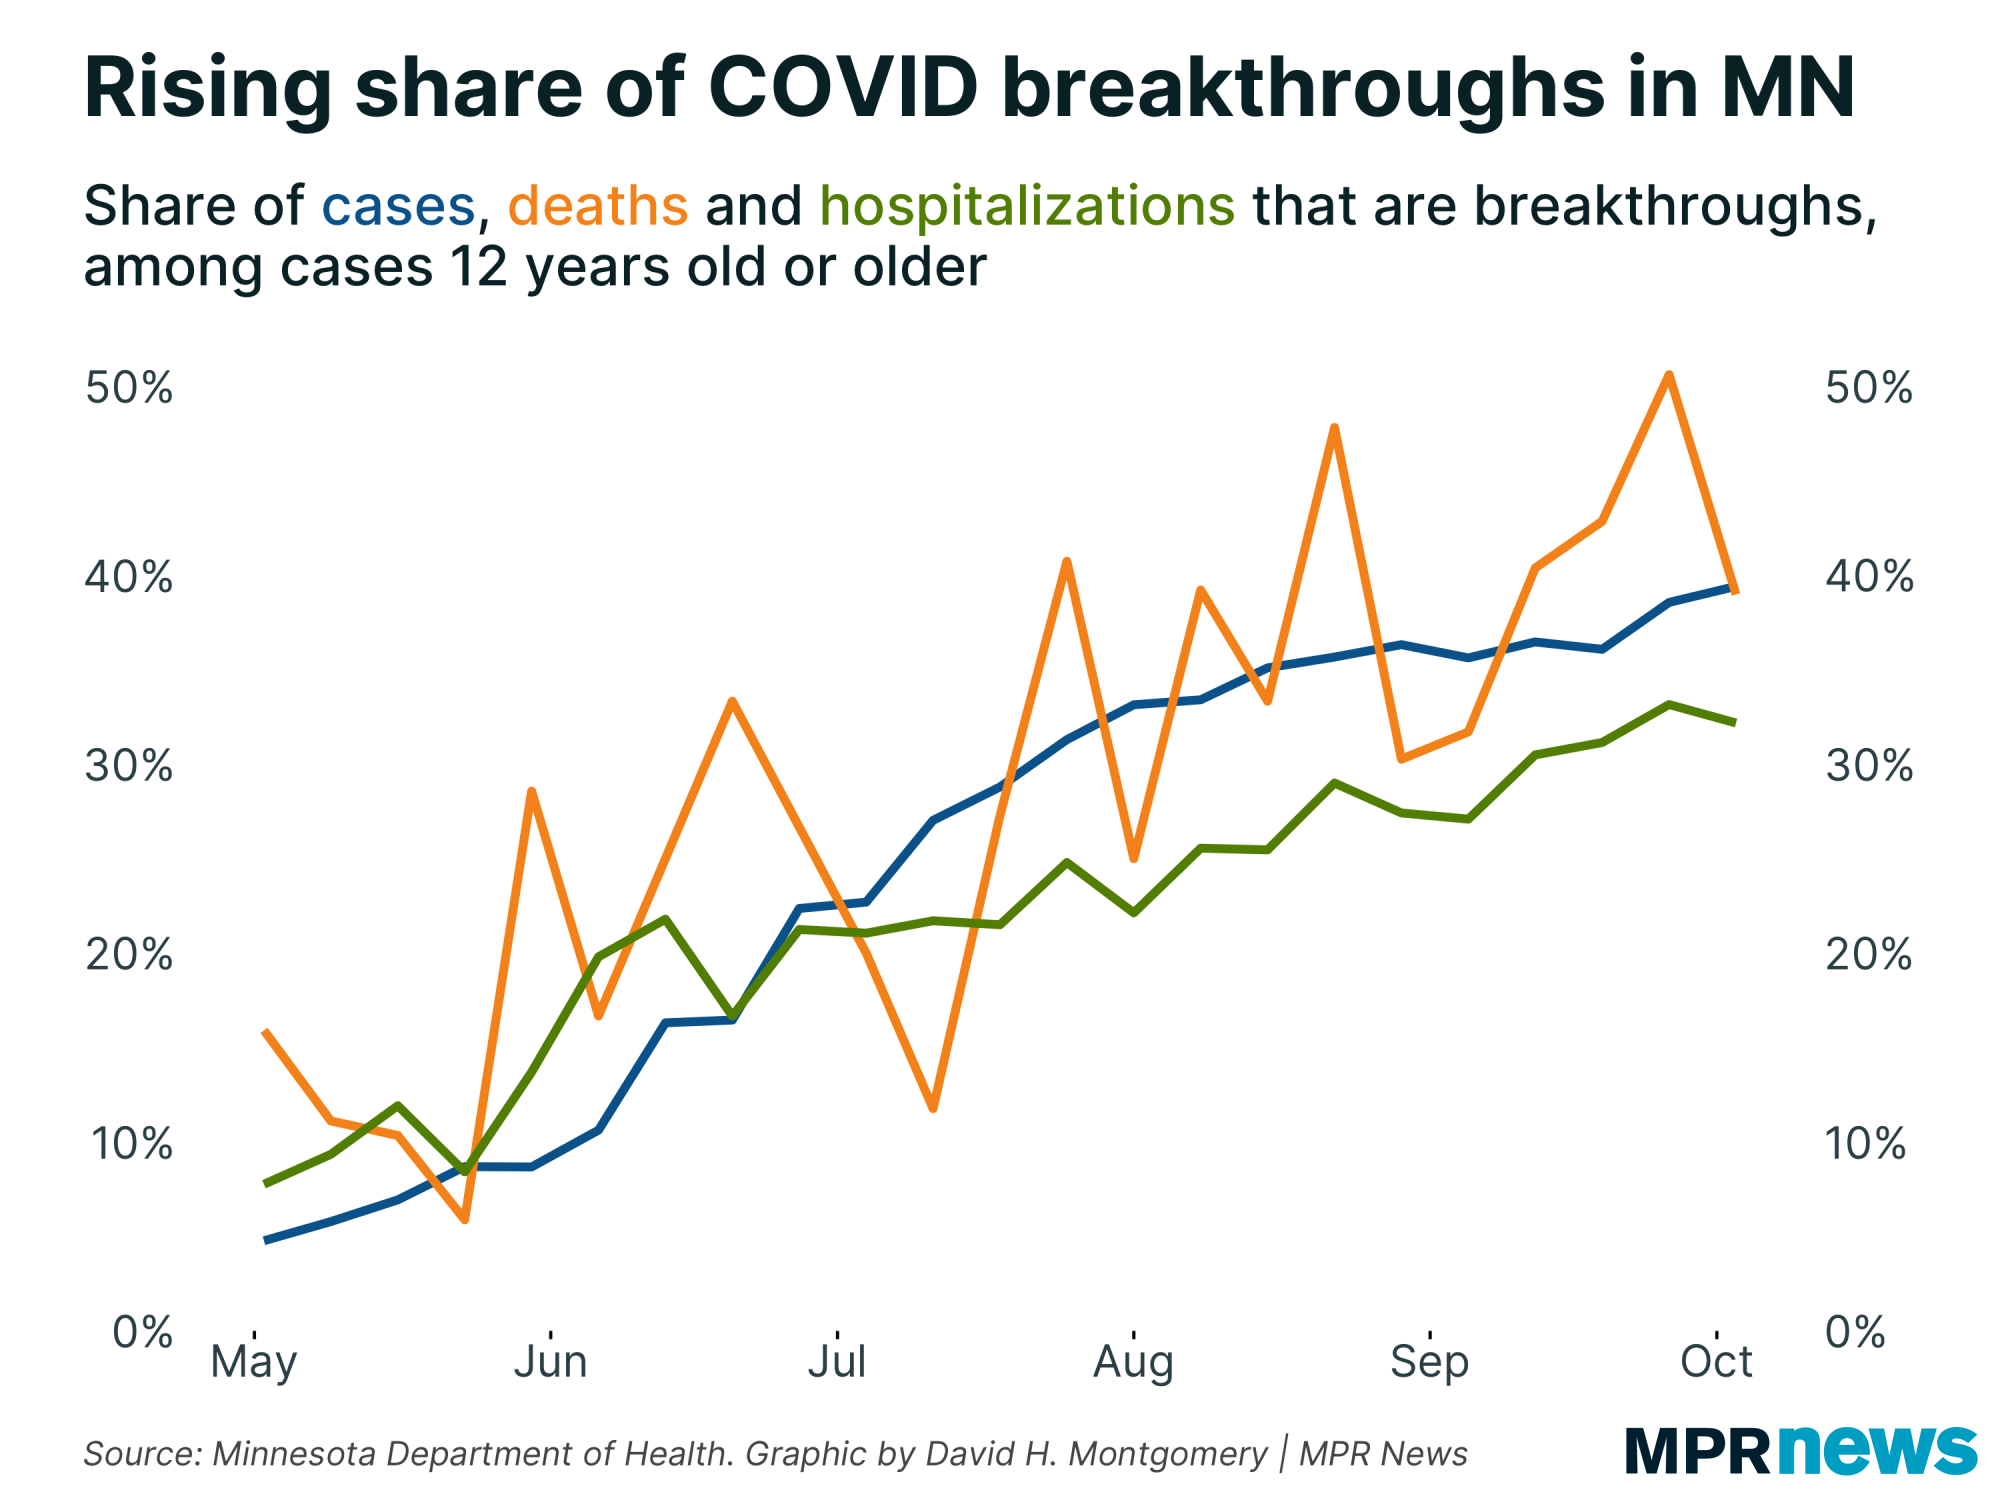
Here's the chart. As you can see (and read on before you react!) the share of cases, hospitalizations and deaths that happen to fully vaccinated people has steadily risen since May, and now account for about 30 to 40 percent of all incidents. |
| |
|
|
40 percent of cases and deaths are vaccinated people! That seems really large. When I shared this on Twitter, multiple people had the same reaction: how can this be true if the vaccines are supposed to be effective?
I'll tell you! The simple answer is "math."
The complex answer has to do with how tiny chances intersect with large numbers.
Remember that this population in question here, Minnesotans aged 12-plus, is currently about 72 percent fully vaccinated; a month ago, when this data is from, this figure was about 68 percent.
If the vaccine did nothing — a simple placebo — then we'd expect the share of cases who were in this "vaccinated" group to be equal to their share of the population, around 68 percent. Instead it's significantly lower.
In a heavily vaccinated population, in fact, you'd expect breakthrough cases to account for a majority of all incidences, even with a highly effective vaccine.
We can see that most clearly with deaths. This figure again can seem alarming — 40 percent of COVID-19 deaths are among the vaccinated?
But remember that something like 75 percent of all COVID-19 deaths right now happen to seniors, of whom just under 92 percent were fully vaccinated a month ago.
By my estimates, reverse-engineering MDH's data, this week of Oct. 3 that we're talking about saw about 120 COVID-19 deaths (by death date, not report date) among seniors, of whom about 80 were unvaccinated and 40 vaccinated.
What that means is that the roughly 8 percent of seniors who were unvaccinated accounted for 67 percent of all deaths. The other 92 percent accounted for the other third.
So these raw counts are good to have, but the real value comes from looking at comparative rates, like we just did.
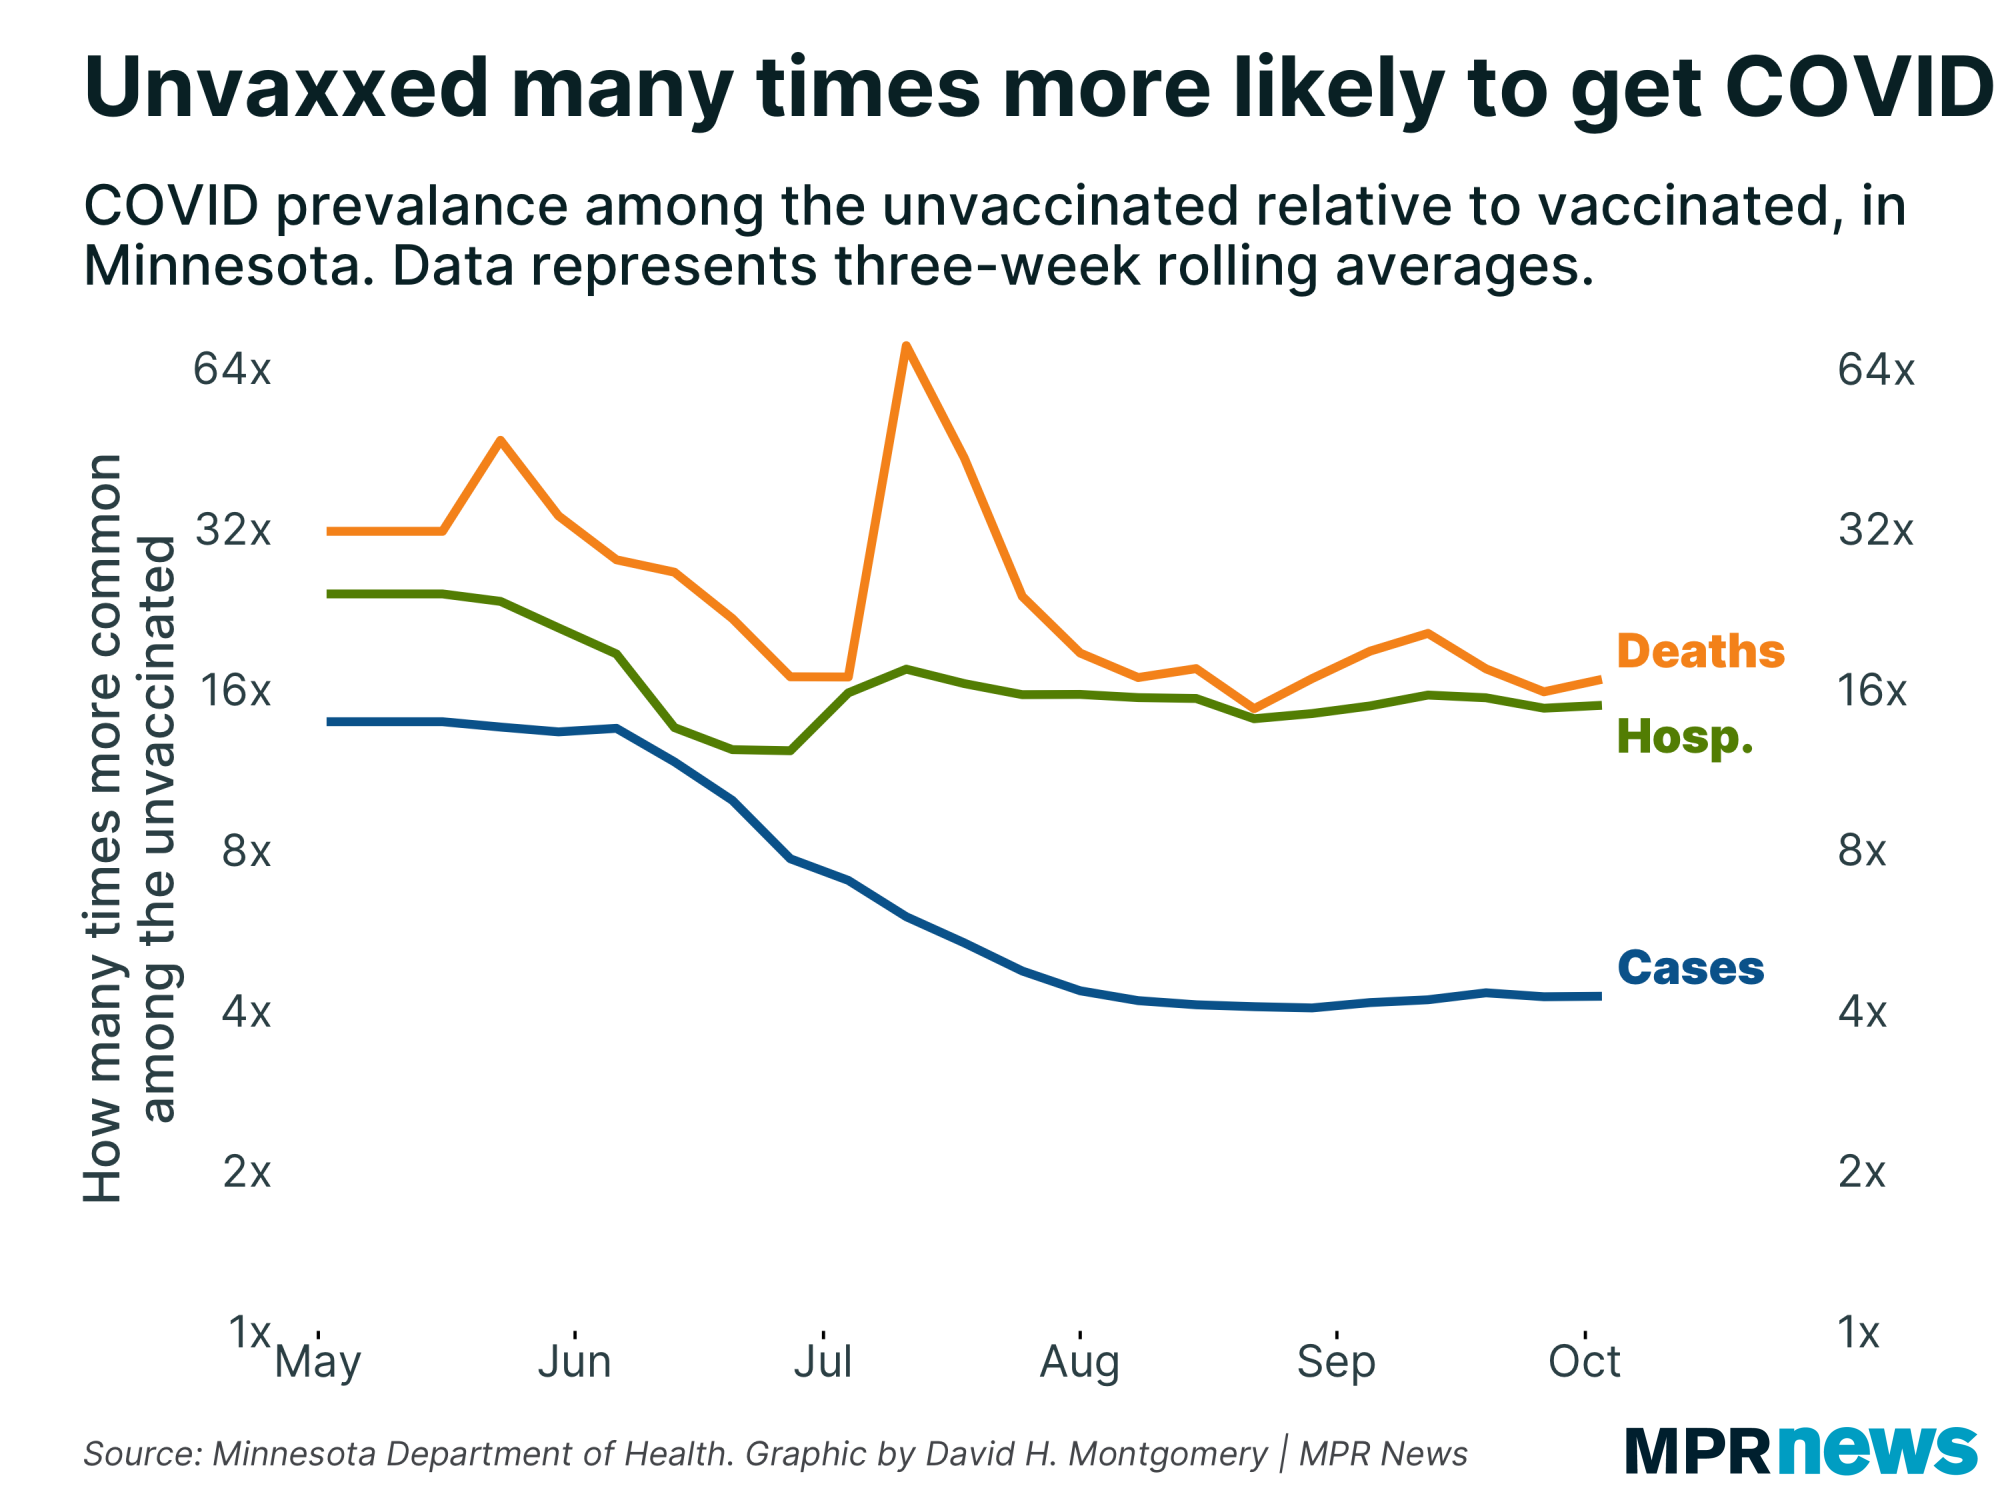
Here's a chart breaking down the relative prevalence of COVID-19 cases, hospitalizations and deaths among the unvaccinated compared to the vaccinated. |
| |
|
|
The unvaccinated have been about four times more likely to get a COVID-19 case, and about 16 times more likely to be hospitalized or die.
Also extremely importantly, these ratios have been largely flat for months. The relative case prevalence did take a dive in June and July, as the delta variant took hold in Minnesota, but has been flat since then. This matters since there has been some evidence that vaccine effectiveness can fade with time. That may very well be true, but we're not seeing it in these numbers.
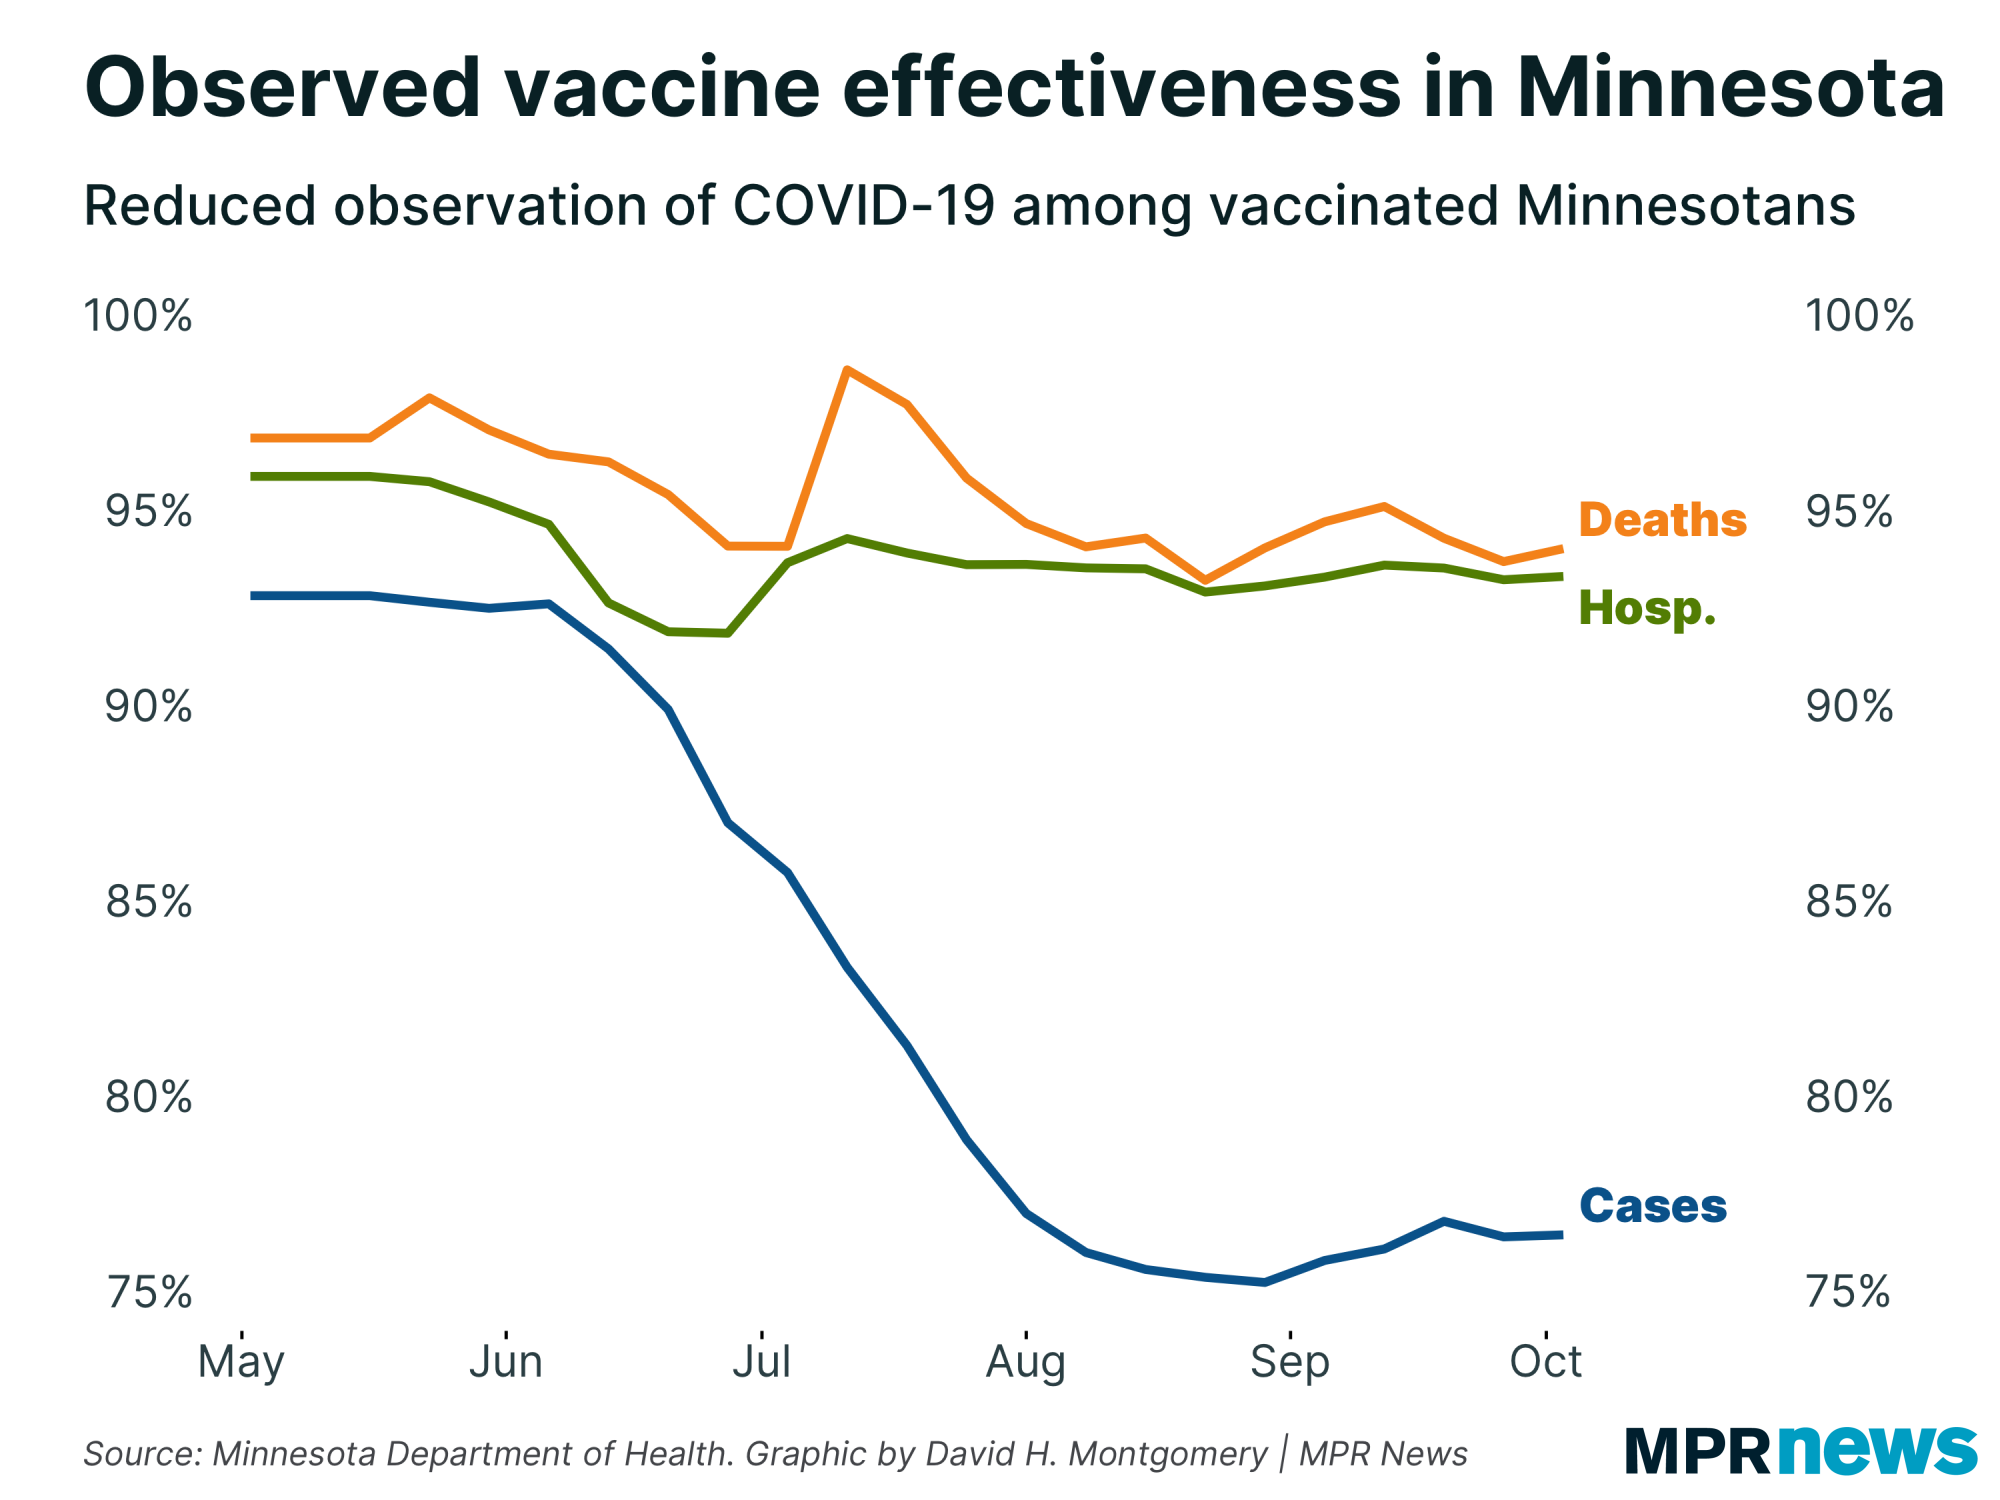
Here's another way of looking at the same data. Taking the inverse of the multipliers above, we can say that vaccinated people were (in early October) 76 percent less likely to catch COVID-19, 93.2 percent less likely to be hospitalized with it, and 94 percent less likely to die from it. |
| |
|
|
When you hear people say that a vaccine is "95 percent effective at reducing serious illness," this is the calculation people are referencing! Of course, in most cases those figures come from randomized control studies, a much more reliable tool than this population-level analysis I've done here. But it's interesting that we're seeing these studies' findings play out at a statewide level.
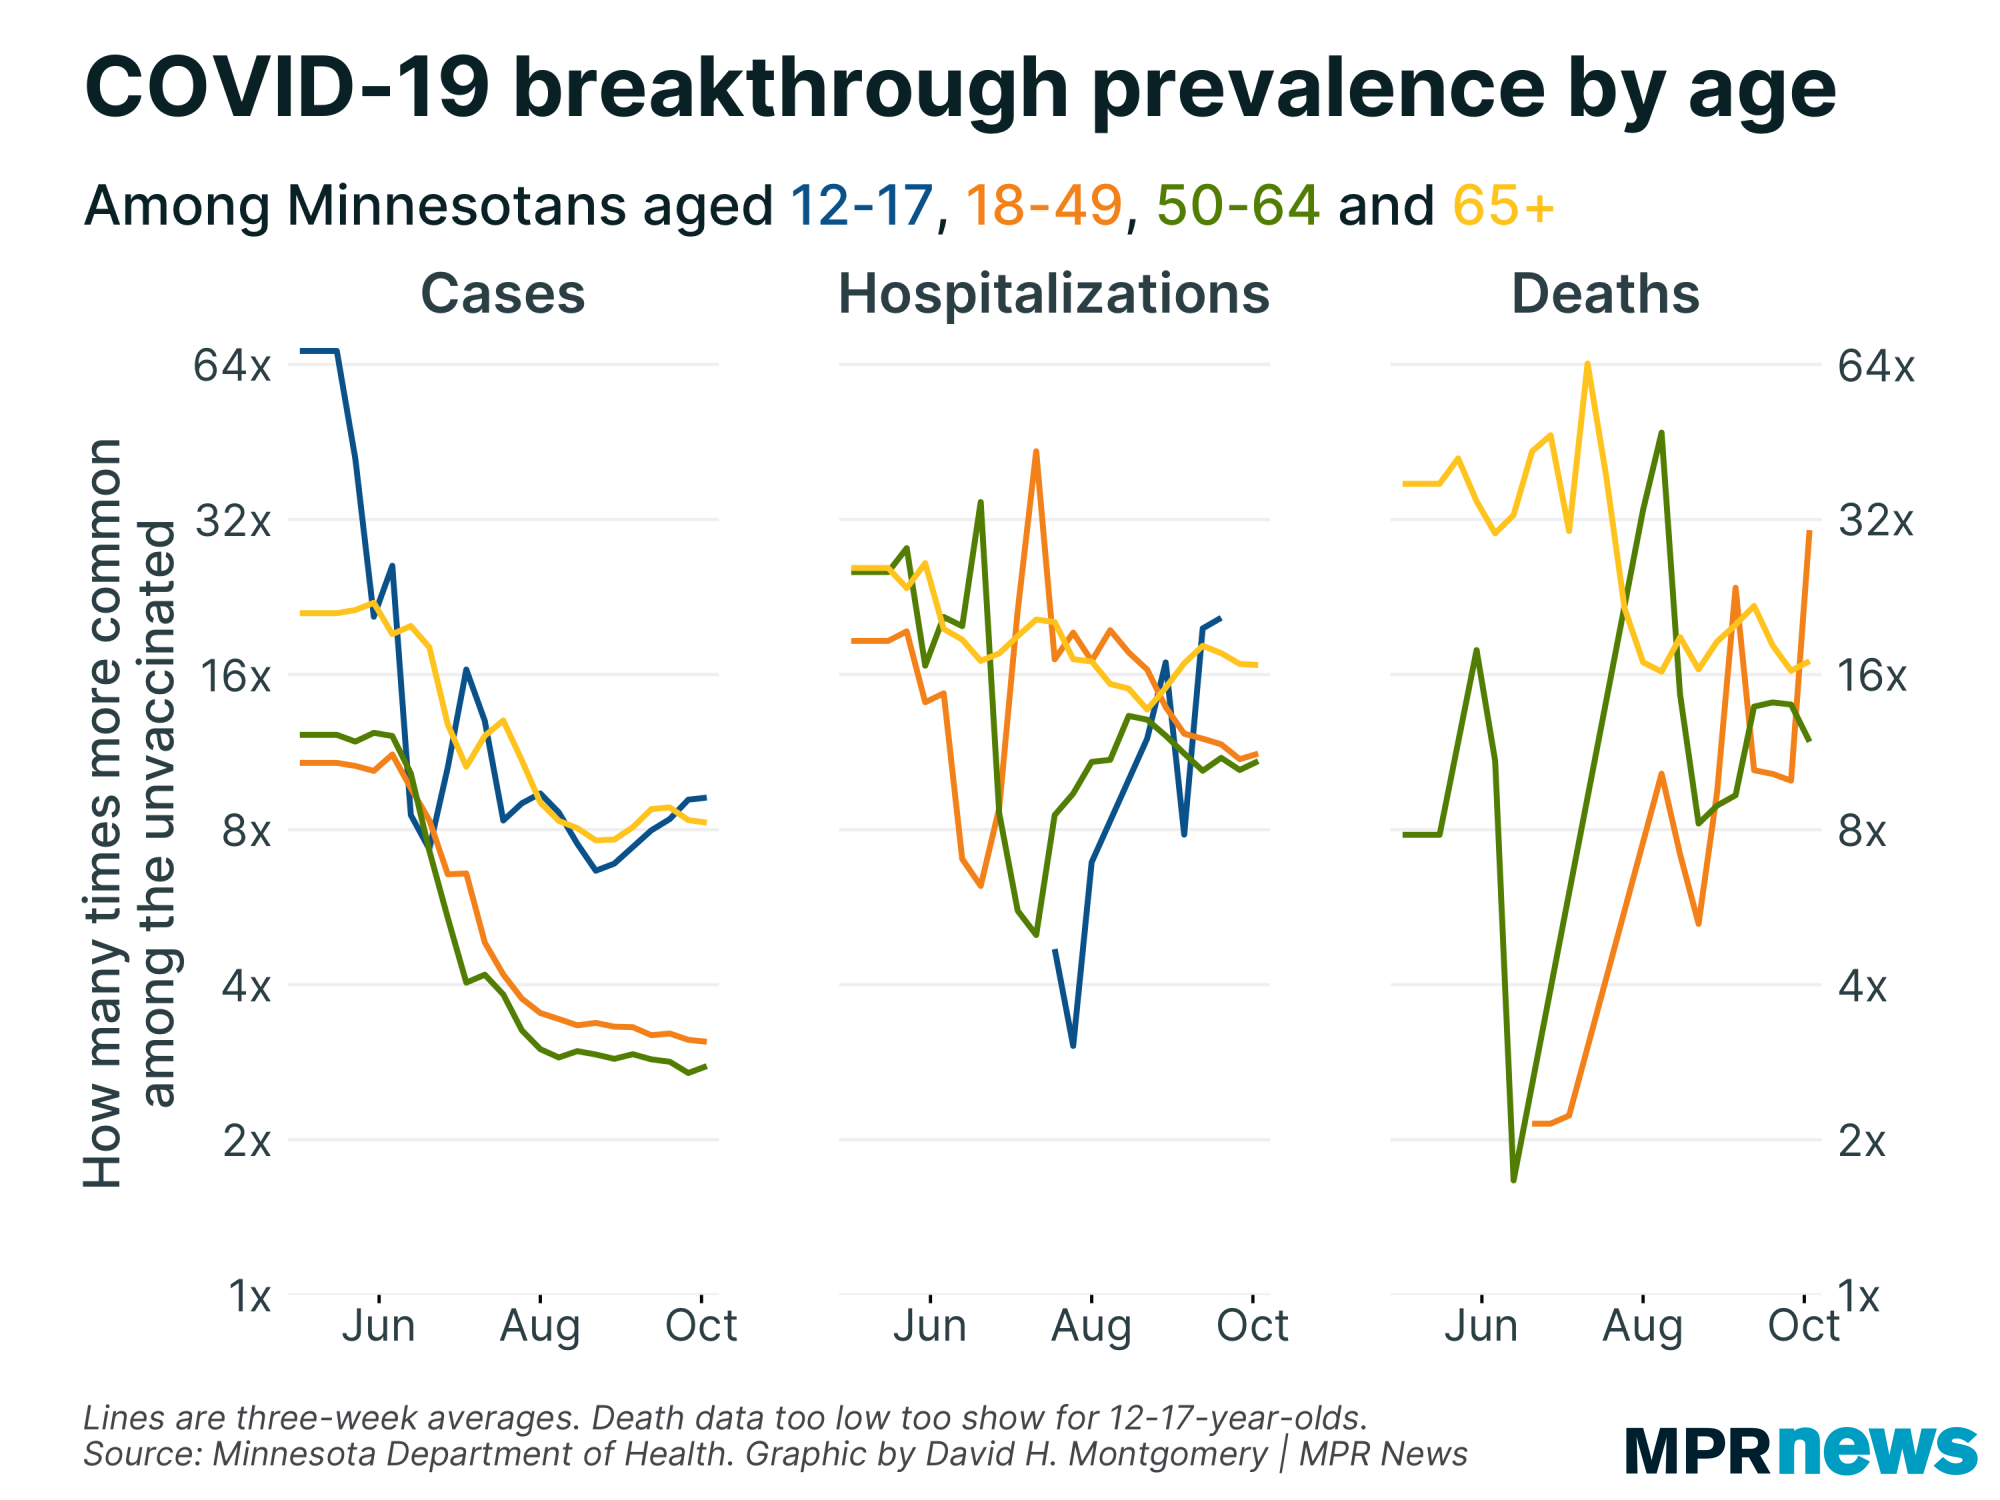
The health department also releases this same data broken out by age. This is pretty messy data, but it does have a few interesting trends. |
| |
|
|
First, for hospitalizations and deaths, we don't see any drastic differences between age brackets. The vaccine appears to be just as effective at preventing serious illness among young and old Minnesotans.
Second, there are no dramatic decreases in effectiveness seen here, especially not for serious illness.
Third, there's a fascinating split in the case effectiveness data. Vaccinated working-age adults are about three times less likely to get COVID than the unvaccinated of the same age. But this figure is eight times among both seniors and teenagers. I'm not sure what's behind that! (And it could be multiple factors at once.) It's certainly interesting, though.
We'll get fresh updates of this data every Monday. We'll see what it shows as we get into October, when we saw cases first fall and then start sharply rising! |
| |
|
|
Below, I'll explore a few more stats about Minnesota's COVID-19 outbreak. If you want to learn more, I also recommend these other articles:
| | |
|
|
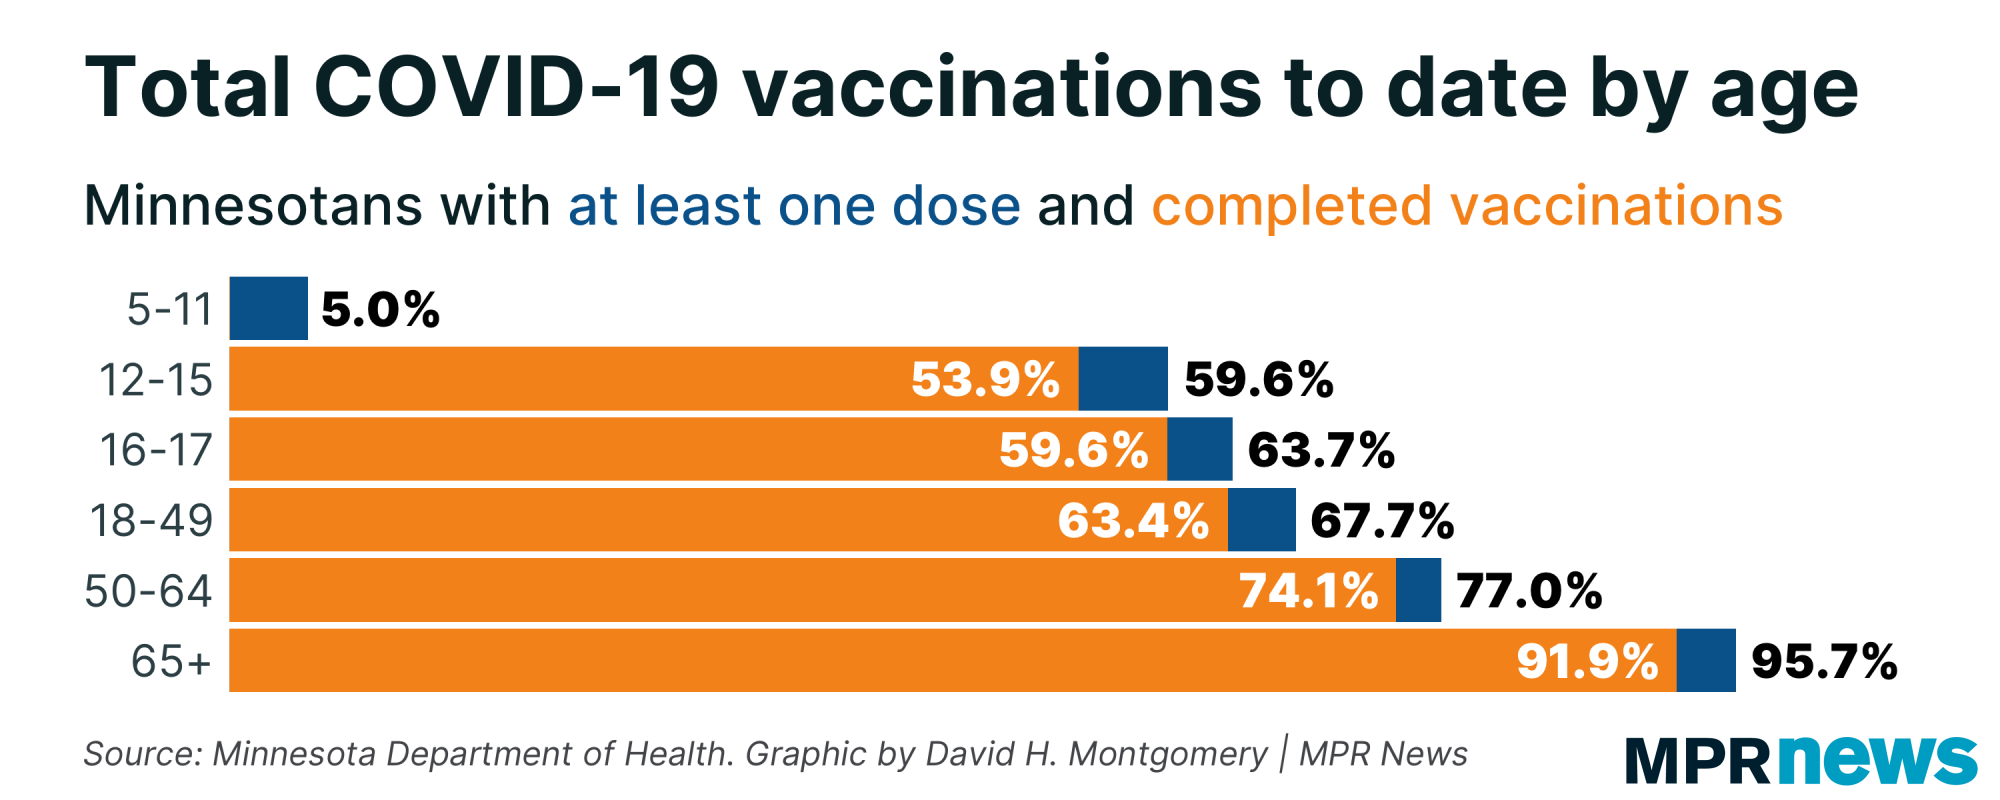
| Kids' vaccinations start to ramp up | | Around 5 percent of newly eligible 5- to 11-year-olds have gotten a COVID-19 vaccine in the first week-plus of eligibility. | |
|
|
|
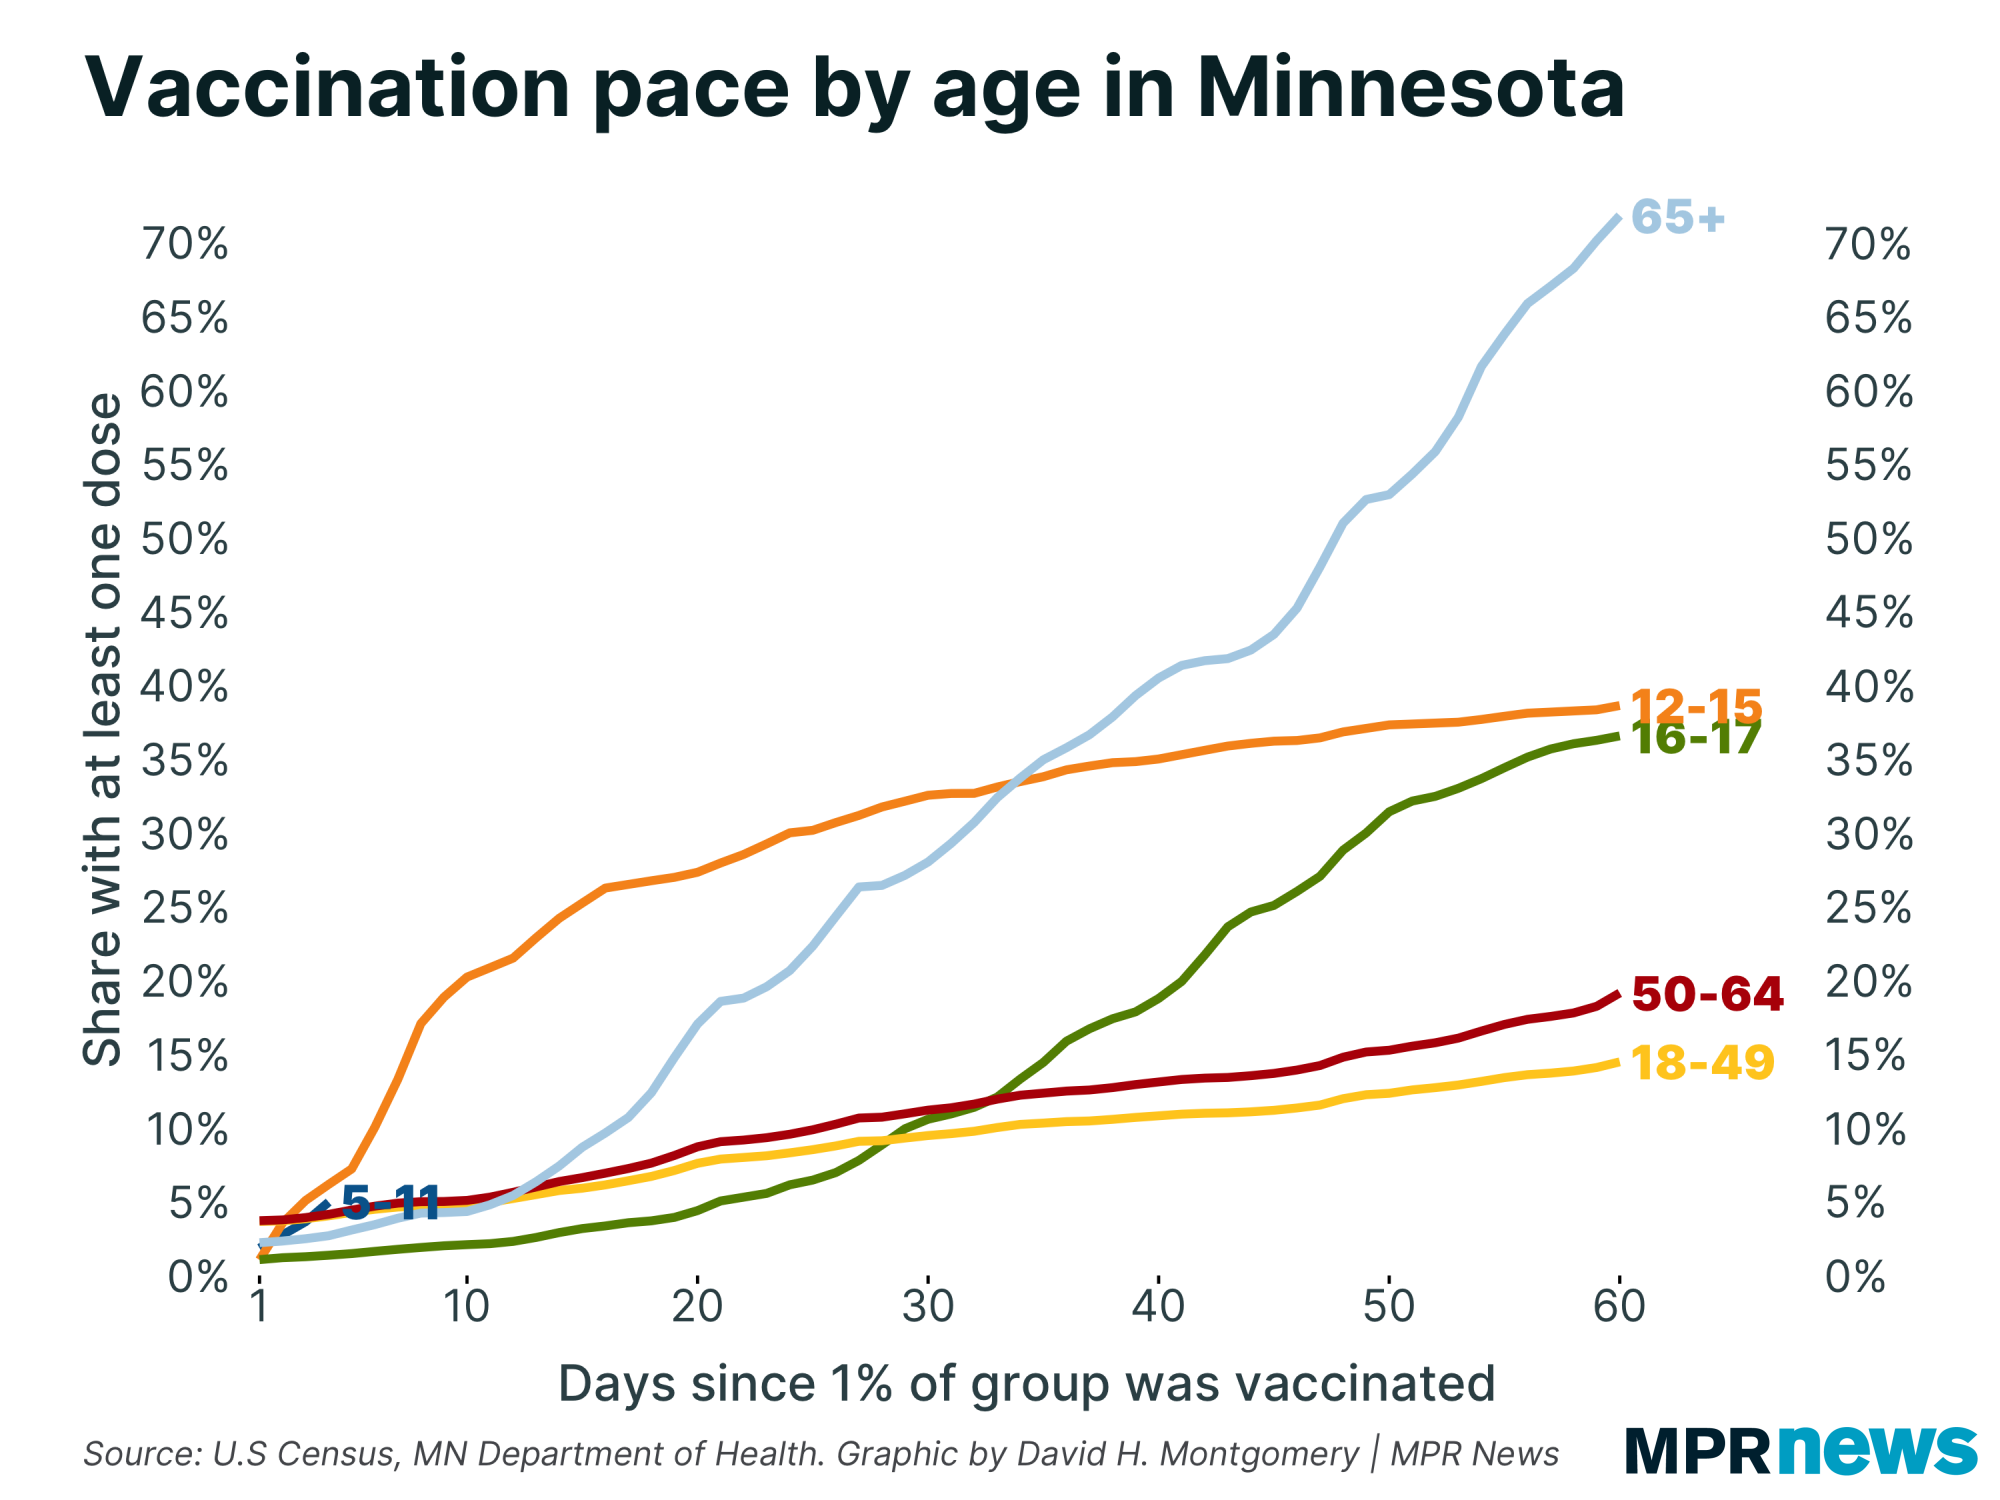
| This pace is slightly slower than the uptake we saw when 12- to 15-year-olds became eligible earlier this year. It's faster than older age groups, but all those groups had periods of limited supply after they first became eligible. | | |
|
|
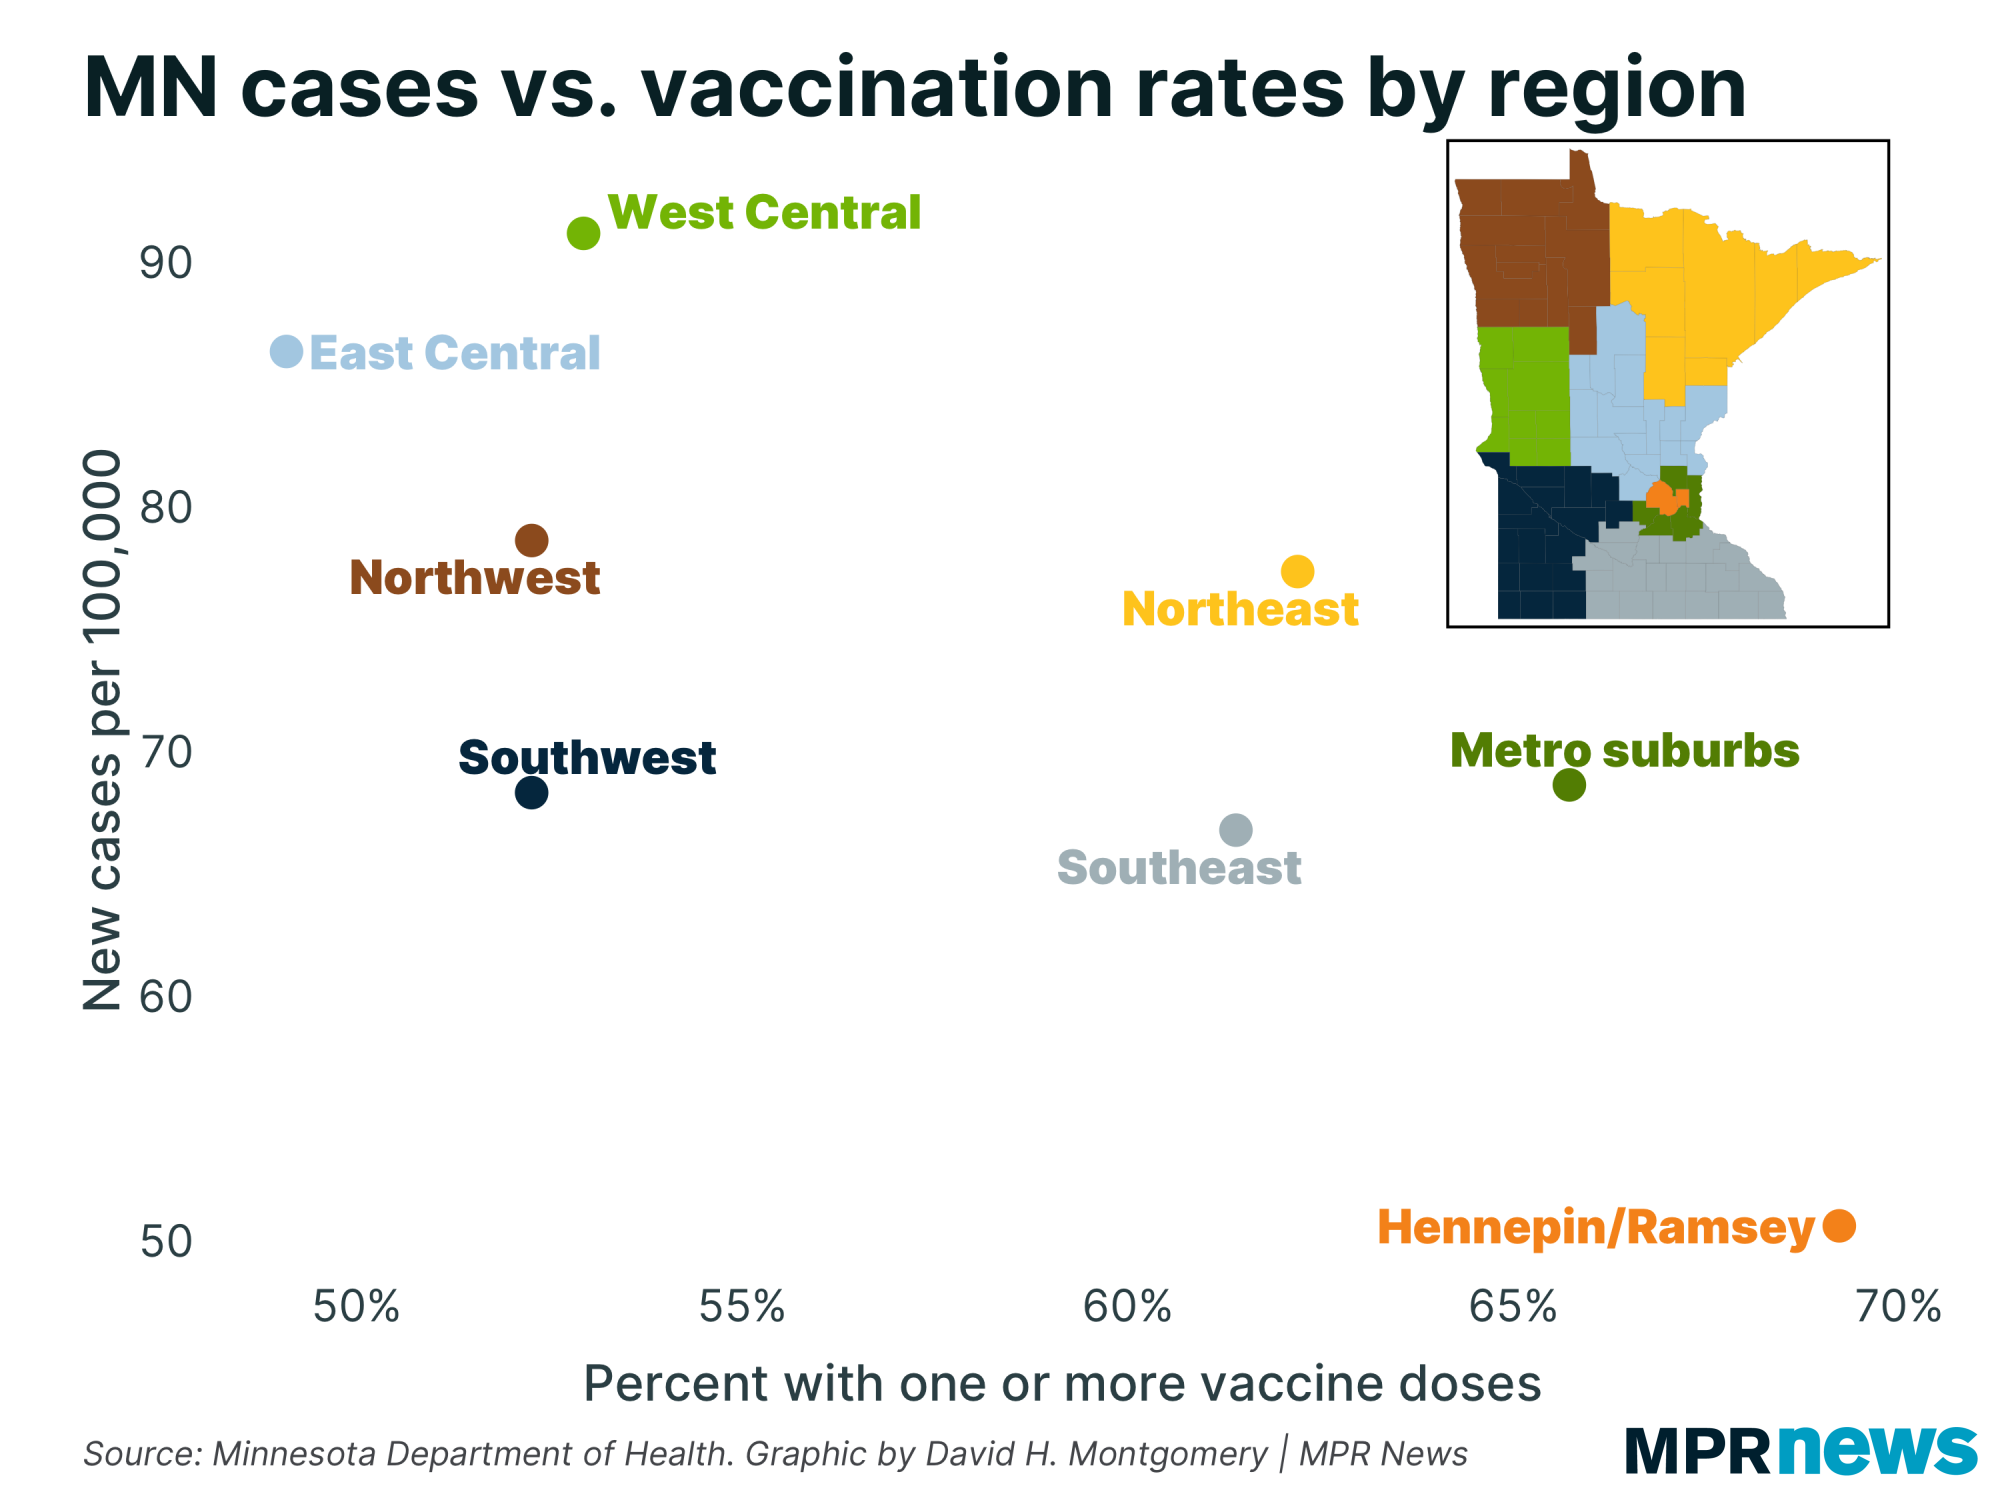
New cases concentrated in less-vaccinated regions
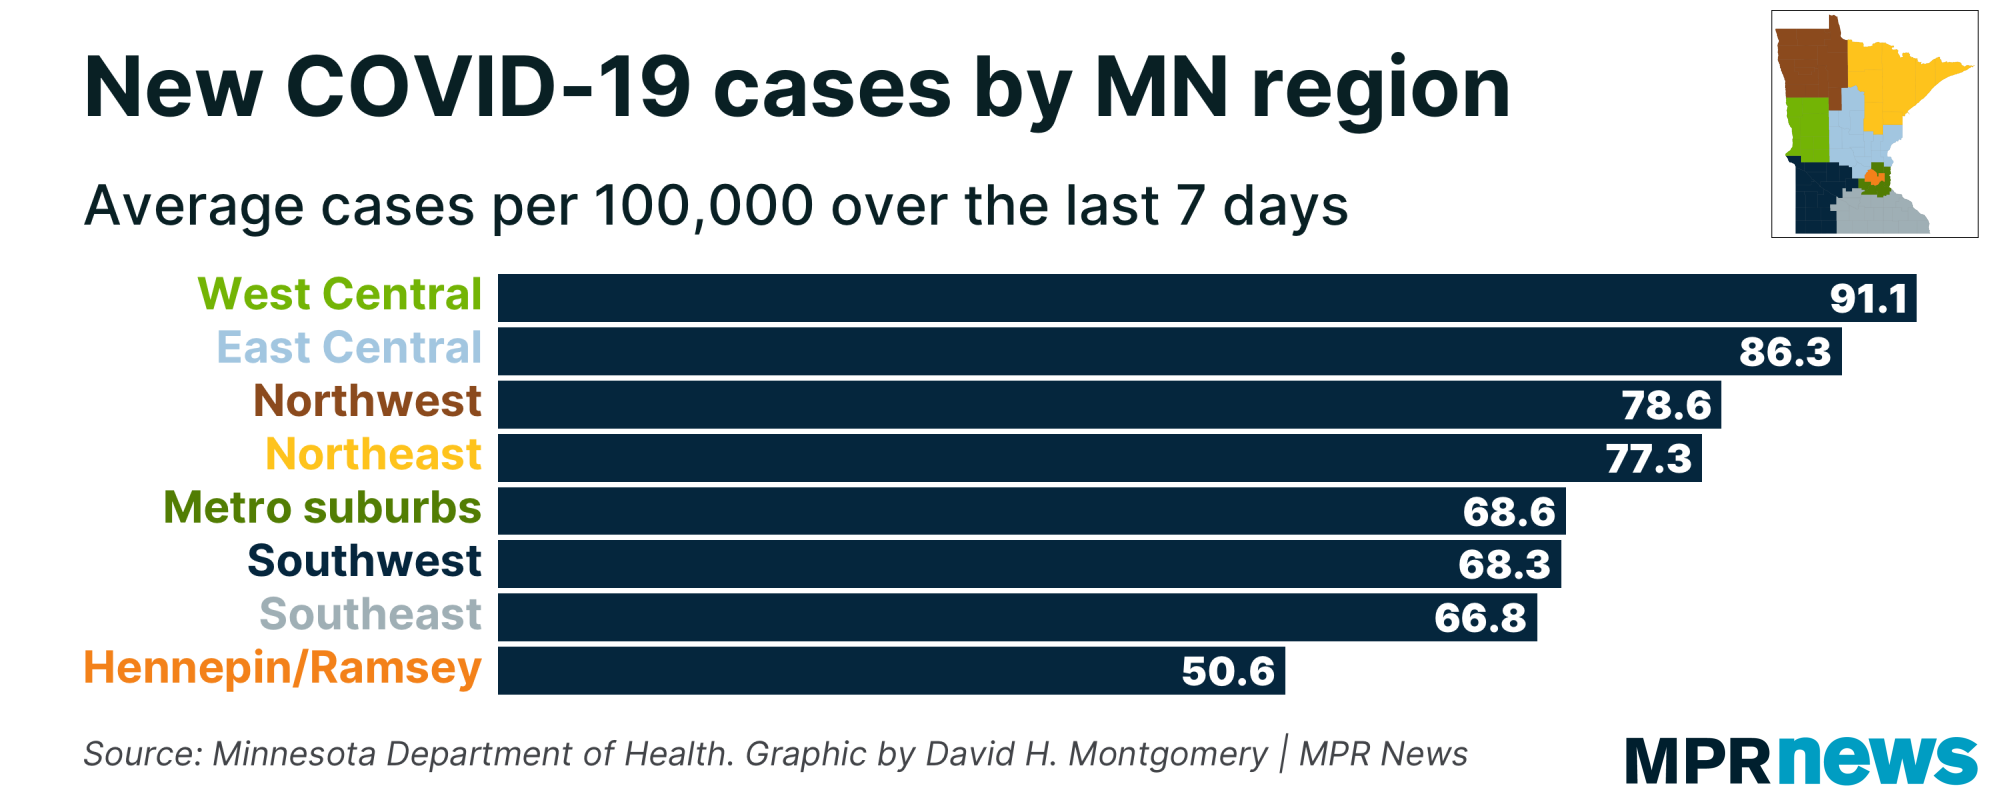
| | Where are all these COVID-19 cases? By and large, the hardest-hit parts of Minnesota right now are the rural parts, the western and central regions of the state. |
| |
|
|
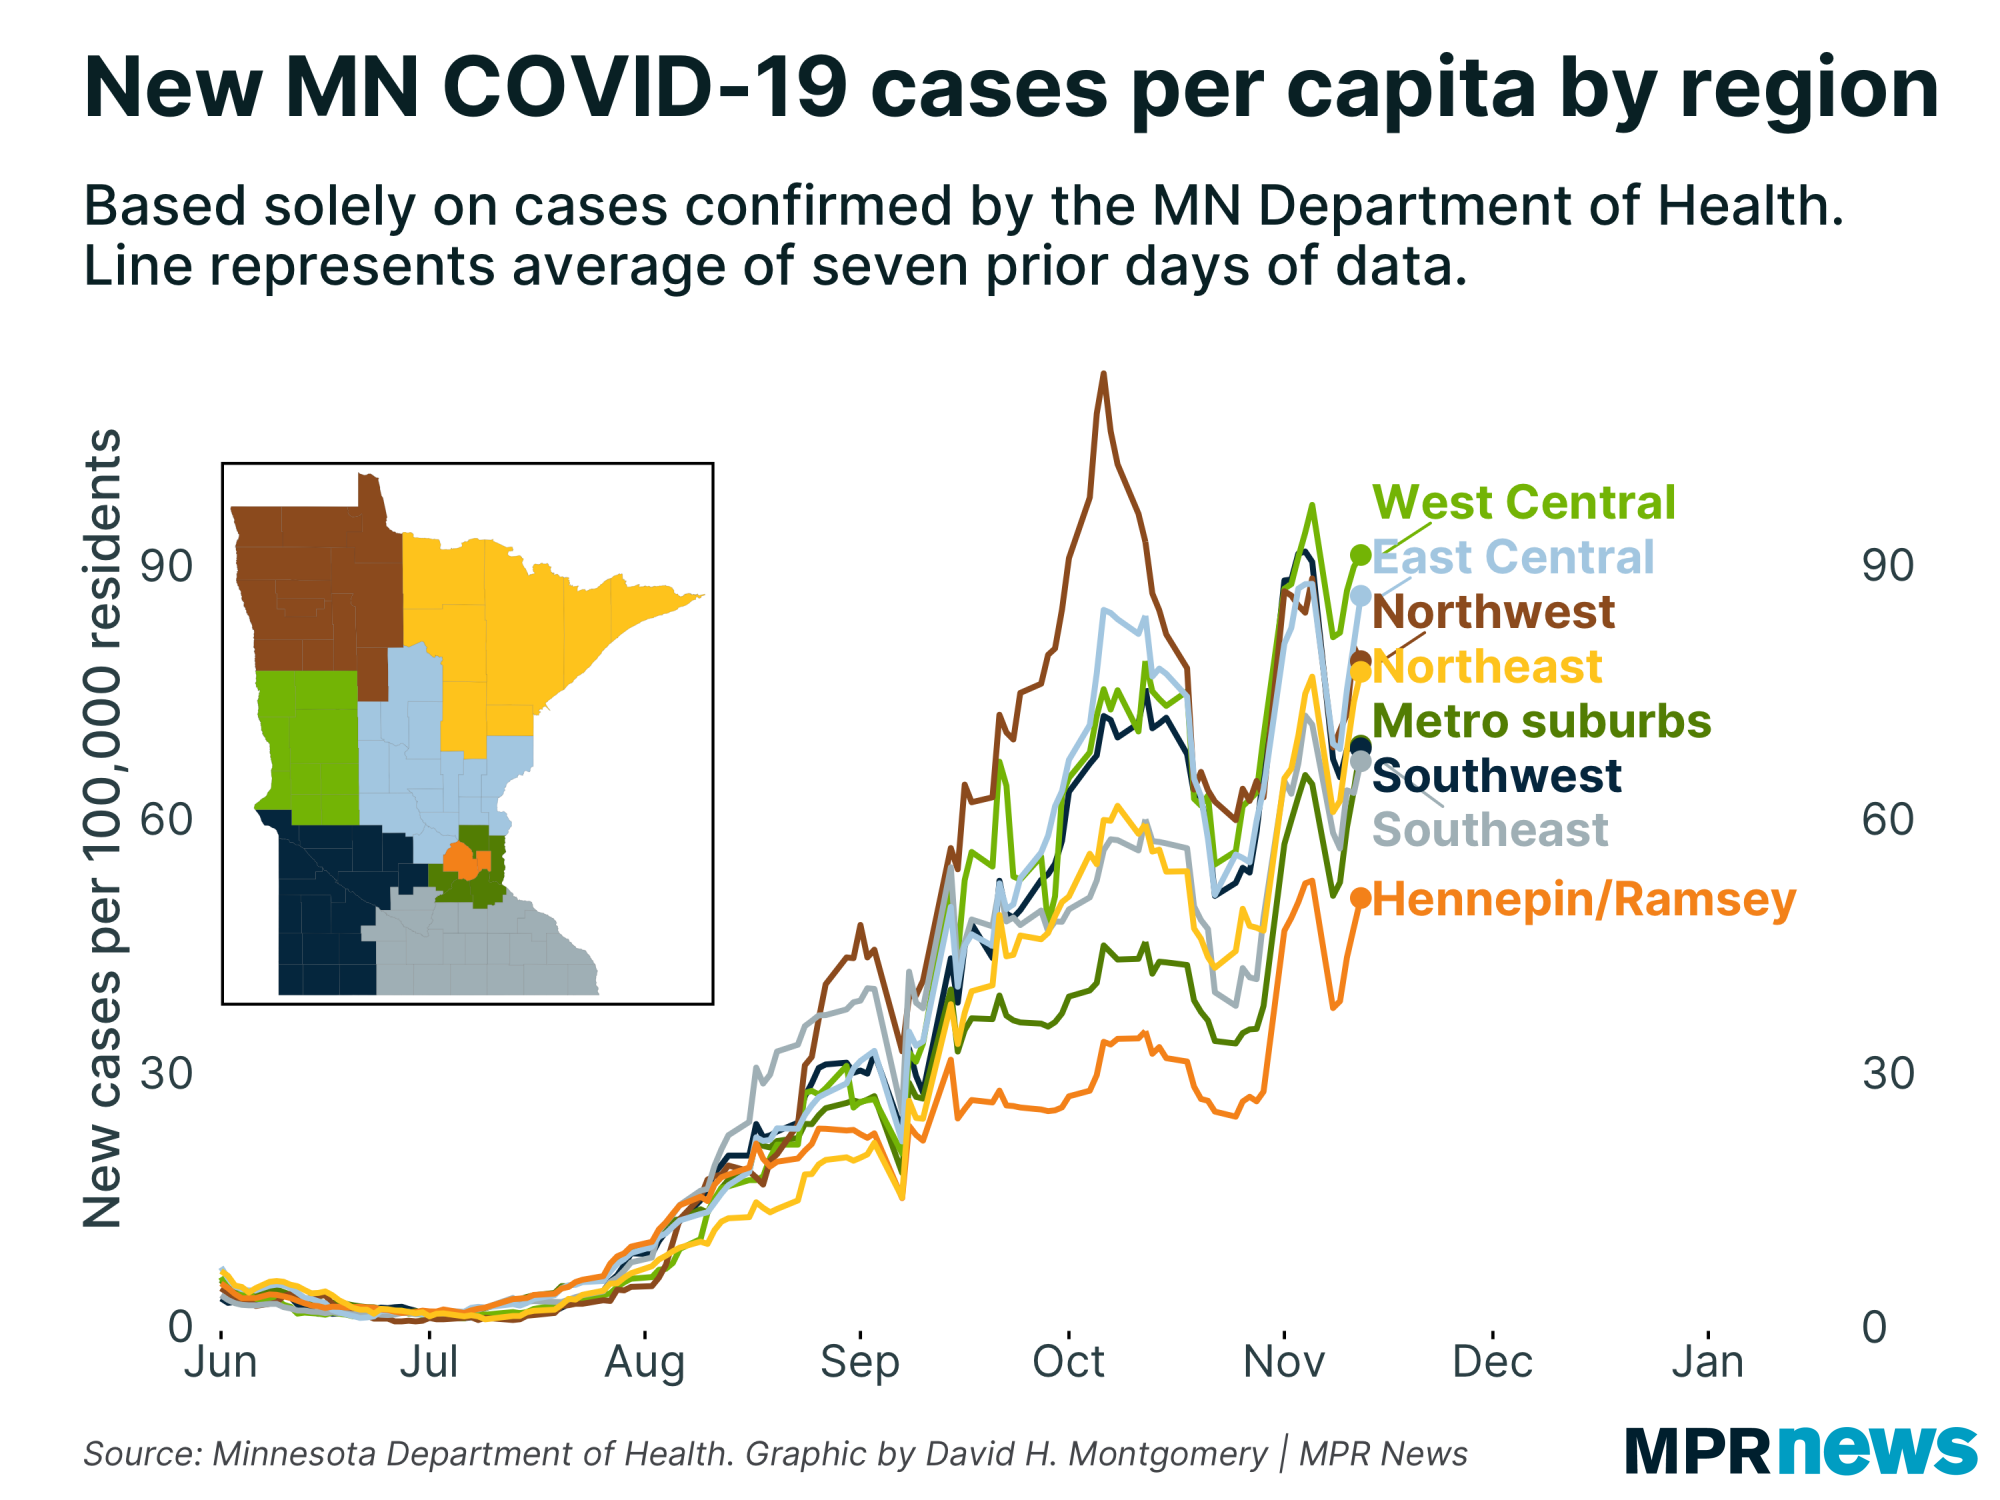
| That's not to say the metro's getting off easy, of course! Cases are elevated and rising everywhere. (Ignore that bump and decline in early November — that's caused by data artifacts. The current increase is legit, though.) | | |
|
|
| But it's probably not a coincidence that the Twin Cities metro is having the least severe COVID-19 outbreak right now, and central Minnesota the worst. Here's current case rates plotted against those region's vaccination rates. | | |
|
|
What's happening next?
|
We're not going to hit a peak next week. If we're lucky, what we'll see is a slowdown, of cases and positivity rates backing off the drastic increase we've seen this week, and growing more slowly. If that happens, and persists, that could then lay the groundwork for our long-desired peak.
Thanks for subscribing to this newsletter and for all of you who've sent me your feedback. As always, if you like this newsletter, please share it and the sign-up link with others who you think might enjoy it.
— David |
| |
|
|
Preference Center ❘ Unsubscribe You received this email because you subscribed or it was sent to you by a friend. This email was sent by: %%Member_Busname%%
%%Member_Addr%% %%Member_City%%, %%Member_State%%, %%Member_PostalCode%%
  |
|
|
| | |